The network for creativity
Join 1.25M professional creatives like you
Connect with clients, get discovered, and run your business 100% commission-free
Creatives on Contra have earned over $150M and we are just getting started
Back to feedPost
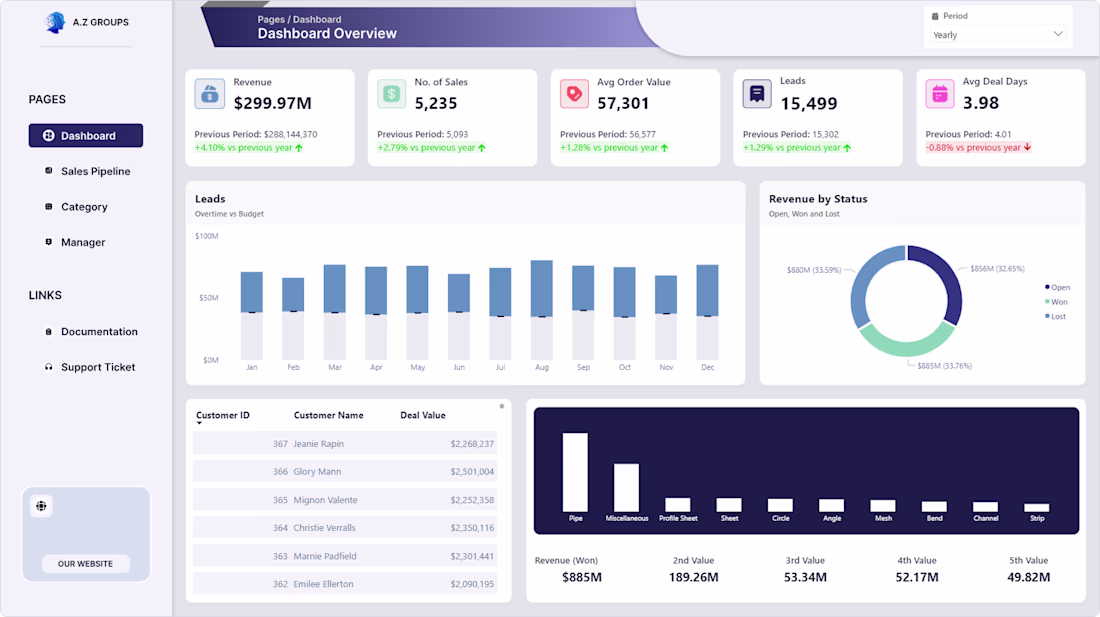
I’m happy to share another one of my Power BI projects — the Sales Analysis Dashboard.
I designed the dashboard layout in Figma first and then built it in Power BI. I used DAX to add advanced calculations and make the visuals dynamic and interactive. The main goal of this dashboard is to present sales data in a clear way so users can easily understand performance and trends.
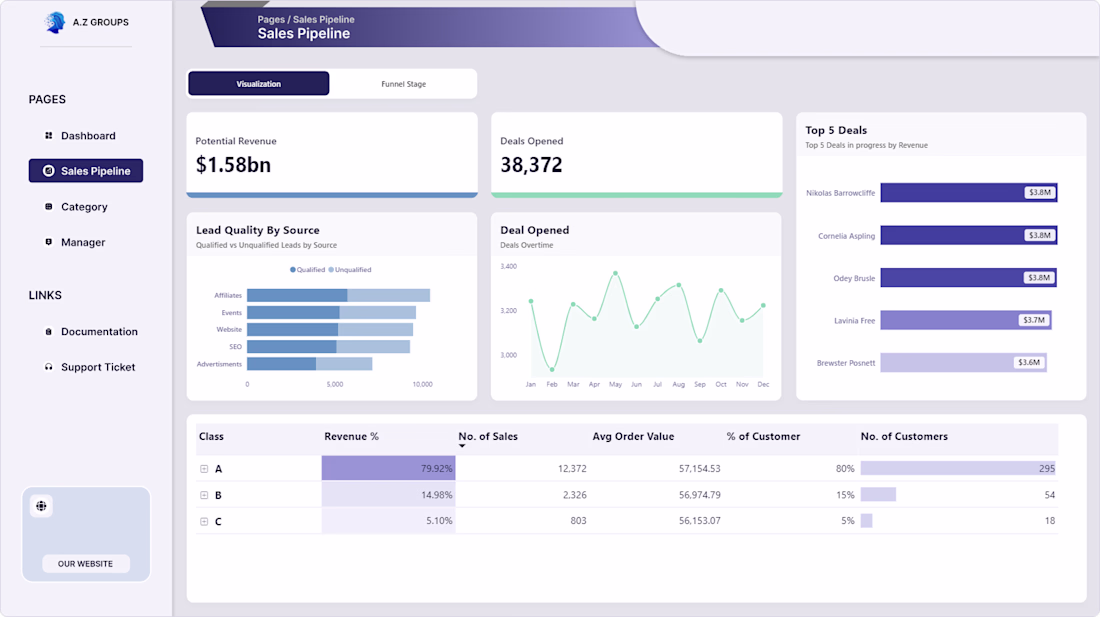
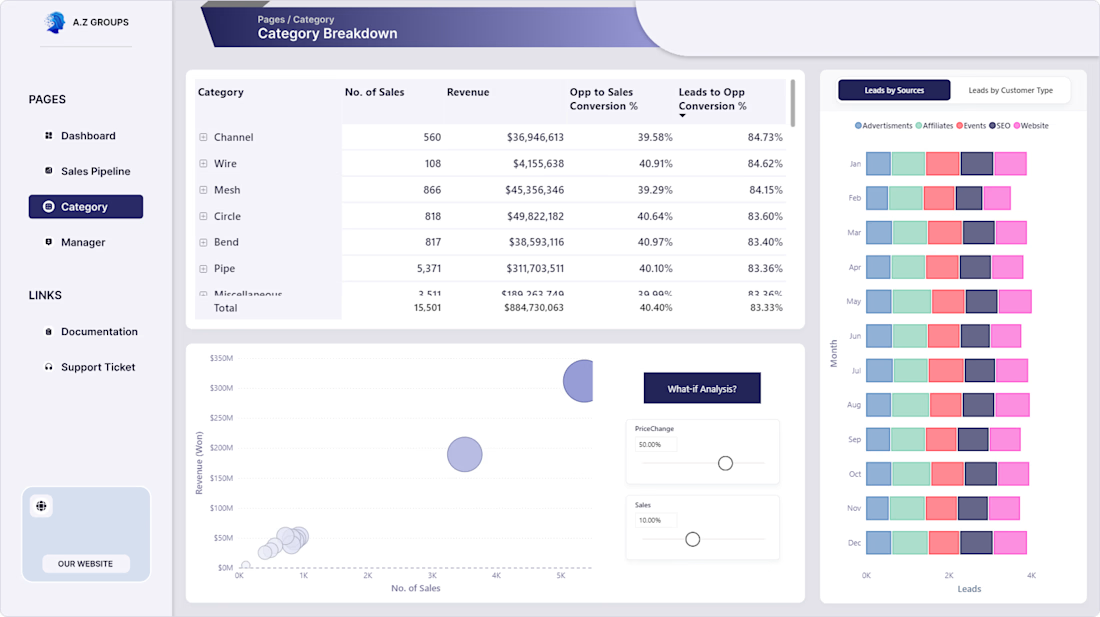
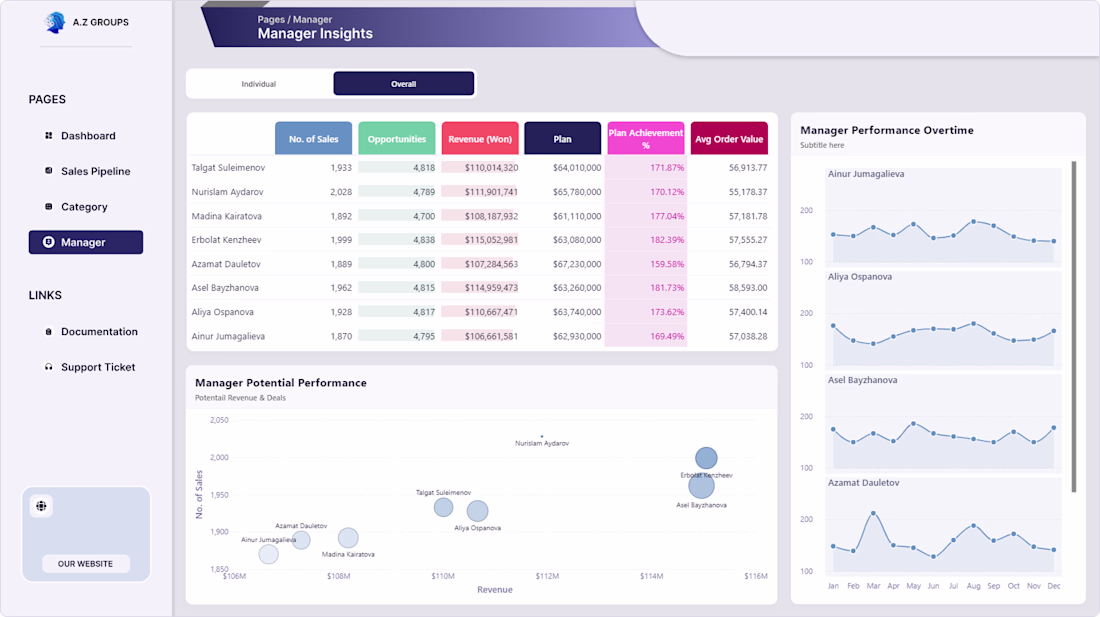
The dashboard shows important sales metrics using KPI cards, includes slicers for quick filtering, interactive visuals for deeper analysis, and smooth page navigation for a better experience. This project focuses on turning sales data into useful insights that support better decision-making.
I’d love to hear your feedback or suggestions.
The network for creativity
Join 1.25M professional creatives like you
Connect with clients, get discovered, and run your business 100% commission-free
Creatives on Contra have earned over $150M and we are just getting started
Trending
Claude
Claude has entered the design space. How are you using Claude Design?
Contra University
Learn from expert creatives how to earn more using next-gen AI tools.
MagicPath
The canvas is infinite, and exploration is becoming the workflow. How are you using MagicPath?
creativeaiflow
Creative AI workflows are evolving. What tools do you use, and what are their strengths and weaknesses?
freelancerlife
Freelancer life is wins, pivots, and everything in between. What’s yours right now?