The network for creativity
Join 1.25M professional creatives like you
Connect with clients, get discovered, and run your business 100% commission-free
Creatives on Contra have earned over $150M and we are just getting started
Back to feedPost
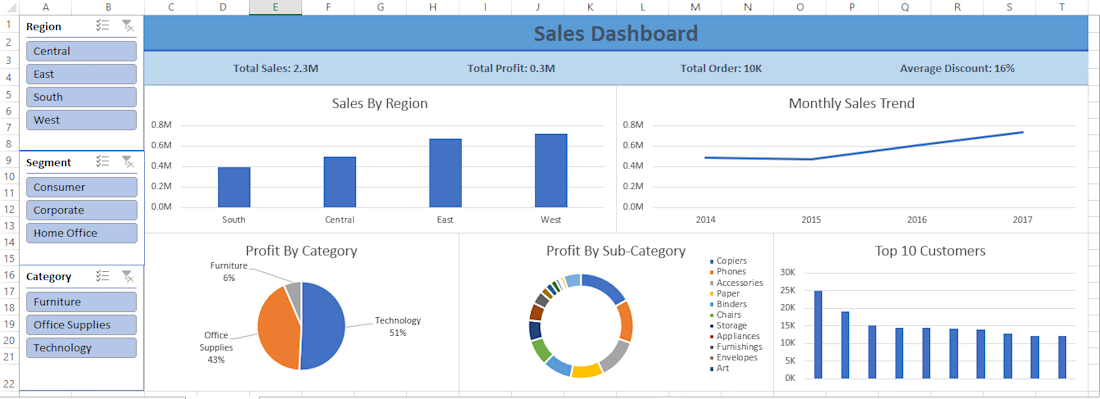
I Developed an interactive Excel dashboard to analyze sales performance, profitability, and customer behavior using transactional retail data.
The dashboard enables quick insights into regional performance, monthly trends, product profitability, and high-value customers.
Key metrics such as total sales, total profit, total orders, and average discount are highlighted using KPI indicators, while dynamic slicers allow users to filter the analysis by region, customer segment, and product category.
The project demonstrates the ability to transform raw business data into clear and actionable insights using spreadsheet analytics.
The network for creativity
Join 1.25M professional creatives like you
Connect with clients, get discovered, and run your business 100% commission-free
Creatives on Contra have earned over $150M and we are just getting started
Related posts
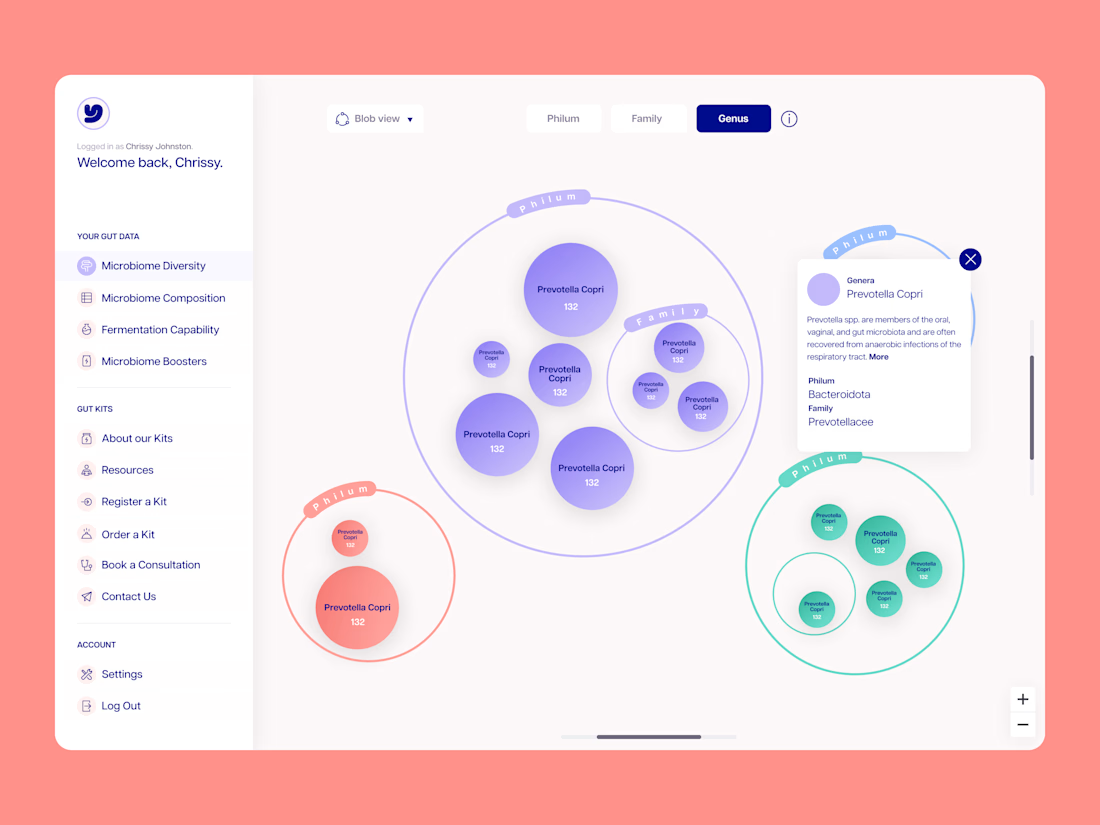
A little throwback to some Dashboard/Data work I was doing for Myota a while back! Still love the side nav
Good work
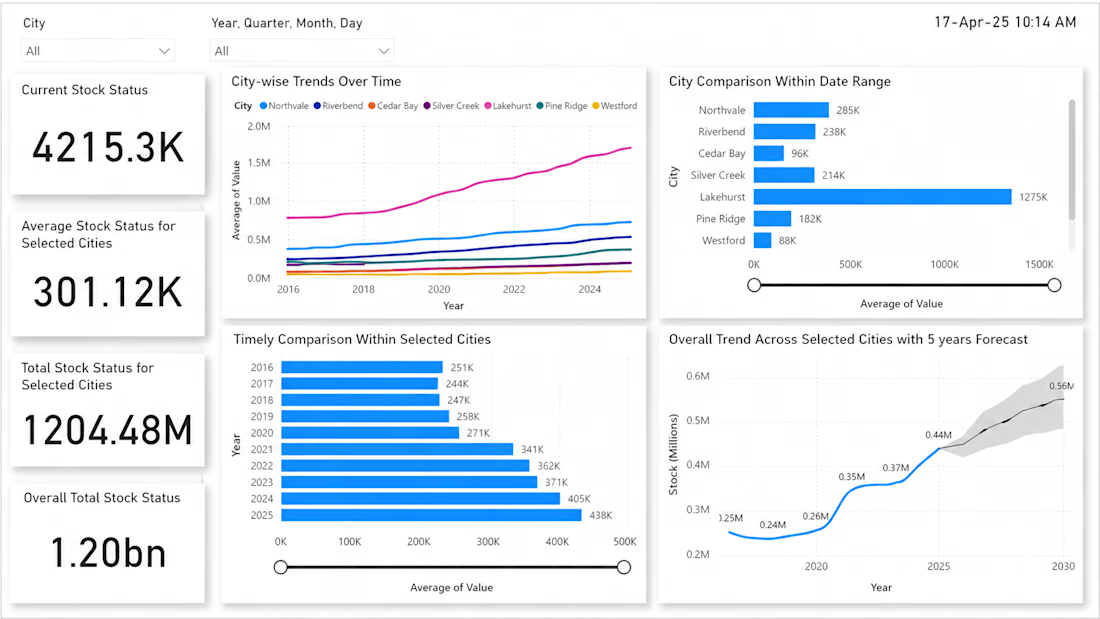
Built a clean, interactive stock status dashboard designed to help users monitor inventory trends, compare city-level performance, and understand overall stock movement over time. The dashboard presents key metrics such as current stock status, average stock status, selected-city totals, and overall stock volume in a simple executive summary layout.
The dashboard includes city and date filters, allowing users to narrow the analysis by location and time period. It also features city-wise trend lines, bar chart comparisons, year-over-year stock changes, and a five-year forecast to support planning and decision-making.
KEY FEATURES
KPI cards for quick stock status overview
City and date-based filtering
City-wise trend analysis over multiple years
Comparison of average stock values across selected cities
Yearly stock performance breakdown
Five-year forecast with projected stock movement
Clean Power BI-style layout for easy business reporting
TOOLS USED
Power BI, data visualization, dashboard design, trend analysis, forecasting, KPI reporting
IMPACT
This dashboard turns raw stock data into a clear visual report that makes it easier to identify high-performing regions, track stock growth, compare selected cities, and support inventory planning with forecasted trends.
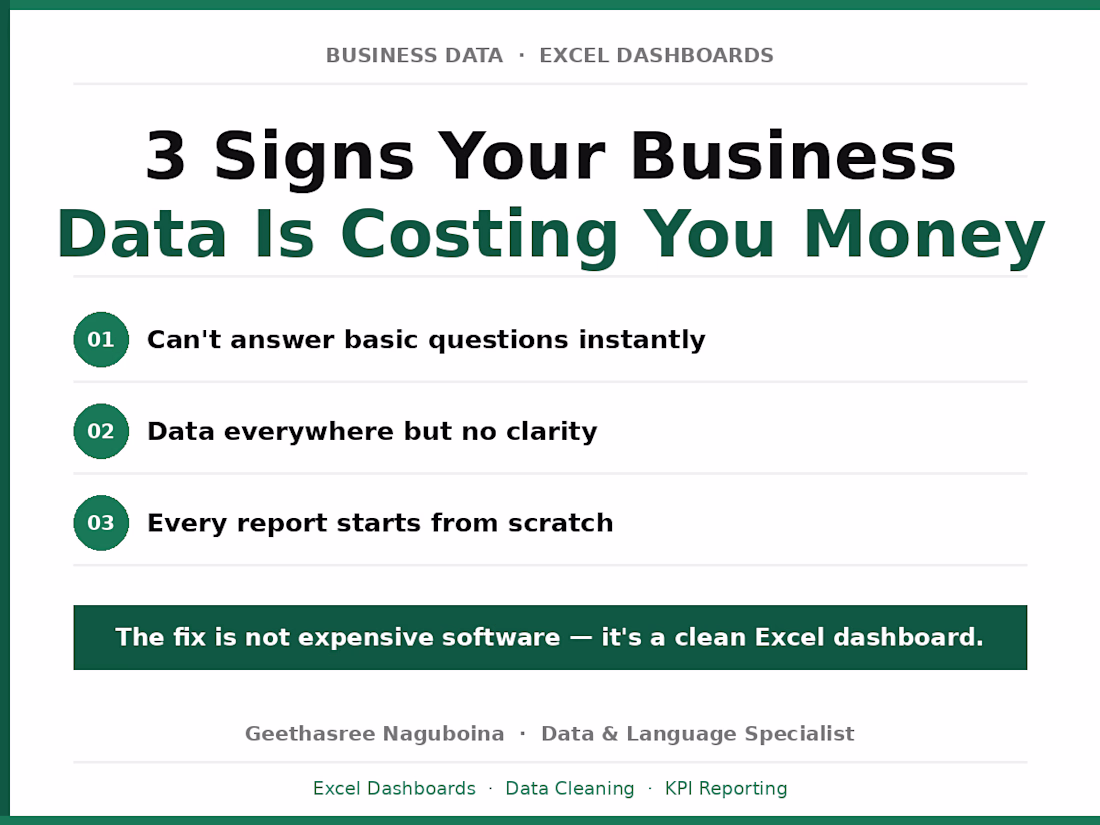
3 signs your business data is costing you money 📊
You can't answer basic questions instantly "What was last month's revenue?" — if finding the answer takes more than 2 minutes, your data is not structured properly.
You have data but no clarity Spreadsheets full of numbers but no clear view of what is growing, what is declining or what needs attention. Data without structure is just noise.
Every report feels like starting from scratch If preparing a weekly or monthly report takes hours instead of minutes — the system is broken, not the person doing it.
The fix is not expensive software.
A clean Excel dashboard built around your specific business takes 1 to 2 days to set up and saves hours every single week after that.
If any of these sound familiar — message me. Happy to share a sample.
#ExcelDashboard #DataCleaning #SmallBusiness #BusinessData #FreelanceIndia #D2C #FounderLife #Excel #DataAnalysis #KPIDashboard #MISReport #BusinessGrowth #StartupIndia
This is the right diagnosis. To add a 4th sign you know something is wrong with revenue but can't point to exactly where or how much. That gap between "sales feel off" and "here's the dollar figure on each leak" is usually a structural data problem before it's anything else. The...
Trending
Claude
Claude has entered the design space. How are you using Claude Design?
Contra University
Learn from expert creatives how to earn more using next-gen AI tools.
creativeaiflow
Creative AI workflows are evolving. What tools do you use, and what are their strengths and weaknesses?
portfolioreview
The best portfolios tell a story, not just show a grid. Share yours for feedback.
freelancerlife
Freelancer life is wins, pivots, and everything in between. What’s yours right now?