The network for creativity
Join 1.25M professional creatives like you
Connect with clients, get discovered, and run your business 100% commission-free
Creatives on Contra have earned over $150M and we are just getting started
Back to feedPost
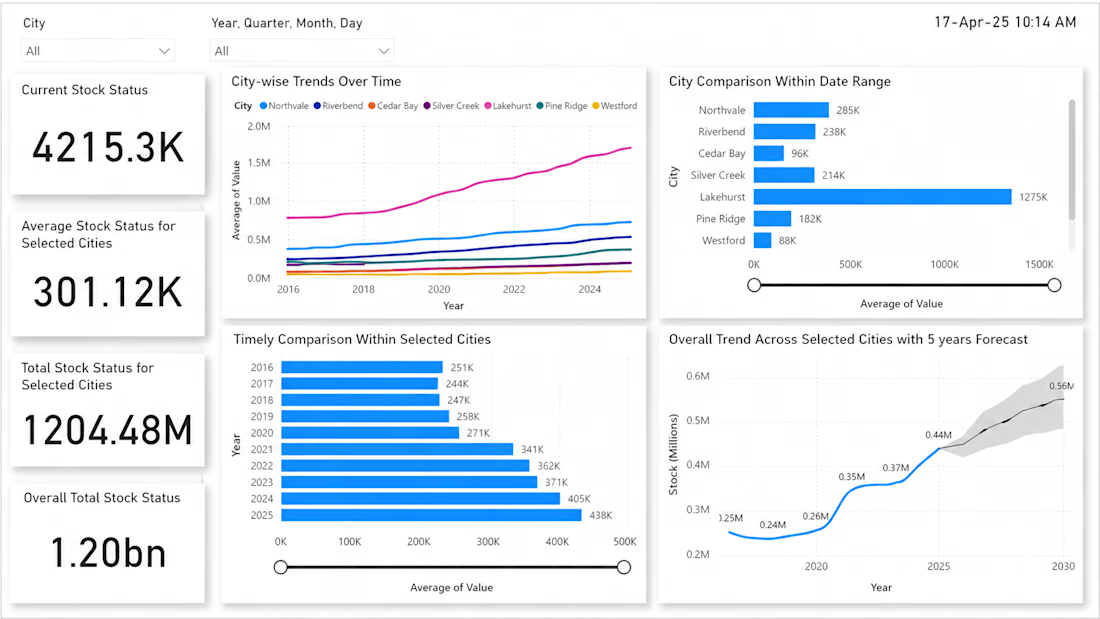
Built a clean, interactive stock status dashboard designed to help users monitor inventory trends, compare city-level performance, and understand overall stock movement over time. The dashboard presents key metrics such as current stock status, average stock status, selected-city totals, and overall stock volume in a simple executive summary layout.
The dashboard includes city and date filters, allowing users to narrow the analysis by location and time period. It also features city-wise trend lines, bar chart comparisons, year-over-year stock changes, and a five-year forecast to support planning and decision-making.
KEY FEATURES
KPI cards for quick stock status overview
City and date-based filtering
City-wise trend analysis over multiple years
Comparison of average stock values across selected cities
Yearly stock performance breakdown
Five-year forecast with projected stock movement
Clean Power BI-style layout for easy business reporting
TOOLS USED
Power BI, data visualization, dashboard design, trend analysis, forecasting, KPI reporting
IMPACT
This dashboard turns raw stock data into a clear visual report that makes it easier to identify high-performing regions, track stock growth, compare selected cities, and support inventory planning with forecasted trends.
The network for creativity
Join 1.25M professional creatives like you
Connect with clients, get discovered, and run your business 100% commission-free
Creatives on Contra have earned over $150M and we are just getting started
Related posts
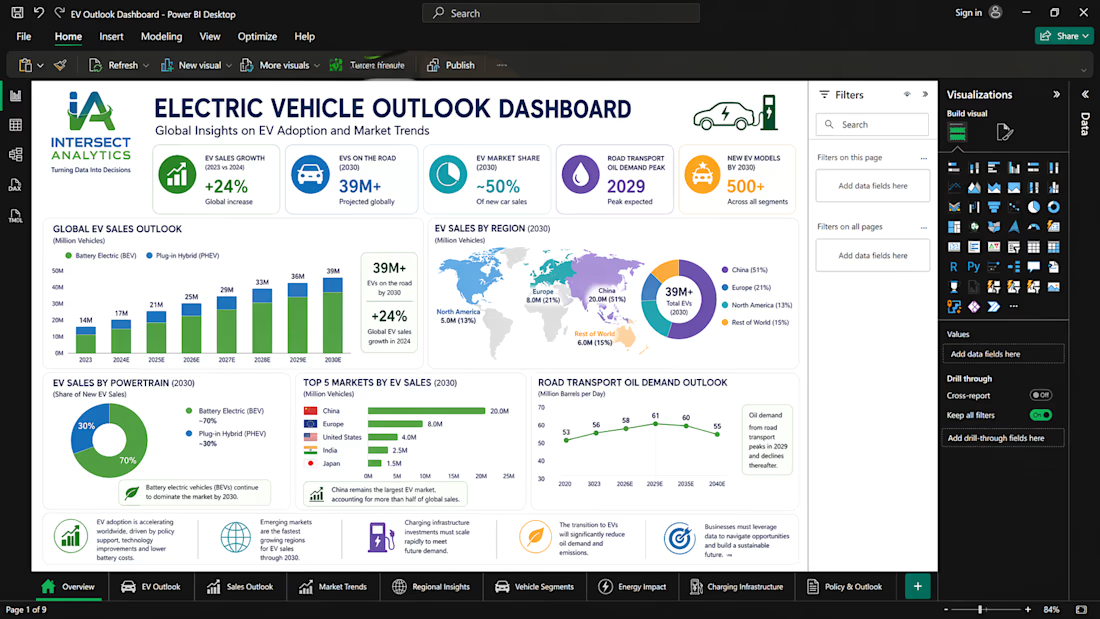
🌍 Electric Vehicle Market Overview & Key Findings
This dashboard presents a comprehensive analysis of the global shift toward electric mobility, highlighting trends in EV adoption, sales growth, and market dynamics across key regions.
📊 Key Findings:
The global EV market is experiencing rapid acceleration, driven by policy support, technological advancements, and increasing environmental awareness.
Asia, particularly China, continues to dominate EV adoption, while Europe and North America show strong and consistent growth.
EV sales are steadily outpacing traditional internal combustion engine (ICE) vehicles, signaling a structural shift in the automotive industry.
Market expansion is supported by improvements in battery technology, cost reductions, and increased investment in charging infrastructure.
🔮 Market Outlook
EV adoption is projected to continue growing significantly over the next decade, with millions of new electric vehicles entering the market annually.
Emerging markets present untapped growth opportunities, although infrastructure and affordability remain key challenges.
The transition to electric mobility is expected to reshape global energy demand, reducing reliance on fossil fuels and accelerating sustainability goals.
Companies that leverage data-driven insights will be better positioned to navigate this evolving landscape and capture market share.
🚀 Powered by Intersect Analytics
At Intersect Analytics, we go beyond dashboards—we deliver actionable intelligence.
We help businesses:
✅ Transform raw data into strategic insights
✅ Build interactive Power BI dashboards
✅ Perform advanced Python data analysis
✅ Develop predictive models & forecasts
✅ Optimize operations through data-driven decision-making
📩 Whether you're in automotive, energy, finance, or consulting, we help you turn complex data into clear, actionable strategies that drive growth.
Let’s unlock the power of your data.
BizPulse — AI-Powered Business Analytics Dashboard
Built for the Anything Ship & Sell Remixathon on Contra.
What is BizPulse?
An AI-powered business analytics tool that transforms messy, raw sales data into a clean professional dashboard instantly — no coding or spreadsheet skills needed.
How it works:
Upload any messy CSV or Excel file
BizPulse auto-cleans your data and maps your columns
Get a full analytics dashboard with KPIs, charts and AI insights
Key Features:
Business Health Score out of 100
KPI scorecards — Revenue, Expenses, Profit Margin, Customers
6 interactive charts with hover tooltips
5 AI-generated plain English business insights
Revenue Goal Tracker with live progress bar
Export as PDF and CSV
No dataset? No problem!
Click "Try Sample Data" on the upload screen to instantly load a realistic fictional dataset and explore the full dashboard.
Try it here: https://bizpulse-879.created.app/
AXIOM — AI-powered SaaS platform.
Full pricing. FAQ. Dashboard preview.
axiom-eight-rose.vercel.app
Great one
Trending
Claude
Claude has entered the design space. How are you using Claude Design?
Contra University
Learn from expert creatives how to earn more using next-gen AI tools.
creativeaiflow
Creative AI workflows are evolving. What tools do you use, and what are their strengths and weaknesses?
portfolioreview
The best portfolios tell a story, not just show a grid. Share yours for feedback.
freelancerlife
Freelancer life is wins, pivots, and everything in between. What’s yours right now?