
Zohaib Rahim
Production-grade AI systems, built in days.
New to Contra
Zohaib is building their profile!

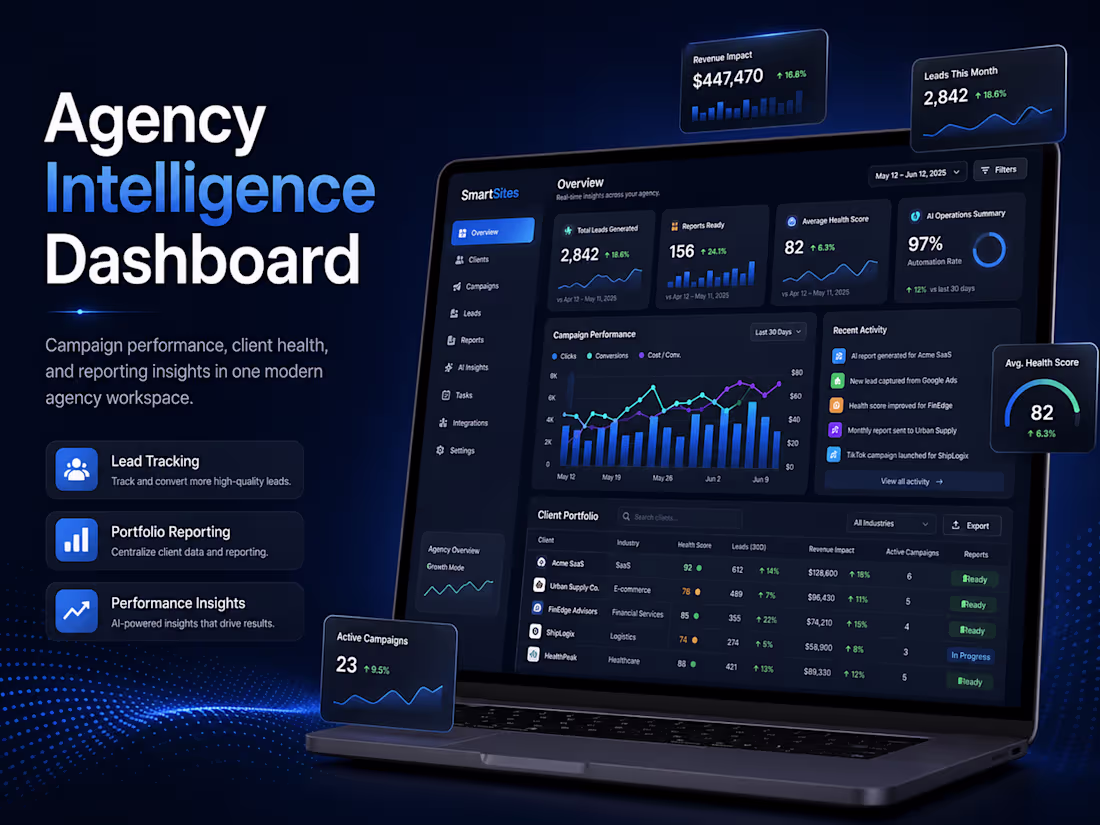
Built an Agency Intelligence dashboard concept designed for digital marketing agencies managing multiple client campaigns. The dashboard provides a centralized view of agency health, including total leads generated, reports ready, average client health score, AI-powered campaign summaries, recent activity updates, and client portfolio performance.
The project focuses on clean dashboard design, business intelligence presentation, and agency workflow visibility, helping teams monitor performance, review client status, and generate reports from one professional interface.
KEY FEATURES
Agency portfolio overview dashboard
KPI cards for leads generated, reports ready, and health score
AI operations summary for quick performance insights
Recent activity/pulse section for campaign updates
Client portfolio table with status and performance tracking
Real-time and last-30-days filter options
Report generation and portfolio summary download actions
Clean enterprise-style UI for agency operations
1
32
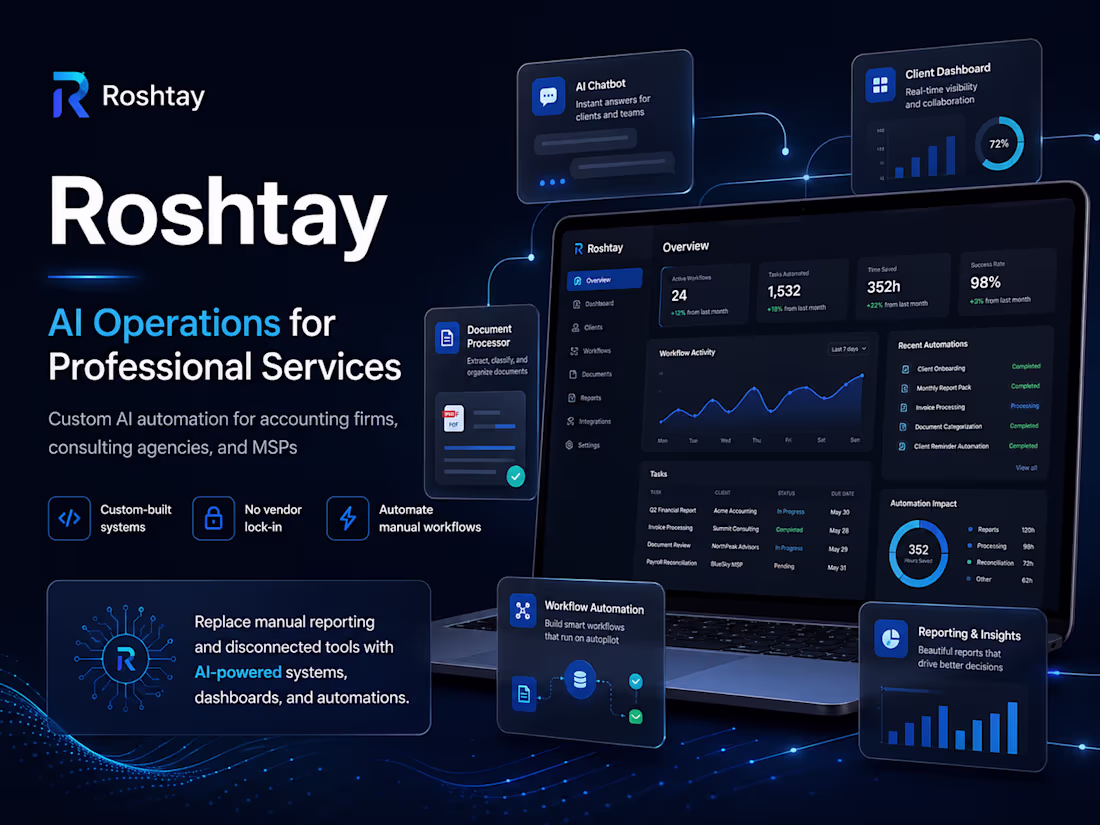
Built Roshtay (http://Roshtay.com), a modern AI automation website for professional service firms. The site presents Roshtay as an AI operations partner that helps accounting, consulting, and service-based businesses automate manual reporting, connect disconnected systems, and recover billable hours through custom-built workflows, dashboards, and AI-powered tools.
The project included a full responsive website structure, premium SaaS-style design, service pages, demo sections, proof-based work examples, blog content, FAQ, and a clear booking flow for automation audits.
1
39
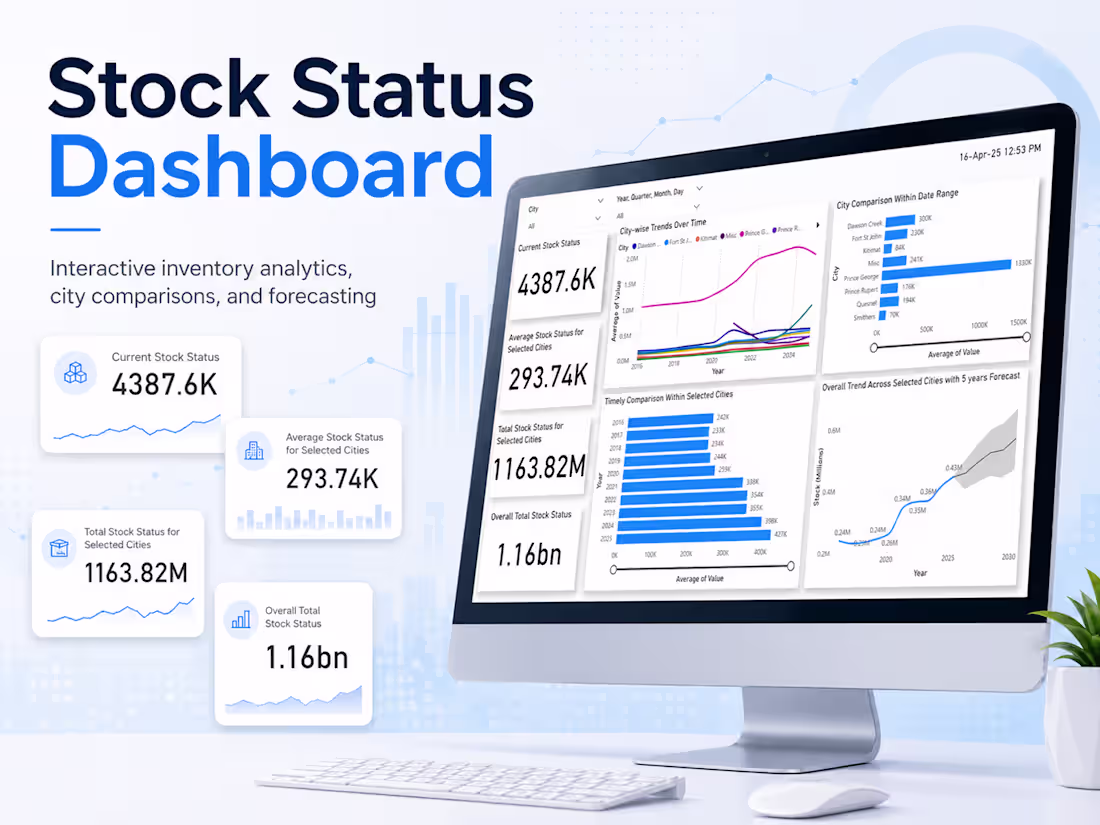
Built a clean, interactive stock status dashboard designed to help users monitor inventory trends, compare city-level performance, and understand overall stock movement over time. The dashboard presents key metrics such as current stock status, average stock status, selected-city totals, and overall stock volume in a simple executive summary layout.
The dashboard includes city and date filters, allowing users to narrow the analysis by location and time period. It also features city-wise trend lines, bar chart comparisons, year-over-year stock changes, and a five-year forecast to support planning and decision-making.
KEY FEATURES
KPI cards for quick stock status overview
City and date-based filtering
City-wise trend analysis over multiple years
Comparison of average stock values across selected cities
Yearly stock performance breakdown
Five-year forecast with projected stock movement
Clean Power BI-style layout for easy business reporting
TOOLS USED
Power BI, data visualization, dashboard design, trend analysis, forecasting, KPI reporting
IMPACT
This dashboard turns raw stock data into a clear visual report that makes it easier to identify high-performing regions, track stock growth, compare selected cities, and support inventory planning with forecasted trends.
1
47