The network for creativity
Join 1.25M professional creatives like you
Connect with clients, get discovered, and run your business 100% commission-free
Creatives on Contra have earned over $150M and we are just getting started
Back to feedPost
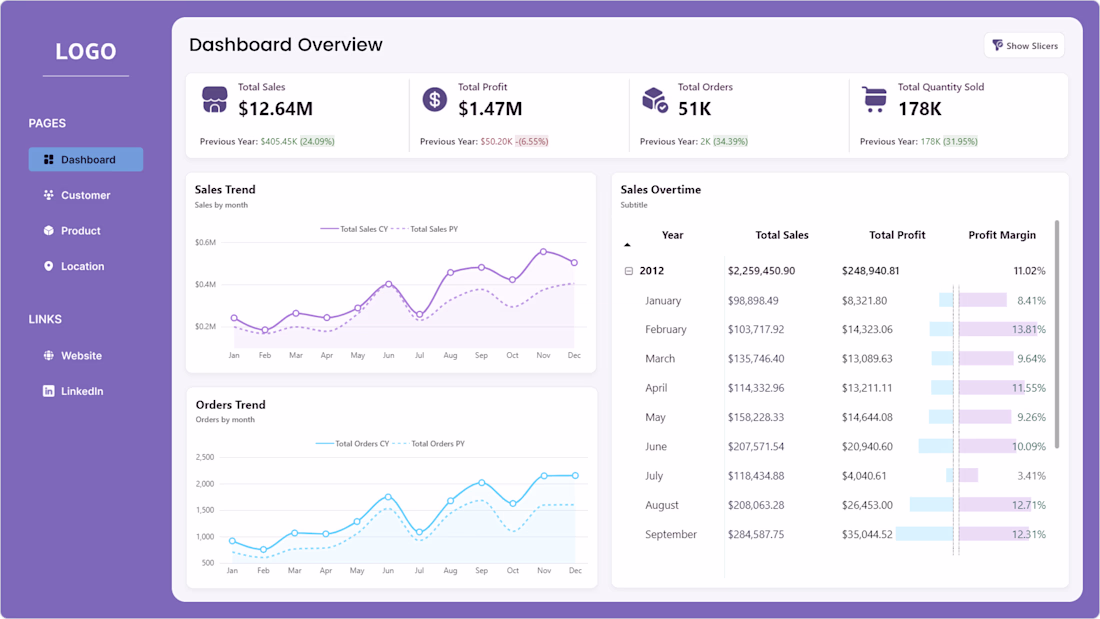
I’m excited to share my Store Sales Dashboard, created using Power BI.
I started this project by designing the dashboard in Figma and then developed it in Power BI. The focus was on making the dashboard interactive and easy to use, so users can quickly understand store performance and key sales metrics.
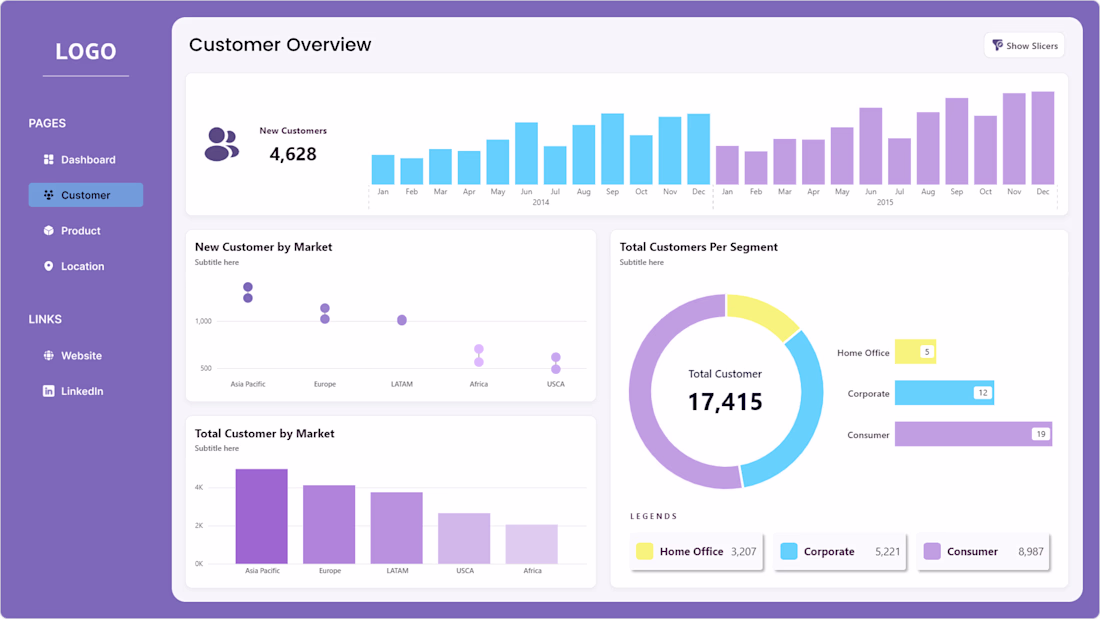
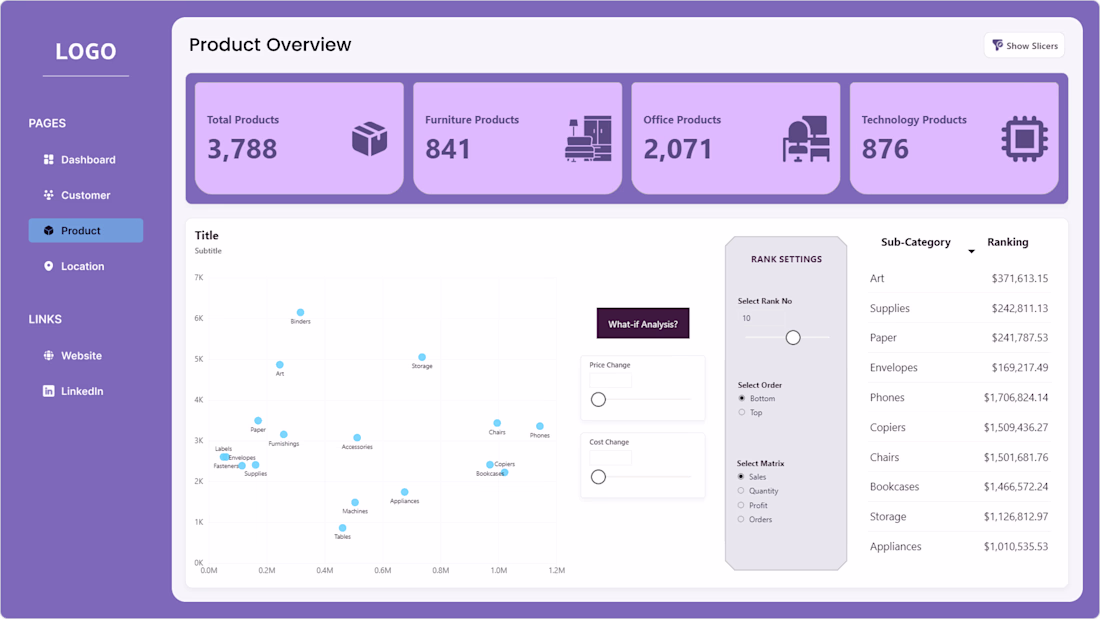
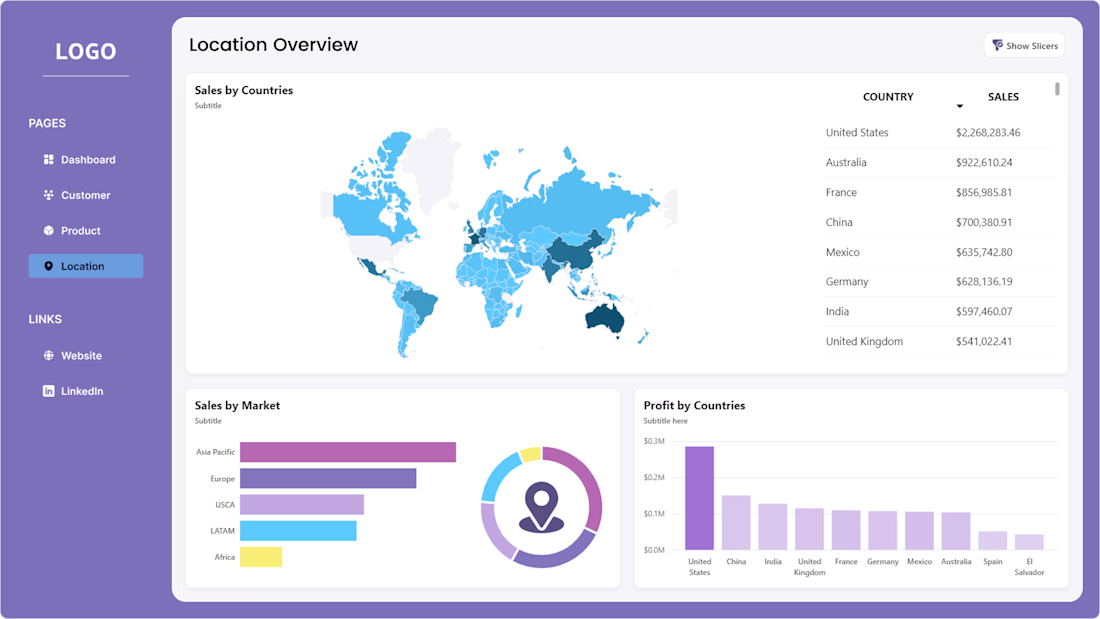
The dashboard displays important numbers through KPI cards and uses slicers and interactive visuals to explore the data in more detail. It also includes smooth page navigation to make the experience better. This project is all about helping businesses make better, data-driven decisions using clear and visually engaging dashboards.
Your feedback is always welcome.
The network for creativity
Join 1.25M professional creatives like you
Connect with clients, get discovered, and run your business 100% commission-free
Creatives on Contra have earned over $150M and we are just getting started
Trending
Claude
Claude has entered the design space. How are you using Claude Design?
Contra University
Learn from expert creatives how to earn more using next-gen AI tools.
MagicPath
The canvas is infinite, and exploration is becoming the workflow. How are you using MagicPath?
creativeaiflow
Creative AI workflows are evolving. What tools do you use, and what are their strengths and weaknesses?
freelancerlife
Freelancer life is wins, pivots, and everything in between. What’s yours right now?