

Enterprise Cloud · DevOps · AI/ML · Email · Marketing Expert
- $10k+
- Earned
- 13x
- Hired
- 4.6
- Rating
- 46
- Followers
Enterprise Cloud · DevOps · AI/ML · Email · Marketing Expert


I’m Usama Idrees, IT & AI Specialist based in Islamabad, Pakistan. Thrilled to be part of this amazing community and to connect with talented Professionals from around the world! 🚀
A little about me:
What I do: I lead tech and product strategy, focusing on building innovative solutions that empower businesses and individuals.
Passion: Creativity meets technology — I love turning ideas into impactful products.
Looking for: Collaborations with designers, developers, and creative minds who want to build something extraordinary.
Excited to learn, share, and grow together here. If you’re working on something cool or looking for a tech partner, let’s connect! 💡
What’s your current creative project? Drop it below — I’d love to check it out. 👇
2
30
951

Versatile wordsmith and design enthusiast





Data Scientist | Data Analyst | Power BI Specialist

Python Developer | ML, Data Science & Automation | Latex
New to Contra
Python Developer | ML, Data Science & Automation | Latex
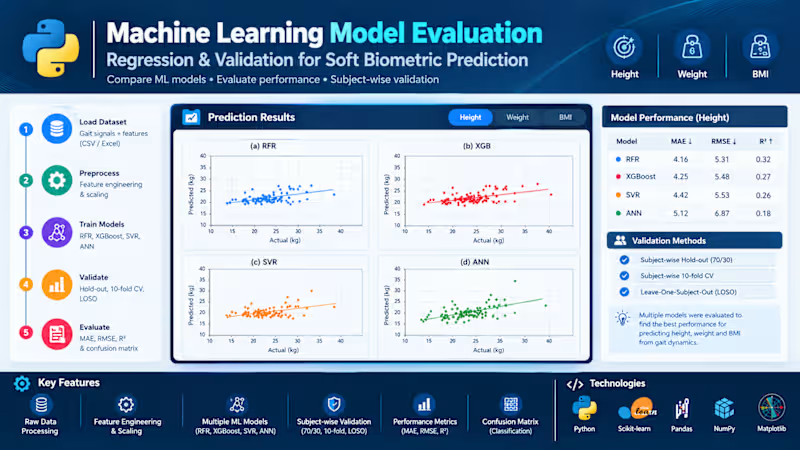
Machine Learning Model Evaluation for Soft Biometric Prediction
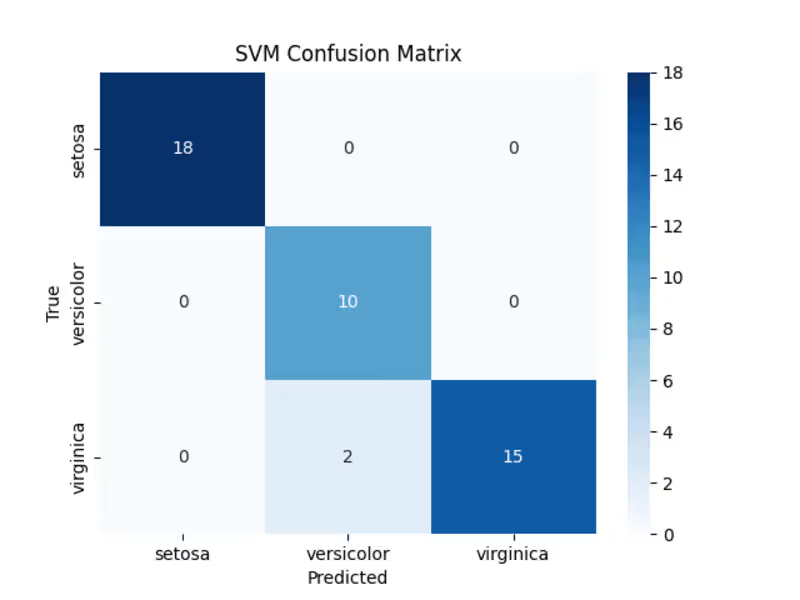
Developed and evaluated machine learning models to predict physical characteristics from human gait data collected using inertial sensors. The project compares Random Forest Regression (RFR), XGBoost, Support Vector Regression (SVR), and Artificial Neural Networks (ANN) using engineered gait features.
To assess model generalization to unseen individuals, multiple subject-wise validation strategies were applied, including hold-out validation, 10-fold cross-validation, and Leave-One-Subject-Out (LOSO). Performance was evaluated using MAE, RMSE, and R², with visual comparisons of actual and predicted values.
The project demonstrates an end-to-end workflow for data preprocessing, feature engineering, predictive modelling, and systematic performance evaluation.
0
15
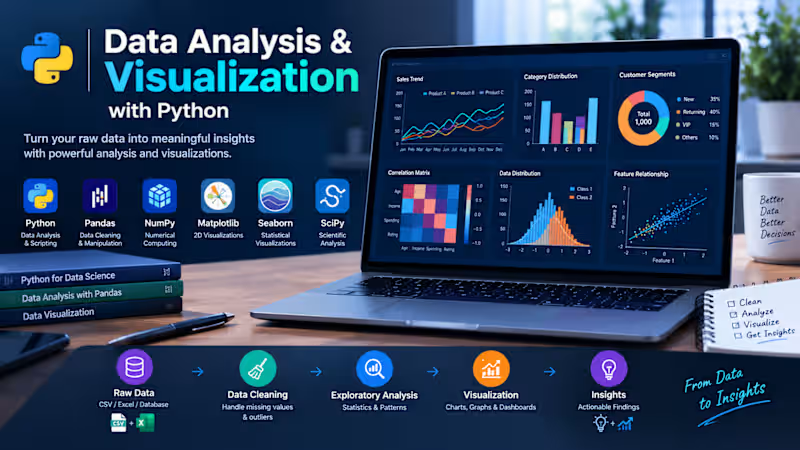
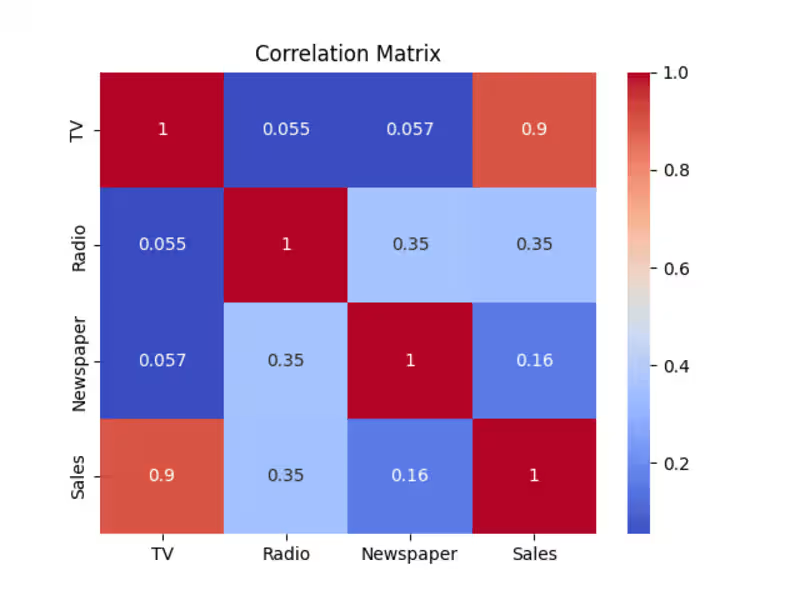
Data Analysis & Visualization with Python: Developed a Python-based data analysis workflow to transform raw datasets into meaningful insights through data cleaning, exploratory data analysis (EDA), statistical analysis, and visualization.
The workflow uses Python's data science libraries to organize datasets, identify patterns and trends, examine relationships between variables, and present findings through clear, informative charts and graphs. The goal is to make complex data easier to understand and support data-driven decision-making.
Key Features:
Data Cleaning & Preprocessing: Handle missing values, inconsistent entries, and data quality issues.
Exploratory Data Analysis: Investigate distributions, patterns, trends, and relationships within datasets.
Statistical Analysis: Calculate descriptive statistics and analyze correlations between variables.
Data Visualization: Create informative charts, graphs, and plots to communicate analytical findings.
Insight Generation: Summarize key observations in a clear and understandable format.
Reproducible Workflow: Use Python scripts and notebooks for transparent, repeatable analysis.
Technologies Used: Python · Pandas · NumPy · Matplotlib · Seaborn · SciPy
0
20
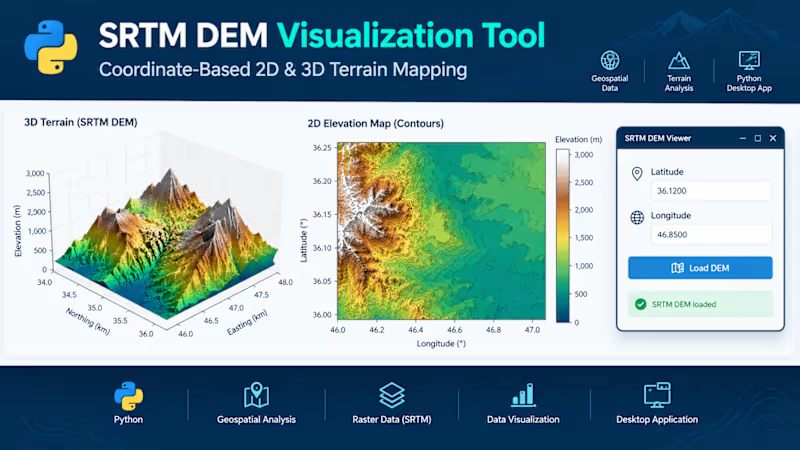
SRTM DEM Visualization Tool – Python Desktop Application
Developed a Python-based desktop application for visualizing Shuttle Radar Topography Mission (SRTM) Digital Elevation Model (DEM) data. The application allows users to enter geographic coordinates (latitude and longitude), load the corresponding elevation data, and explore terrain through interactive 2D and 3D visualizations.
The tool presents a 3D terrain surface to examine landscape features and a 2D elevation map with contour details and elevation-based color mapping. It combines geospatial data processing, raster analysis, and scientific visualization within a user-friendly graphical interface.
Key Features:
- Coordinate-based terrain data selection
- 2D elevation mapping and contour visualization
- 3D terrain surface plotting
- Elevation-based color mapping
- Desktop GUI for convenient data exploration
Technologies: Python, SRTM DEM, geospatial data processing, Matplotlib, 2D/3D visualization, and GUI development.
0
23
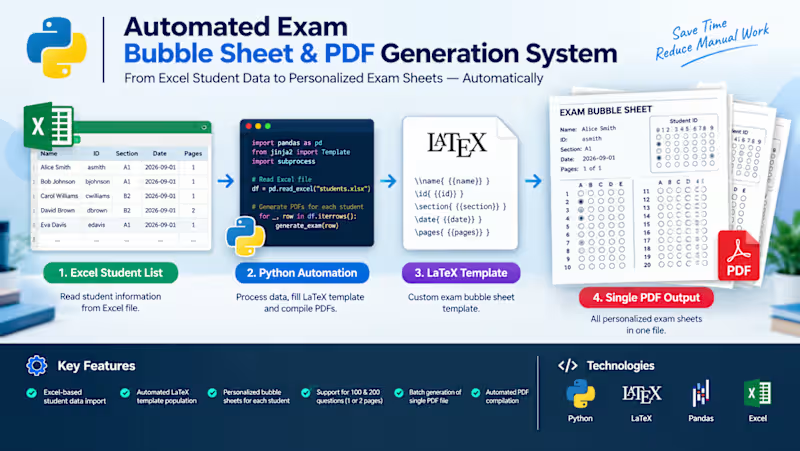
Developed a Python-based automation system that generates personalized exam bubble sheets in a single PDF file using student information stored in Excel.
The system reads each student's name, ID, section, exam date, and required sheet length from an Excel spreadsheet, then automatically populates a custom LaTeX exam template and compiles the output into a PDF document. Each student receives an individually personalized bubble sheet, with support for one-page exams containing up to 100 questions or two-page exams containing up to 200 questions.
The solution streamlines bulk exam preparation, reduces repetitive manual work, and ensures consistent formatting across all generated sheets.
Key Features:
Excel-based student data import
Automated LaTeX template population
Personalized bubble sheets for each student
Support for 100- and 200-question exams
Batch generation of a single multi-page PDF
Automated PDF compilation using Python
Technologies: Python, LaTeX, Pandas, Excel, pdflatex, PDF Automation.
0
21

Transforming Data into Actionable Insights 🔍
Transforming Data into Actionable Insights 🔍

Data Scientist & Analyst | Project Manager


View more →

Microsoft certified data scientist
Microsoft certified data scientist


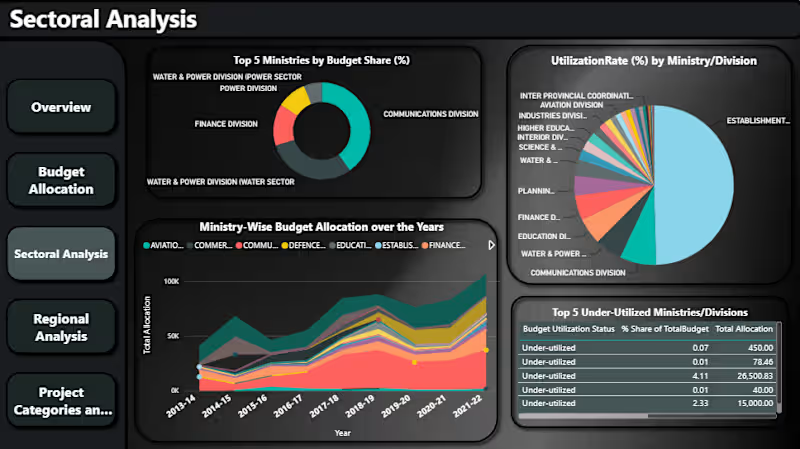
Data analyst building dashboards for SMEs
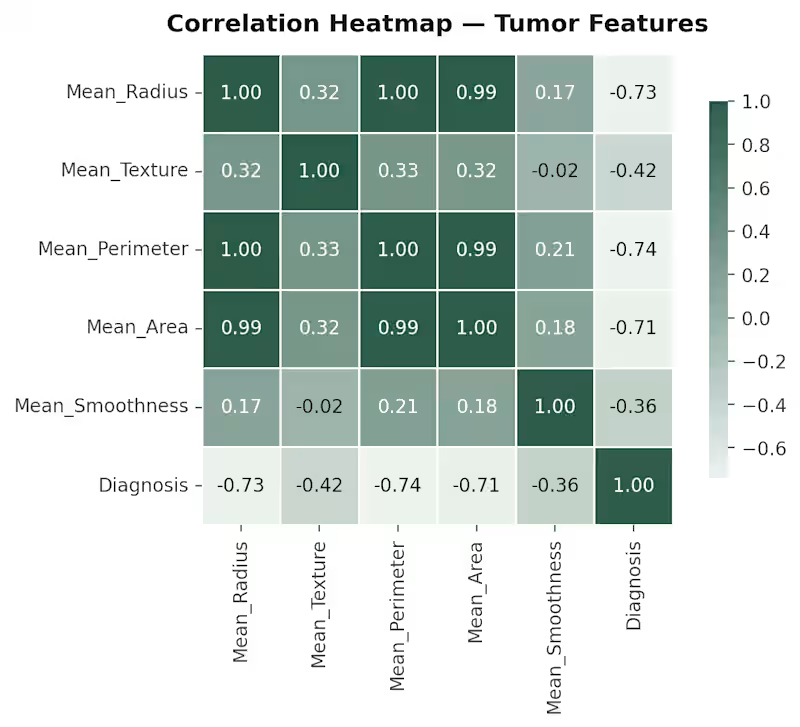
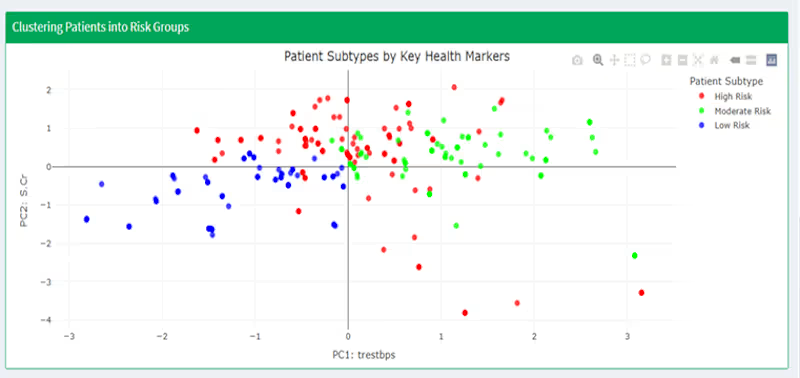
For a Predictive Analytics test model, I built two predictive models for clinical outcomes: a logistic regression classifier diagnosing tumours as malignant/benign (89.5% accuracy, 0.97 AUC) on the Breast Cancer Wisconsin dataset, and a multiple linear regression model predicting diabetes disease progression (R² = 0.49) from BMI, blood pressure, and cholesterol markers. Covered the full pipeline: EDA, multicollinearity diagnostics, train/test splitting, feature scaling, model evaluation, and individual patient-level predictions with clinical interpretation
1
191

My university Final Year Project featured a full-stack retail demand forecasting and inventory dashboard built for a 20-branch Pakistani retail SME. I built the Python (Prophet) forecasting pipeline across 14 product categories on 57,000+ rows of historical POS data, with a React/Node.js web app and Shopify API connector replacing an initial Power BI plan. The dashboard generates monthly stock recommendations (order more / hold / reduce), seasonal demand patterns tied to local events like Eid and wedding season, and live model accuracy tracking.
0
166
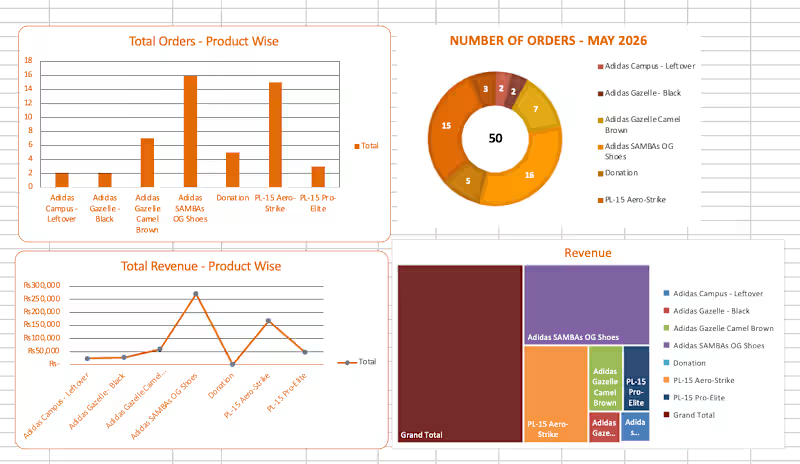
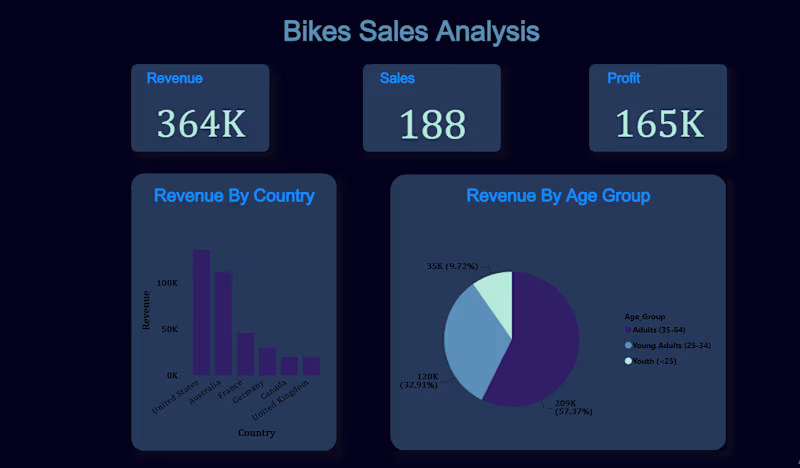
Some snippets of the Data Visualisation I did for a brand's Financial Analysis on Microsoft Excel- they valued the revenue and sales quantity most, which explains the limited, yet precise insights. It shows climbing and retained trends which the owner would then use for his new order quantity for best and poor performing products.
0
105
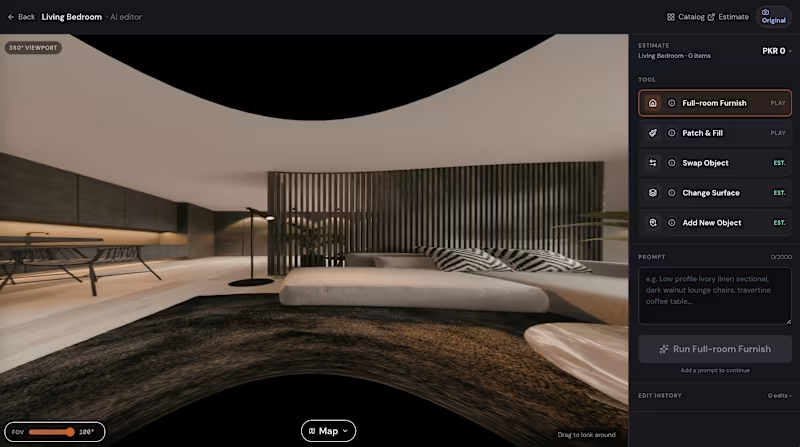
Interior-OS: From Room Photo to Client-Ready Design in One Workspace
Most architects and interior designers juggle 4-5 tools to get from a room photo and brief to a finished client presentation — one app for concepts, a spreadsheet for budgets, another tool for renders, and a fourth for the deck.
We built Interior-OS to collapse that into one AI-powered workspace:
→ Upload a room photo + design brief
→ Generate realistic design concepts
→ Get a live, editable budget as concepts evolve
→ Export a client-ready presentation
No exporting between tools. No re-formatting budgets by hand.
Currently in beta — opening a small cohort to architecture and interior design professionals for structured feedback before public launch. 1 month of free access in exchange for testing real projects and sharing what works, what doesn't, and what's missing.
Looking for professionals who work with residential or commercial interiors, renovation concepts, or client presentations regularly — your workflow is exactly what we're designing around.
DM me if you'd like early access, or drop a note with what tools you currently use to get from concept to client deck — genuinely curious how others are solving this today.
0
96