Power BI & Financial Data Modeling for a Data Journalist

Ayema Amir


Power BI & Financial Data Modeling for a Data Journalist
Turned 9 years of raw finance data into a fully modeled, story-ready Power BI system — from Python cleanup to insightful visualizations.
Problem Description:
A financial data journalist handed me the raw material of months of independent research, data pieced together from multiple government sources, and asked me to turn that effort into something insightful, structured, and story-driven. No predefined structure, no KPIs, no direction, just the numbers he'd worked hard to compile, needing to become something a reader could actually follow. I owned the full pipeline: cleaning, modeling, and building the narrative structure that makes the data readable.
The Challenge
Nine years of Balochistan development spending (2013-2022) arrived as 9 separate Excel sheets, one per fiscal year, reflecting how the source data itself had been collected over time, with inconsistent column names in nearly every sheet, and manual color-coding standing in for actual data fields. Financial data like this is unforgiving: a single misread sign convention or silently dropped row and every downstream number is wrong, so getting the raw handling right mattered as much as anything that came after.
My Approach
Python - Messy Data Handling
Ran a column-comparison check across all 9 sheets before touching the data, catching schema drift year to year
Parsed cell fill colors programmatically to convert a manual, visual coding convention into real structured columns (e.g. deriving a Gwadar-region flag from green-highlighted rows)
Normalized inconsistent column names across years so every sheet could be merged reliably
Generated a stable unique Project ID for every record, since project names alone weren't reliable keys, a cross-check caught 30,000+ mismatches where the same project name pointed to different IDs, the kind of silent error that quietly corrupts a model if missed early
Data Modeling - Handling Many-to-Many with a Bridge Table
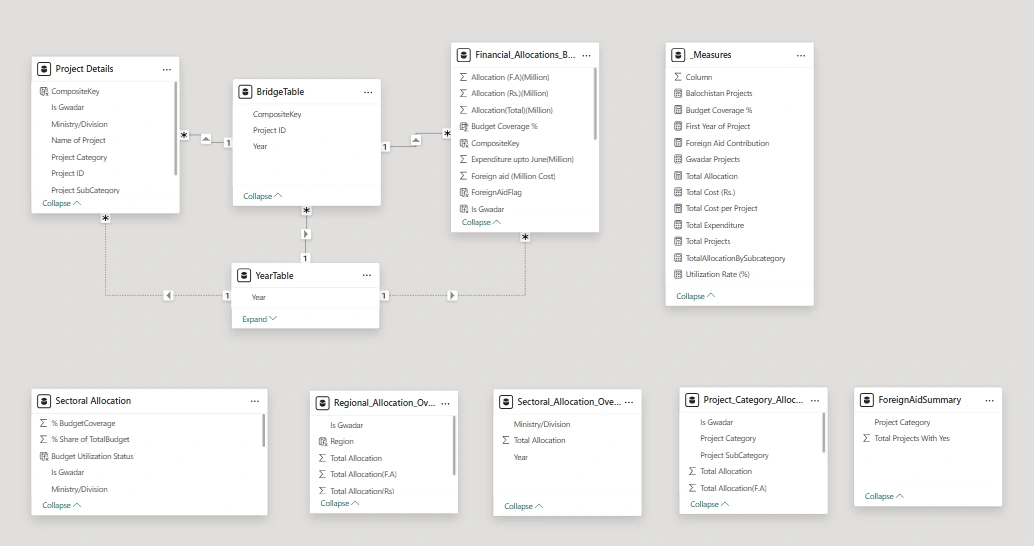
From the cleaned data, I built 2 base tables, Project Details and Financial Allocations, then modeled 8 additional tables through DAX to support real analysis:
A BridgeTable to resolve the core many-to-many challenge: one project spans multiple years, and one year contains many projects, kept both base tables clean while still allowing accurate cross-filtering
A dedicated YearTable for proper time intelligence
Purpose-built summary tables, Regional Allocation, Sectoral Allocation, Project Category Allocation, Foreign Aid Summary, each modeled around a distinct analytical lens without duplicating logic
A centralized _Measures table holding 12 DAX measures (Budget Coverage %, Utilization Rate %, Total Allocation, Total Cost per Project, Foreign Aid Contribution, and others), keeping every calculation auditable rather than scattered across visuals
Data Model
Data Storytelling
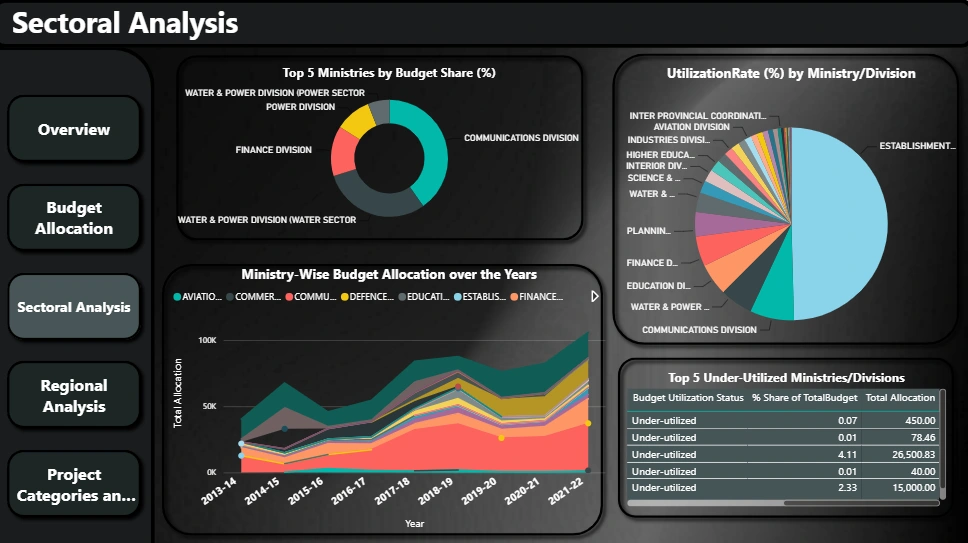
With no predefined angle from the client, I structured the model around a 5-page narrative arc, Overview, Regional Analysis, Sectoral Analysis, Project Category Analysis, and Foreign Aid Impact, so the report walks a reader through a specific, defensible story rather than just displaying numbers.
Skills
Python (pandas, openpyxl) · Data Cleaning & Normalization · ETL · Relational Data Modeling · Many-to-Many Relationship Handling · Schema Design · DAX · Power Query (M) · Power BI · Financial Data Analysis · Data Storytelling · Data Visualization
Tools
Python · Power BI · Power Query · DAX · Excel · openpyxl
Git-hub Link
Like this project
Posted Jul 22, 2026
Transformed 9 years of raw finance data into a clean, story-ready Power BI model with Python cleanup, DAX measures, and a compelling 5-page narrative.
Likes
1
Views
2
Timeline
Jul 11, 2025 - Jul 18, 2025