R Shiny Dashboard & Predictive Modeling for Heart Disease Risk

Ayema Amir


R Shiny Dashboard & Predictive Modeling for Clinical Heart Disease Risk
Built an end-to-end healthcare analytics pipeline, from clinical data cleaning to machine learning and an interactive R Shiny dashboard, using real patient data from Pakistan.
Problem Description:
Existing heart disease prediction models are almost universally built on Western datasets like Cleveland, which don't reflect Pakistani patient demographics or comorbidity patterns. I sourced a real clinical dataset of heart patients in Pakistan (several hundred records, 60+ clinical variables) and built the full pipeline myself: cleaning, statistical testing, predictive modeling, patient risk segmentation, and an interactive R Shiny dashboard that turns raw clinical data into a clinical decision support tool, not just a report.
My Approach
Data Cleaning & Preprocessing
Standardized inconsistent free-text symptom fields (e.g. "chest pain, sneezing and cough" vs "sneezing, chest pain and cough") by tokenizing, alphabetizing, and rewriting them in a consistent order, so identical symptom combinations weren't fragmented into false categories
Validated and encoded categorical/binary variables, checked numeric fields against physiological limits, and confirmed zero missing values before modeling
Statistical Analysis
Ran a Shapiro-Wilk normality test across all variables first, letting the actual distribution of the data (not assumption) decide which tests to use downstream
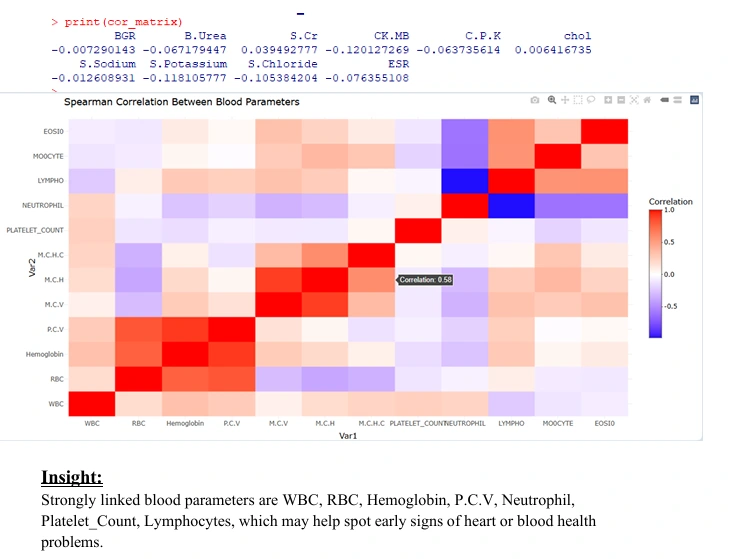
Applied Chi-Square tests for categorical associations (symptom type vs severity, lifestyle factors vs severity), Kruskal-Wallis and Mann-Whitney U for non-normal group comparisons (age vs severity, blood markers by gender), and Spearman correlation for non-linear relationships between biomarkers
Machine Learning
Built a Multinomial Logistic Regression and a Random Forest model to predict disease severity, pairing an interpretable baseline with a model that captures non-linear feature interactions and ranks feature importance
Built a Binary Logistic Regression model to predict mortality, using univariate screening (p < 0.1), VIF-based multicollinearity checks, and stepwise selection (stepAIC) to arrive at a lean, interpretable final model
Converted the mortality model's coefficients into a single weighted patient risk score, giving clinicians one number rather than a black-box probability
Clustering & Segmentation
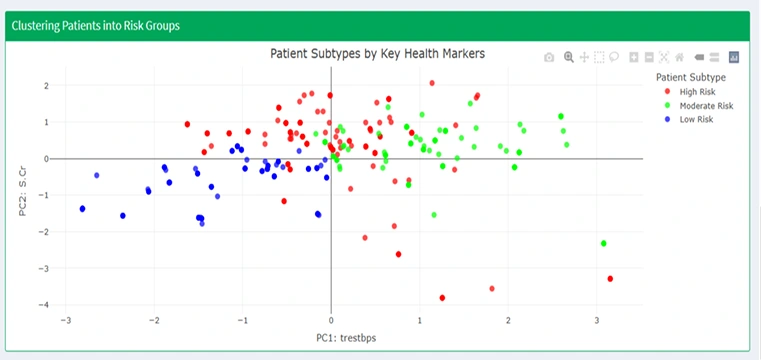
Applied K-Means clustering on key clinical markers (age, serum creatinine, CK-MB, cholesterol, resting BP, max heart rate) to segment patients into Low, Moderate, and High-Risk groups
Used PCA to reduce dimensionality and visualize cluster separation in a 2D interactive scatter plot
Dashboard Development
Built a 4-module interactive R Shiny dashboard (EDA, Hypothesis Testing, Models, Policy Suggestions) with dynamic tooltips and interactive plots, translating every statistical and ML output into a form a clinician or policymaker, not just a data scientist, can explore and act on
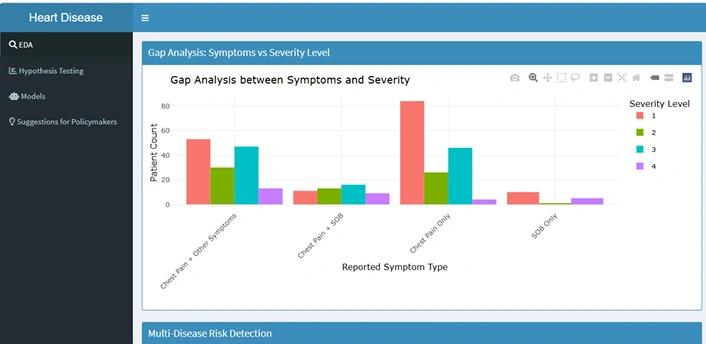
Dashboard
Skills
R Programming · Data Cleaning & Standardization · Exploratory Data Analysis · Statistical Hypothesis Testing (Chi-Square, Kruskal-Wallis, Mann-Whitney U, Spearman Correlation) · Multinomial & Binary Logistic Regression · Random Forest · Feature Engineering · Multicollinearity Analysis (VIF) · K-Means Clustering · Principal Component Analysis (PCA) · Interactive Dashboard Development · Healthcare Analytics · Data Storytelling
Tools
R · Shiny · shinydashboard · dplyr · tidyr · ggplot2 · plotly · randomForest · caret · MASS · nnet · cluster
GitHub Link
Like this project
Posted Jul 22, 2026
Built an R heart disease pipeline: cleaned patient data, ran statistical tests, trained models, clustered risk groups, and built a Shiny dashboard.
Likes
1
Views
2
Timeline
Feb 6, 2025 - Feb 14, 2025