Grid Load Forecasting & Blackout Risk Intelligence

Ayema Amir


Grid Load Forecasting & Blackout Risk Intelligence
A complete short-term electricity load forecasting pipeline built on GEFCom2014 — the benchmark dataset from the Global Energy Forecasting Competition. The project goes from raw hourly load data through rigorous statistical testing to a 13-model forecasting benchmark, and finally into a working dashboard that translates forecasts into real operational risk decisions for grid stability.
Tools used: Python · Time Series Analysis (ADF, ACF/PACF) · Statistical & ML Forecasting Models (SARIMA, ETS, Prophet, TBATS, Fourier Regression) · Dashboarding
Problem Statement
Grid operators need to know demand before it happens — not after. Underestimating load risks blackouts and overload; overestimating wastes capacity and investment. This project builds that forecasting capability end-to-end: from understanding the raw signal, to selecting the right model class through evidence rather than assumption, to turning the final forecast into a usable risk-monitoring tool.
Dataset
Sourced from GEFCom2014-L (Load track), the L1-train subset (Zone 1) — a widely used benchmark in the energy forecasting research community.
~85,440 rows, 28 columns, one record per hour
10 years of data (Jan 2001 – Sep 2010)
LOAD: target variable (electricity demand)
w1–w25: 25 anonymized weather station readings as exogenous drivers
Methodology
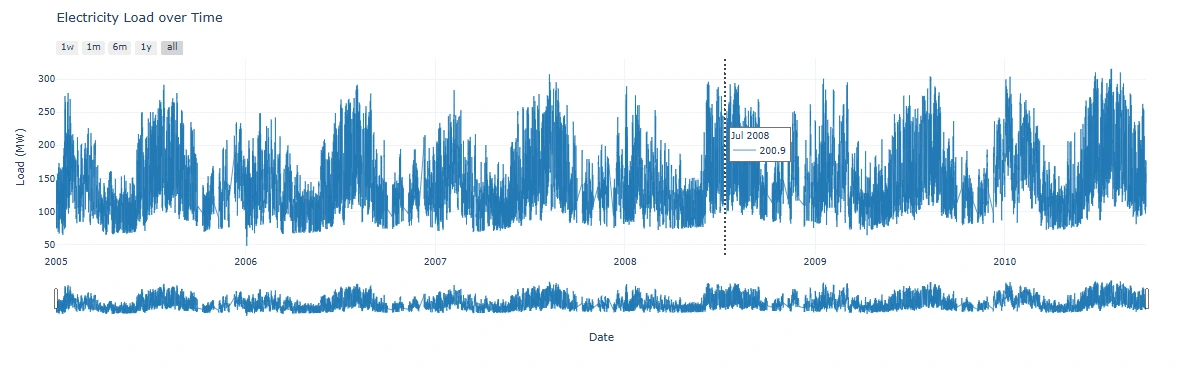
Exploratory Analysis — Trend, Seasonality, Variability
No strong long-term trend — load fluctuates but doesn't drift consistently up or down over the decade; patterns are recurring, not directional
Strong daily seasonality — demand peaks during the day and drops at night, visible clearly in hourly drilldowns
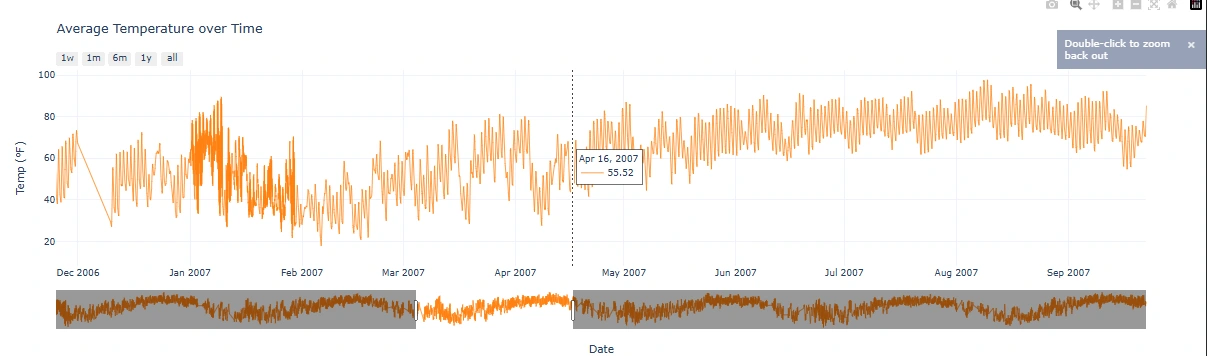
Strong yearly seasonality — load and temperature both rise in summer and winter relative to spring/autumn
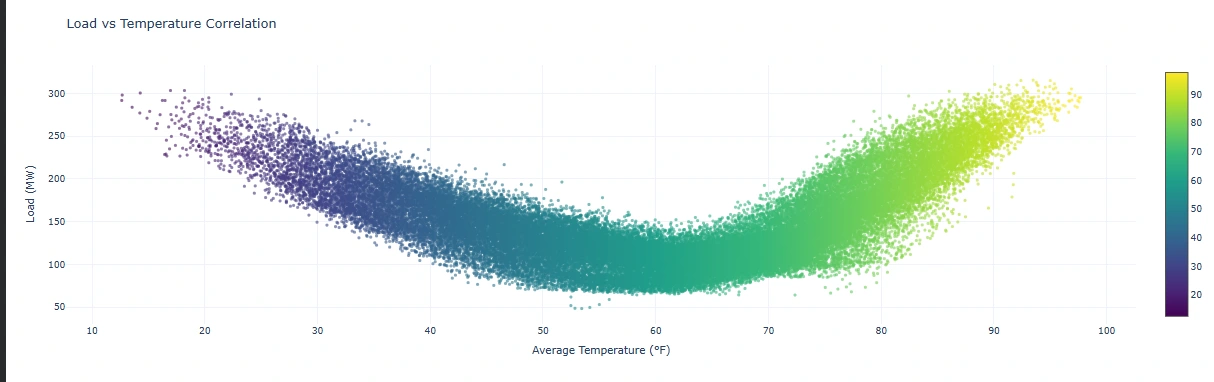
Non-linear load-temperature relationship — the correlation plot shows a U-shape, not a straight line: demand rises in both very cold and very hot conditions (heating and cooling load), which rules out a simple linear model from the start
Screenshot of: load over time, temperature over time, load vs. temperature correlation
Stationarity Testing
Before choosing a model family, the series was tested rather than assumed:
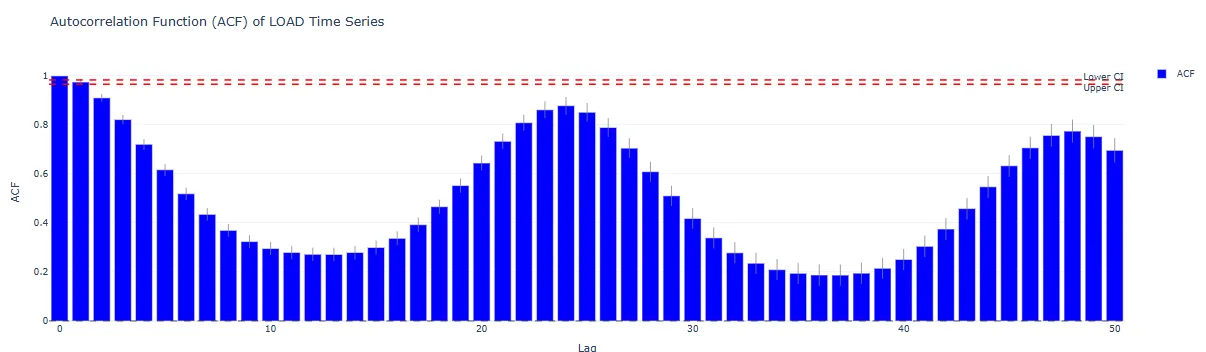
ADF Test: statistic = -11.67, p-value ≈ 1.83e-21 → well below 0.05, so the null hypothesis of a unit root is rejected. The LOAD series is stationary, meaning no differencing is needed (ARIMA
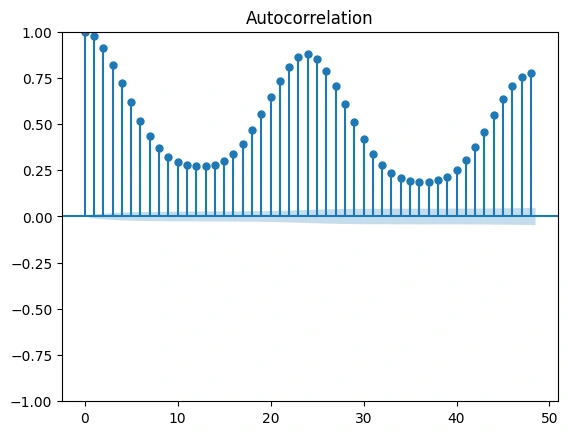
d = 0).ACF Plot: correlations decay quickly with lag, confirming stationarity, with clear repeating spikes at lag 24 and its multiples — a direct statistical signature of daily seasonality.
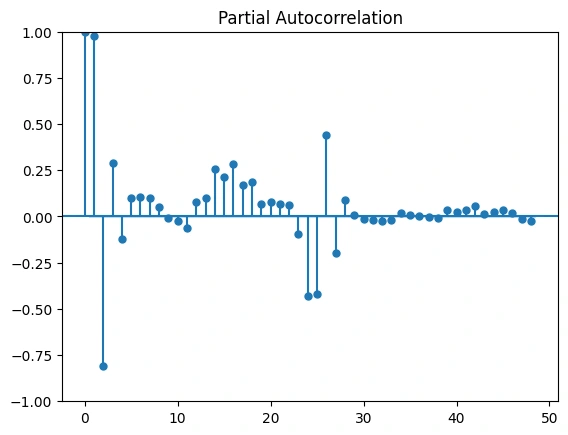
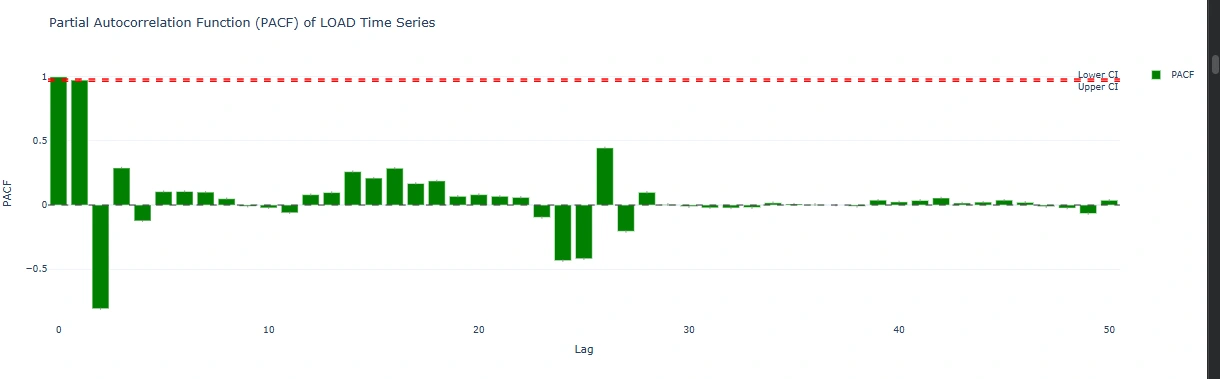
PACF Plot: significant correlations cut off sharply after the first few lags (with a spike at lag 24), which both confirms stationarity and gives a concrete, data-driven starting point for AR/MA order selection rather than guesswork.
Forecasting Models Benchmarked
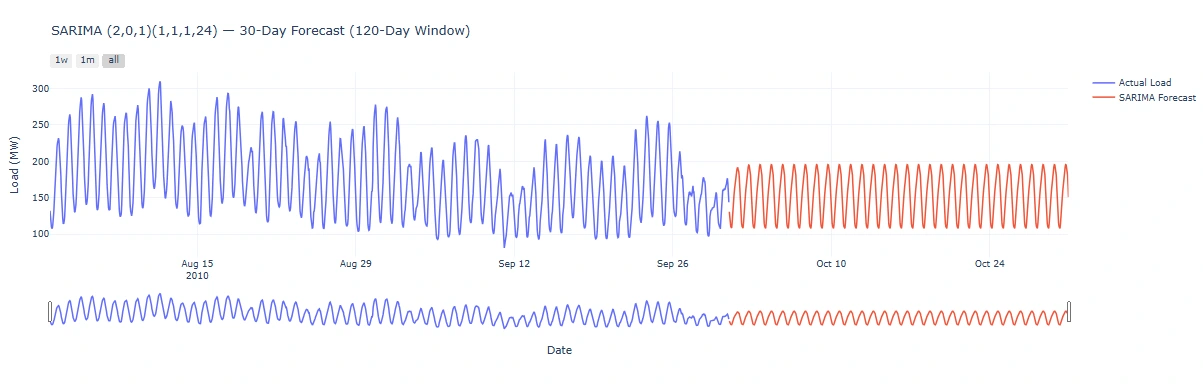
Thirteen models were implemented and evaluated on a 30-day (720-hour) forecast horizon, spanning increasing levels of complexity:
Baselines: Naïve I, Naïve S (Seasonal), Naïve 2 (Trend)
Classical smoothing: SES, Holt's Linear Trend, Damped Trend, Theta, Combination (ensemble average)
Statistical seasonal models: ETS / Holt-Winters, ARIMA, SARIMA, Fourier Regression
Advanced multi-seasonal models: Prophet, TBATS
Model Evaluation & Results
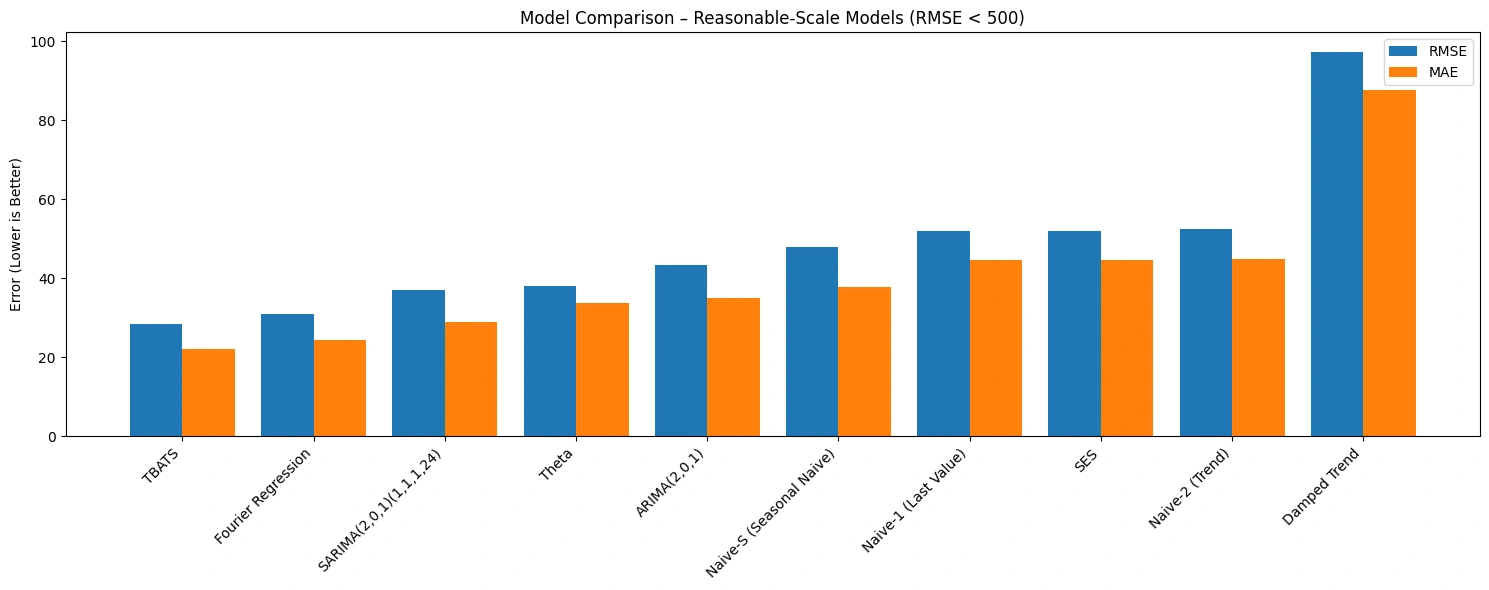
Models were compared on RMSE and MAE over the 30-day horizon, plotted on a log scale since error magnitudes varied by orders of magnitude across simpler vs. advanced models.
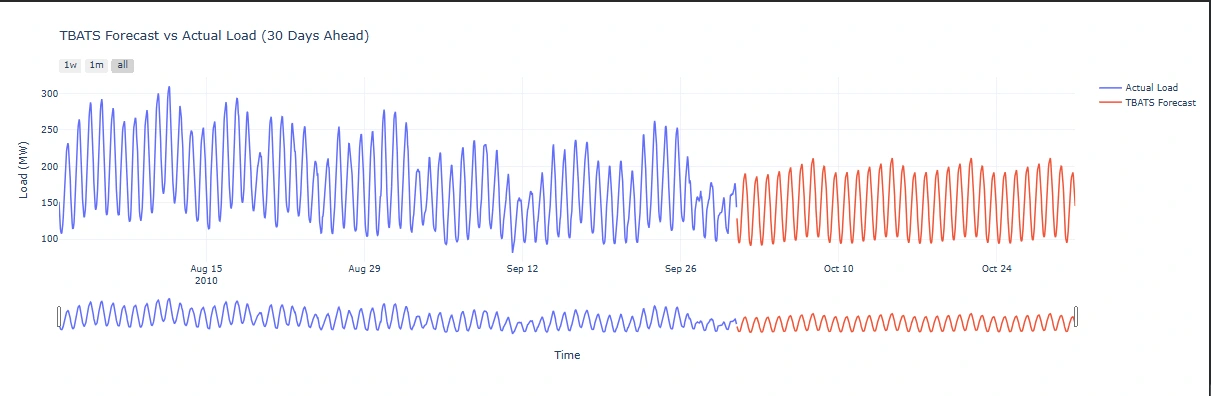
TBATS achieved the lowest RMSE and MAE of all 13 models. This isn't a coincidental result — TBATS is purpose-built to handle exactly the conditions this dataset presents: multiple overlapping seasonalities (daily and weekly), complex cyclical structure, and nonlinear patterns that single-seasonality models like SARIMA or ETS can't fully capture. Fourier Regression ranked second, which makes sense since it also explicitly models multiple periodicities through harmonic terms. SARIMA still performed competitively, which is a useful finding in its own right — it shows classical seasonal ARIMA remains a solid, interpretable choice for structured load data even when it isn't the top performer.
Screenshot of: model comparison bar chart (RMSE/MAE, log scale)
From Forecast to Decision — The Blackout Risk Dashboard
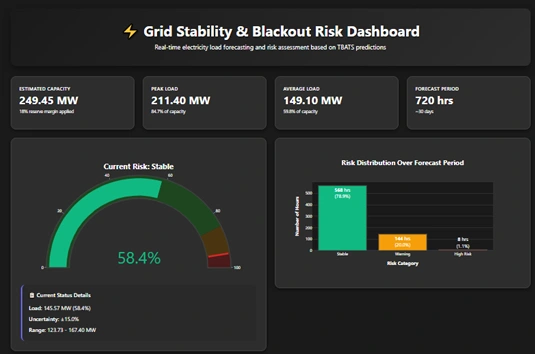
A forecast is only useful if it drives a decision. The TBATS forecast was integrated with capacity thresholds to build a Grid Stability & Blackout Risk Dashboard, translating raw MW predictions into an operational risk view:
Estimated Capacity: 249.45 MW, derived from historical peak demand plus an 18% reserve margin
Peak Load vs. Capacity: 211.40 MW (84.7% of capacity)
Average Load vs. Capacity: 149.10 MW (59.8% of capacity)
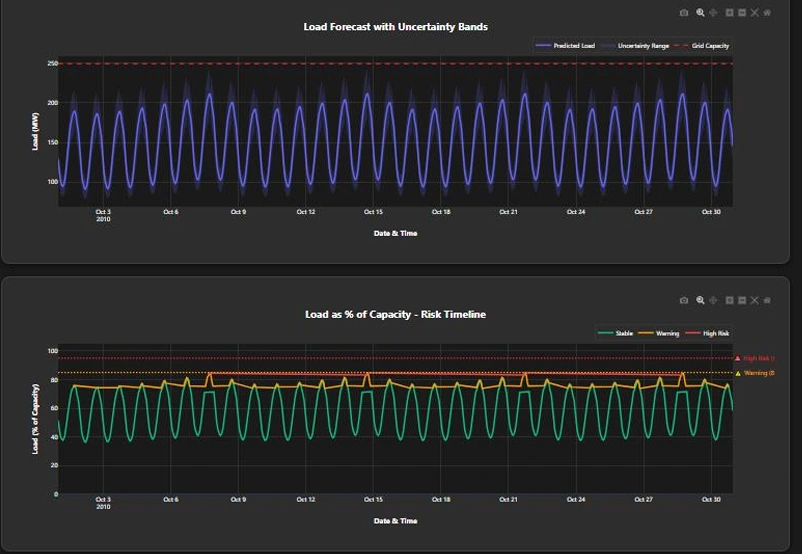
±15% Uncertainty Bands around the forecast, acknowledging that no forecast is exact and giving planners a realistic range rather than a false sense of precision
3-tier Risk Classification — Stable (green), Warning (yellow), High Risk (red) — based on the load-to-capacity ratio for each forecasted hour
Hourly demand profile — showing lower off-peak demand and higher daytime/evening peaks, useful for planning maintenance windows or demand-response programs
Key Findings
The LOAD series is statistically stationary (ADF p ≈ 1.83e-21) — no differencing required for ARIMA-family models
Daily (24-hour) and yearly seasonality are both statistically confirmed, not just visually apparent
Load responds non-linearly to temperature — both heating and cooling demand drive load up
TBATS outperforms all 13 benchmarked models by explicitly modeling multiple seasonalities simultaneously — a meaningful result given how common multi-seasonal patterns are in real power system data
A 249.45 MW capacity estimate with an 18% reserve margin provides a practical, defensible safety buffer for operational planning
Conclusion & Future Work
This project shows that model choice should follow evidence, not convention — the stationarity tests and seasonality analysis directly informed which models were worth trying, and the results confirmed that multi-seasonal models meaningfully outperform single-seasonality approaches on real load data. Beyond forecasting accuracy, the project's dashboard turns raw predictions into a decision-support tool a grid operator could actually use.
Future extensions include real-time data integration, multi-zone grid analysis, fully probabilistic forecasting, and incorporating renewable energy variability into the capacity model.
References
GEFCom2014 Dataset: Dropbox link
Hong, T. et al. (2016), Probabilistic energy forecasting: Global Energy Forecasting Competition 2014 and beyond — paper link
Like this project
Posted Sep 19, 2026
Developed a load forecasting pipeline using GEFCom2014 dataset, implementing various forecasting models and building a risk dashboard.
Likes
0
Views
2