Some snippets of the Data
Mahnoor Khan
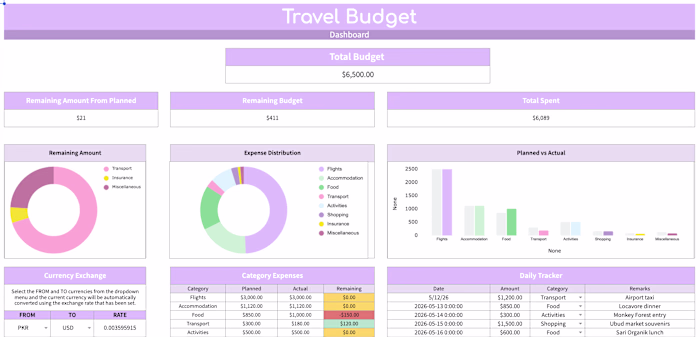
Some snippets of the Data Visualisation I did for a brand's Financial Analysis on Microsoft Excel- they valued the revenue and sales quantity most, which explains the limited, yet precise insights. It shows climbing and retained trends which the owner would then use for his new order quantity for best and poor performing products.
Like this project
Posted Jun 22, 2026
Some snippets of the Data Visualisation I did for a brand's Financial Analysis on Microsoft Excel- they valued the revenue and sales quantity most, which exp...
Likes
0
Views
0
Timeline
Jun 19, 2026 - Jun 21, 2026