Data Analysis & Visualization with

Muhammad Zeeshan


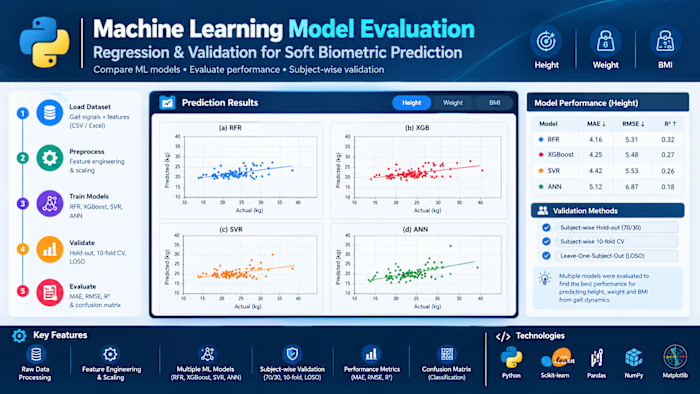
Data Analysis & Visualization with Python: Developed a Python-based data analysis workflow to transform raw datasets into meaningful insights through data cleaning, exploratory data analysis (EDA), statistical analysis, and visualization.
The workflow uses Python's data science libraries to organize datasets, identify patterns and trends, examine relationships between variables, and present findings through clear, informative charts and graphs. The goal is to make complex data easier to understand and support data-driven decision-making.
Key Features:
Data Cleaning & Preprocessing: Handle missing values, inconsistent entries, and data quality issues.
Exploratory Data Analysis: Investigate distributions, patterns, trends, and relationships within datasets.
Statistical Analysis: Calculate descriptive statistics and analyze correlations between variables.
Data Visualization: Create informative charts, graphs, and plots to communicate analytical findings.
Insight Generation: Summarize key observations in a clear and understandable format.
Reproducible Workflow: Use Python scripts and notebooks for transparent, repeatable analysis.
Technologies Used: Python · Pandas · NumPy · Matplotlib · Seaborn · SciPy
Like this project
Posted Oct 16, 2026
Data Analysis & Visualization with Python: Developed a Python-based data analysis workflow to transform raw datasets into meaningful insights through data cl...