


Additional resources
What Are Infographic DesignersVisual Communication SpecialistsData Visualization ExpertsBrand Storytelling ProfessionalsSkills to Look for When You Hire an Infographic DesignerAdobe Illustrator MasteryData Simplification AbilitiesTypography and Color Theory KnowledgeCross-Platform Design ExperienceAccessibility Compliance UnderstandingTypes of Infographic Design ServicesStatistical InfographicsTimeline and Process InfographicsComparison and Contrast InfographicsGeographic and Map InfographicsInteractive and Animated InfographicsWhere to Find Infographic DesignersSpecialized Design CommunitiesProfessional Networks and ReferralsDesign School Job BoardsRemote Work PlatformsHow to Evaluate Infographic Designer PortfoliosData Complexity ExamplesBrand Consistency DemonstrationsMobile Responsiveness SamplesIndustry-Specific ProjectsRevision and Iteration HistoryCost Structure for Infographic Design ServicesHourly Rate Ranges by Experience LevelProject-Based Pricing ModelsRetainer Agreements for Ongoing WorkRush Project Premium RatesSteps to Hire an Infographic DesignerStep 1: Define Your Project ScopeStep 2: Create a Detailed Design BriefStep 3: Set Budget ParametersStep 4: Screen Portfolio SubmissionsStep 5: Conduct Skills AssessmentsStep 6: Negotiate Terms and TimelinesRed Flags When Hiring Freelance Infographic DesignersLimited Data Visualization ExamplesPoor Communication Response TimesUnclear Revision PoliciesMissing File Format DeliverablesLack of Industry ExperienceHow to Write an Effective Infographic Design BriefTarget Audience SpecificationsKey Message HierarchyBrand Guidelines and AssetsTechnical Requirements and FormatsContent Sources and Data PointsManaging Your Infographic Design ProjectSetting Milestone CheckpointsProviding Constructive FeedbackVersion Control SystemsQuality Assurance ChecklistsCommon Mistakes to Avoid When You Hire Infographic DesignersPrioritizing Price Over QualitySkipping Reference ChecksUnclear Ownership RightsInsufficient Project TimelineVague Performance MetricsFuture Trends in Infographic Design ServicesAI-Assisted Design ToolsAR and VR IntegrationMicro-Content OptimizationReal-Time Data VisualizationVoice-Activated Infographics
Finding the right talent to transform complex data into compelling visual stories can make or break your content strategy. The demand for skilled professionals who can bridge the gap between raw information and audience engagement continues to grow across industries.
What Are Infographic Designers
Visual Communication Specialists
Infographic designers serve as translators between complex data and accessible visual narratives. These professionals specialize in converting dense information into digestible formats that audiences can quickly understand and remember. Their primary role involves creating visual hierarchies that guide viewers through information in a logical sequence.
Visual communication specialists work with various content types, from statistical reports to educational materials. They understand how different visual elements affect comprehension and retention. A skilled designer knows when to use charts versus icons, how to balance text with imagery, and which color schemes enhance readability across different demographics.
These specialists often collaborate with subject matter experts to ensure accuracy while maintaining visual appeal. They consider factors like cultural context, accessibility requirements, and platform-specific constraints when developing their designs.
Data Visualization Experts
Data visualization expertise distinguishes exceptional infographic designers from general graphic designers. These professionals possess deep knowledge of statistical representation methods and understand which chart types best convey specific data relationships. They can identify patterns in raw datasets and translate them into meaningful visual stories.
Data visualization experts work with various information types, including quantitative research, survey results, financial reports, and scientific studies. They understand the principles behind effective chart design, including proper scaling, appropriate color coding, and clear labeling systems.
These experts also stay current with emerging visualization techniques and tools. They can recommend the most effective approach for different data types, whether through traditional bar charts, innovative flow diagrams, or interactive elements that allow users to explore information layers.
Brand Storytelling Professionals
Brand storytelling professionals within the infographic design field focus on maintaining consistent visual identity while conveying information. They understand how to incorporate brand elements like color palettes, typography, and imagery styles without compromising data clarity or visual hierarchy.
These professionals excel at creating emotional connections between audiences and information. They use narrative techniques to structure data presentation, creating beginning-middle-end flows that keep viewers engaged throughout the entire infographic.
Brand storytelling specialists also consider how infographics fit within broader marketing strategies. They design with shareability in mind, creating visuals that work across multiple platforms while maintaining brand recognition and message consistency.
Skills to Look for When You Hire an Infographic Designer
Adobe Illustrator Mastery
Adobe Illustrator proficiency represents the foundation of professional infographic design services. This vector-based software allows designers to create scalable graphics that maintain quality across different sizes and formats. Designers should demonstrate advanced knowledge of Illustrator's data visualization tools, including graph creation, symbol libraries, and custom brush development.
Look for candidates who understand layer organization, color management, and file optimization techniques. They should be able to create master templates that ensure consistency across multiple infographics while allowing for customization based on specific content needs.
Advanced Illustrator users also know how to prepare files for different output requirements, whether for web display, print production, or interactive applications. This technical knowledge prevents costly revisions and ensures deliverables meet your specific format requirements.
Data Simplification Abilities
Effective data simplification requires both analytical thinking and design intuition. Designers must identify the most important information within complex datasets and determine the best visual approach for highlighting key insights. This skill involves understanding statistical concepts and recognizing potential misrepresentations in data presentation.
Strong candidates can explain their decision-making process when simplifying information. They should demonstrate how they maintain data accuracy while removing unnecessary complexity. Look for examples where they transformed technical reports or research findings into accessible formats without losing essential details.
Data simplification also involves understanding audience needs and knowledge levels. Designers should show how they adapt their approach based on whether they're creating content for industry experts or general consumers.
Typography and Color Theory Knowledge
Typography expertise goes beyond font selection to include understanding how text hierarchy affects information processing. Skilled designers know how to balance headline sizes, body text, and supporting information to create clear reading paths. They understand spacing principles and how different typefaces convey different emotional tones.
Color theory knowledge encompasses both aesthetic and functional considerations. Designers should understand how color combinations affect accessibility, particularly for viewers with color vision deficiencies. They need to know which colors work best for different data types and how cultural associations might influence color interpretation.
Look for candidates who can explain their typography and color choices in terms of functionality rather than just aesthetics. They should demonstrate awareness of brand guidelines while showing flexibility in adapting color schemes for optimal data presentation.
Cross-Platform Design Experience
Modern infographic creation requires understanding how designs perform across different platforms and devices. Designers need experience creating responsive layouts that work equally well on desktop computers, tablets, and mobile phones. This includes knowledge of aspect ratio considerations and text scaling requirements.
Cross-platform experience also involves understanding platform-specific best practices. Social media infographics require different approaches than those designed for email newsletters or website embedding. Designers should show familiarity with platform guidelines and technical specifications.
Look for portfolios that demonstrate versatility in format creation. Candidates should show examples of how they adapt the same information for different platforms while maintaining visual consistency and message clarity.
Accessibility Compliance Understanding
Accessibility compliance ensures infographics reach the widest possible audience, including users with visual, cognitive, or motor impairments. Designers should understand color contrast requirements, alternative text creation, and screen reader compatibility considerations.
Knowledge of accessibility guidelines extends to typography choices, including font size minimums and reading level considerations. Designers should demonstrate awareness of how different visual elements affect users with various accessibility needs.
Look for candidates who can discuss accessibility as an integral part of their design process rather than an afterthought. They should show examples of how they've incorporated accessibility features without compromising visual appeal or information clarity.
Types of Infographic Design Services
Statistical Infographics
Statistical infographics transform numerical data into visually compelling narratives that highlight trends, comparisons, and key findings. These designs typically feature various chart types, including bar graphs, pie charts, line graphs, and scatter plots, arranged in logical sequences that guide viewers through data insights.
Effective statistical infographics balance detailed information with visual simplicity. Designers use color coding, icons, and typography to create clear distinctions between different data categories while maintaining overall visual cohesion. They often incorporate callout boxes or highlighted statistics to emphasize the most important findings.
These infographics serve multiple industries, from market research presentations to annual reports and academic publications. The key lies in selecting appropriate visualization methods that accurately represent data relationships without overwhelming viewers with excessive detail.
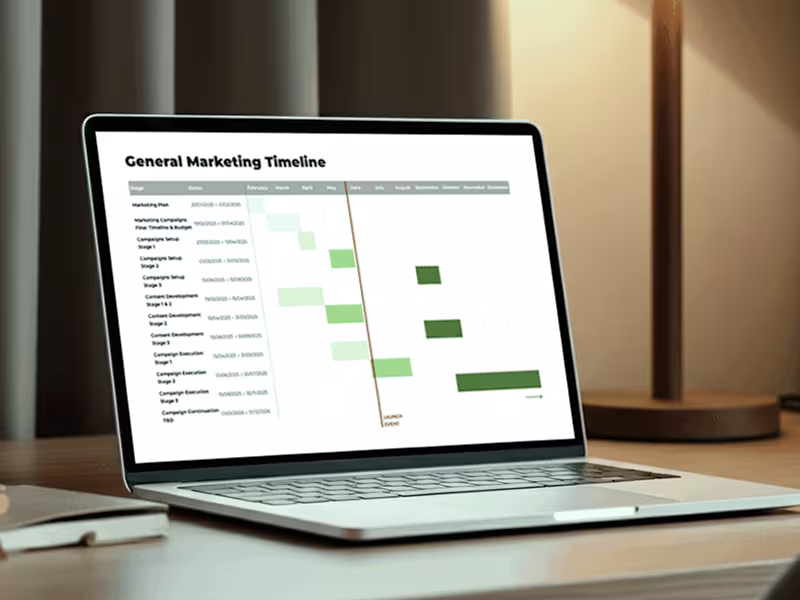
Timeline and Process Infographics
Timeline and process infographics excel at showing progression, whether chronological events, step-by-step procedures, or developmental stages. These designs use visual flow elements like arrows, connecting lines, and sequential numbering to guide viewers through information in a logical order.
Process infographics often incorporate icons, illustrations, and color coding to distinguish different phases or categories within the overall flow. Designers balance horizontal and vertical layouts based on content length and intended display format.
These infographics prove particularly valuable for training materials, project planning, historical overviews, and instructional content. They help audiences understand complex procedures by breaking them into manageable, sequential components.
Comparison and Contrast Infographics
Comparison infographics highlight differences and similarities between products, services, concepts, or data sets. These designs typically use side-by-side layouts, versus formats, or matrix structures to facilitate easy comparison across multiple criteria.
Effective comparison designs maintain visual balance while clearly distinguishing between compared elements. Designers use consistent formatting, color schemes, and iconography to ensure fair representation while highlighting key differentiators.
These infographics support decision-making processes in business, education, and consumer contexts. They prove particularly valuable for product comparisons, competitive analyses, and educational content that explores multiple perspectives or options.
Geographic and Map Infographics
Geographic infographics combine location-based information with data visualization to show regional trends, demographic patterns, or geographic distributions. These designs range from simple location markers to complex choropleth maps that use color intensity to represent data values.
Map-based infographics require careful attention to geographic accuracy and appropriate projection methods. Designers must balance cartographic precision with visual clarity, often simplifying geographic boundaries to focus attention on data insights.
These infographics serve industries like tourism, real estate, market research, and public policy. They help audiences understand how information varies across different locations and identify geographic patterns that might not be apparent in traditional data presentations.
Interactive and Animated Infographics
Interactive and animated infographics engage audiences through clickable elements, hover effects, or motion graphics that reveal information progressively. These designs often incorporate multiple layers of information that users can explore based on their interests or needs.
Animation elements might include data transitions, progressive reveals, or motion that illustrates processes or changes over time. Interactive features can include clickable sections, dropdown menus, or slider controls that allow users to filter or customize displayed information.
These advanced infographics require additional technical skills and often involve collaboration with web developers or motion graphics specialists. They prove particularly effective for complex datasets, educational content, and digital marketing campaigns where engagement metrics are important.
Where to Find Infographic Designers
Specialized Design Communities
Specialized design communities offer access to professionals who focus specifically on information design and data visualization. These platforms typically feature curated portfolios and designer profiles that highlight relevant experience and specialization areas.
Design communities often include rating systems, client reviews, and detailed project galleries that help evaluate designer capabilities. Many platforms also offer project management tools and communication features that streamline the hiring and collaboration process.
These communities frequently host design challenges and showcase emerging trends, making them valuable resources for identifying innovative designers who stay current with industry developments. They also provide networking opportunities that can lead to long-term professional relationships.
Professional Networks and Referrals
Professional networks and referrals provide access to designers with proven track records and established reputations. Industry associations, design organizations, and professional meetups offer opportunities to connect with experienced practitioners who specialize in visual communication.
Referral networks often yield higher-quality matches because recommendations come from trusted sources who understand both the designer's capabilities and the client's needs. These connections frequently result in better communication and more successful project outcomes.
Professional networks also provide opportunities for ongoing relationships that can support multiple projects over time. Designers found through referrals often demonstrate higher levels of accountability and professional standards.
Design School Job Boards
Design school job boards connect clients with recent graduates and emerging professionals who bring fresh perspectives and current technical knowledge. These platforms often feature students and alumni from programs that specifically focus on information design or data visualization.
Recent graduates typically offer competitive rates while demonstrating proficiency with the latest design tools and techniques. They often show enthusiasm for challenging projects and willingness to adapt their approach based on client feedback.
Design school connections also provide access to faculty recommendations and academic project portfolios that demonstrate problem-solving abilities and creative thinking. These relationships can develop into long-term professional partnerships as designers gain experience.
Remote Work Platforms
Remote work platforms expand access to global talent pools while offering various collaboration tools and project management features. These platforms typically include time tracking, milestone management, and secure payment processing that simplify remote project coordination.
Remote platforms often feature detailed filtering options that allow clients to search based on specific skills, experience levels, budget ranges, and availability. Many platforms also offer dispute resolution services and quality guarantees that provide additional security for project investments.
The global nature of remote platforms provides access to diverse design perspectives and cultural insights that can enhance infographic effectiveness for international audiences. Time zone differences can also enable around-the-clock project progress when managed effectively.
How to Evaluate Infographic Designer Portfolios
Data Complexity Examples
Portfolio evaluation should prioritize examples that demonstrate the designer's ability to handle complex information without overwhelming viewers. Look for projects that successfully transform dense datasets, technical reports, or multi-layered information into clear, engaging visuals.
Strong portfolios show progression from raw data to finished infographics, illustrating the designer's thought process and decision-making approach. Pay attention to how designers balance detail with simplicity and whether they maintain accuracy while improving accessibility.
Evaluate whether portfolio examples address diverse data types and complexity levels. Designers who can handle both simple statistics and complex research findings demonstrate versatility that proves valuable across different project types.
Brand Consistency Demonstrations
Brand consistency examples reveal how designers adapt their approach while maintaining client identity standards. Look for portfolio sections that show multiple projects for the same client or examples where designers worked within established brand guidelines.
Strong brand consistency demonstrations show how designers incorporate color palettes, typography, and imagery styles without compromising information clarity. They should demonstrate flexibility in applying brand elements across different infographic types and formats.
Evaluate whether designers can explain their brand adaptation choices and how they balance creative expression with client requirements. This insight reveals their understanding of brand strategy and their ability to work within established parameters.
Mobile Responsiveness Samples
Mobile responsiveness samples demonstrate how designs adapt to smaller screens and touch interfaces. Look for examples that show the same information presented effectively across desktop and mobile formats, maintaining readability and functionality.
Strong mobile examples show thoughtful consideration of text sizing, button placement, and navigation elements that work well with touch interactions. Designers should demonstrate understanding of mobile-specific constraints and opportunities.
Evaluate whether mobile adaptations maintain the same visual impact and information hierarchy as desktop versions. Successful mobile designs often require creative solutions that preserve essential information while accommodating platform limitations.
Industry-Specific Projects
Industry-specific portfolio examples reveal designers' ability to understand and communicate within specialized contexts. Look for projects that demonstrate familiarity with industry terminology, audience expectations, and regulatory requirements when applicable.
Strong industry examples show how designers research and adapt their approach for different professional contexts. They should demonstrate ability to work with subject matter experts and translate technical concepts for various audience levels.
Evaluate the breadth of industry experience represented in portfolios. Designers with diverse industry exposure often bring valuable cross-pollination of ideas and approaches that can enhance project outcomes.
Revision and Iteration History
Revision and iteration examples provide insight into designers' collaborative processes and their ability to incorporate feedback effectively. Look for case studies that show project evolution from initial concepts through final deliverables.
Strong revision examples demonstrate how designers respond to client feedback while maintaining design integrity and project goals. They should show ability to explain design decisions and offer alternative solutions when requested changes might compromise effectiveness.
Evaluate whether designers present revision processes as collaborative opportunities rather than obstacles. This perspective indicates professional maturity and client service orientation that contributes to successful project outcomes.
Cost Structure for Infographic Design Services
Hourly Rate Ranges by Experience Level
Hourly rates for infographic designers vary significantly based on experience, location, and specialization. Entry-level designers typically charge between $25-$45 per hour, while mid-level professionals with 3-5 years of experience command $45-$85 per hour. Senior designers and specialists often charge $85-$150 per hour or more.
Geographic location influences rate structures considerably. Designers in major metropolitan areas typically charge premium rates, while those in smaller markets or international locations may offer more competitive pricing. Remote work arrangements have somewhat leveled these geographic disparities.
Specialization also affects hourly rates. Designers with expertise in specific industries, advanced technical skills, or proven track records with complex projects often command higher rates than generalists. The ability to handle rush projects or provide additional services like data analysis can also justify premium pricing.
Project-Based Pricing Models
Project-based pricing offers predictability for both clients and designers while allowing for scope-specific adjustments. Simple infographics typically range from $500-$1,500, while complex projects involving multiple data sources or interactive elements can cost $2,000-$5,000 or more.
Project pricing factors include information complexity, design sophistication, revision rounds, timeline requirements, and deliverable formats. Designers often provide tiered pricing options that allow clients to select service levels based on their budget and requirements.
Many designers offer package deals for multiple infographics or ongoing projects. These arrangements often provide cost savings while ensuring consistency across related materials. Package pricing also simplifies budgeting for clients with regular infographic needs.
Retainer Agreements for Ongoing Work
Retainer agreements provide cost predictability and priority access to designer services. Monthly retainers typically range from $2,000-$8,000 depending on included services and guaranteed availability. These arrangements work well for organizations with regular infographic needs.
Retainer structures often include specific deliverable quantities, revision allowances, and response time guarantees. They may also provide discounted rates for additional work beyond the retainer scope. Clear agreement terms prevent misunderstandings about included services and additional charges.
Successful retainer relationships require good communication and realistic expectation setting. Both parties benefit when agreements include performance metrics and regular review periods to ensure continued value and satisfaction.
Rush Project Premium Rates
Rush projects typically incur premium charges of 25-100% above standard rates, depending on timeline compression and resource requirements. These premiums compensate designers for schedule disruptions and potential overtime work required to meet accelerated deadlines.
Rush pricing varies based on the degree of timeline compression and project complexity. Simple projects with modest deadline acceleration may incur minimal premiums, while complex projects requiring immediate turnaround often justify significant rate increases.
Clear rush project policies help manage client expectations and ensure fair compensation for expedited work. Many designers establish specific criteria for rush classification and communicate premium structures upfront to avoid pricing disputes.
Steps to Hire an Infographic Designer
Step 1: Define Your Project Scope
Project scope definition establishes the foundation for successful designer selection and project execution. Begin by identifying the specific information you need to communicate, your target audience, and the desired outcomes from your infographic investment.
Document the data sources, key messages, and any existing brand guidelines that will influence design decisions. Consider how the infographic will be used, including distribution channels, format requirements, and any technical constraints that might affect design choices.
Establish realistic timeline expectations based on project complexity and your internal review processes. Factor in time for data preparation, design iterations, and any approvals required before final delivery.
Step 2: Create a Detailed Design Brief
A comprehensive design brief communicates your vision while providing designers with the information they need to develop accurate proposals. Include background information about your organization, project goals, target audience characteristics, and preferred design styles or approaches.
Provide examples of infographics you admire and explain what appeals to you about them. Include any infographics you dislike and explain your concerns. This guidance helps designers understand your aesthetic preferences and avoid approaches that don't align with your vision.
Specify technical requirements including dimensions, file formats, color restrictions, and any accessibility considerations. Clear technical specifications prevent misunderstandings and ensure deliverables meet your needs.
Step 3: Set Budget Parameters
Budget parameters guide designer selection and help establish realistic project expectations. Research typical costs for projects similar to yours and establish a range that reflects your priorities and constraints.
Consider whether you prefer hourly or project-based pricing and factor in potential additional costs for revisions, rush delivery, or format variations. Communicate your budget range to potential designers to ensure proposals align with your financial parameters.
Be prepared to adjust your scope or timeline if initial proposals exceed your budget. Many designers can suggest alternative approaches that achieve your goals within available resources.
Step 4: Screen Portfolio Submissions
Portfolio screening focuses on identifying designers whose experience and style align with your project requirements. Look for relevant industry experience, appropriate complexity levels, and design approaches that resonate with your vision.
Pay attention to the variety and quality of portfolio examples rather than just quantity. Strong portfolios demonstrate consistent quality across different project types and show evolution in skills and approach over time.
Consider how well portfolio examples communicate information and whether they achieve clear hierarchy and visual appeal. The best infographics balance aesthetic appeal with functional effectiveness.
Step 5: Conduct Skills Assessments
Skills assessments verify that candidates possess the technical and creative abilities required for your project. Consider requesting small test projects or detailed discussions about their approach to specific challenges your project presents.
Evaluate communication skills and collaborative approach during the assessment process. Strong designers can explain their decision-making process and demonstrate flexibility in adapting their approach based on feedback.
Assess whether candidates ask thoughtful questions about your project and demonstrate understanding of your goals and constraints. These interactions provide insight into their professional approach and problem-solving abilities.
Step 6: Negotiate Terms and Timelines
Contract negotiations establish clear expectations and protect both parties' interests. Address payment terms, revision policies, ownership rights, and delivery schedules in detail to prevent future misunderstandings.
Discuss communication preferences and establish regular check-in schedules that allow for feedback and course corrections without disrupting workflow. Clear communication protocols improve project efficiency and outcomes.
Include provisions for scope changes and additional work requests. Well-defined change order processes allow for project flexibility while maintaining fair compensation for additional effort.
Red Flags When Hiring Freelance Infographic Designers
Limited Data Visualization Examples
Portfolios lacking substantial data visualization examples indicate potential limitations in handling complex information projects. Designers who primarily show decorative graphics or simple illustrations may struggle with statistical accuracy and appropriate chart selection for different data types.
Look for red flags like misused chart types, unclear data representations, or examples that prioritize aesthetics over information clarity. These issues suggest insufficient understanding of data visualization principles that could compromise project effectiveness.
Be cautious of designers who cannot explain their chart selection rationale or demonstrate awareness of common data visualization pitfalls. Strong candidates should understand when different visualization approaches are appropriate and why.
Poor Communication Response Times
Delayed or inconsistent communication responses often indicate potential project management challenges. Designers who take days to respond to initial inquiries may struggle with project deadlines and client communication throughout the engagement.
Pay attention to the quality and thoughtfulness of initial communications. Vague responses or failure to address specific project questions may indicate limited attention to detail or professional standards.
Consider how communication patterns might affect your project timeline and collaboration needs. Projects requiring frequent feedback and iteration benefit from designers who demonstrate responsive, professional communication habits.
Unclear Revision Policies
Vague or absent revision policies create potential for scope creep and budget overruns. Designers who don't clearly specify included revisions, additional charges, or change request processes may cause project complications and cost surprises.
Be wary of unlimited revision promises that seem too good to be true. Professional designers understand that unlimited revisions can compromise project profitability and timeline management.
Look for balanced revision policies that provide reasonable accommodation for feedback while maintaining clear boundaries. Well-structured policies protect both client interests and designer sustainability.
Missing File Format Deliverables
Incomplete deliverable specifications suggest potential post-project complications when you need files in different formats. Designers who don't clearly specify included file types may charge additional fees for format conversions or source file access.
Verify that proposed deliverables include editable source files and appropriate formats for your intended uses. This prevents future complications if you need to make updates or adapt the design for different applications.
Be cautious of designers who are reluctant to provide source files or who charge significant additional fees for file format variations. Professional arrangements typically include reasonable file format accommodation.
Lack of Industry Experience
Limited experience in your industry or with similar project types may indicate potential challenges with terminology, audience understanding, or regulatory requirements. While fresh perspectives can be valuable, some projects benefit from industry-specific knowledge.
Consider whether your project involves specialized concepts, technical terminology, or industry-specific design conventions that require familiarity. Complex or regulated industries often benefit from designers with relevant background knowledge.
Evaluate whether candidates demonstrate ability to research and learn industry-specific requirements quickly. Adaptable designers can often overcome limited industry experience through thorough preparation and collaboration.
How to Write an Effective Infographic Design Brief
Target Audience Specifications
Detailed audience specifications help designers make appropriate choices about complexity levels, visual styles, and communication approaches. Include demographic information, education levels, industry knowledge, and cultural considerations that might influence design decisions.
Describe how your audience typically consumes information and their familiarity with your subject matter. This context helps designers determine appropriate detail levels and explanation requirements for complex concepts.
Consider including information about where and how your audience will encounter the infographic. Different contexts require different design approaches, from social media sharing to presentation displays or printed materials.
Key Message Hierarchy
Clear message hierarchy guides designers in creating appropriate visual emphasis and information flow. Identify the most important insights you want audiences to remember and specify how supporting information should be prioritized.
Provide context about why certain information matters more than others and how different messages relate to your overall communication goals. This background helps designers make informed decisions about visual emphasis and layout structure.
Consider how message hierarchy might vary for different audience segments if your infographic serves multiple purposes. Some flexibility in emphasis can improve overall effectiveness.
Brand Guidelines and Assets
Comprehensive brand guidelines ensure design consistency with your existing materials and organizational identity. Provide color palettes, typography specifications, logo usage requirements, and any style preferences that should influence design decisions.
Include examples of existing materials that represent your preferred aesthetic approach and communication style. Visual references help designers understand your brand personality and appropriate design directions.
Specify any brand elements that are required versus preferred, and indicate areas where creative interpretation is welcome. Clear guidelines balance brand consistency with creative freedom.
Technical Requirements and Formats
Detailed technical specifications prevent delivery complications and ensure infographics meet your specific usage requirements. Include dimensions, resolution requirements, file formats, and any platform-specific constraints that affect design choices.
Specify color requirements including print versus web optimization, accessibility considerations, and any reproduction limitations. Technical constraints often influence design approaches and should be communicated upfront.
Consider future usage scenarios and specify file formats that support potential adaptations or updates. Planning for flexibility prevents future complications and additional costs.
Content Sources and Data Points
Clear content specifications help designers understand available information and any research or data preparation requirements. Provide access to source materials and indicate which information elements are required versus optional.
Specify data accuracy requirements and any verification processes that need to be followed. Some projects require fact-checking or approval from subject matter experts before design finalization.
Include information about content updates or revisions that might be needed after initial design completion. Planning for content changes helps establish appropriate revision policies and timeline expectations.
Managing Your Infographic Design Project
Setting Milestone Checkpoints
Strategic milestone checkpoints ensure project progress while providing opportunities for feedback and course corrections. Establish review points that align with natural project phases, such as concept development, initial design, and final refinement.
Structure milestones to allow adequate time for feedback incorporation without disrupting overall project timeline. Consider your internal review processes and availability when scheduling checkpoint meetings.
Use milestones to verify that project direction aligns with your goals before significant additional work is completed. Early course corrections are more efficient than major revisions near project completion.
Providing Constructive Feedback
Effective feedback focuses on specific elements and explains the reasoning behind requested changes. Avoid vague comments like "make it pop" in favor of specific guidance about color, layout, or information emphasis adjustments.
Frame feedback in terms of audience needs and project goals rather than personal preferences. This approach helps designers understand the rationale behind requests and often leads to better solutions.
Consolidate feedback from multiple stakeholders before communicating with designers. Conflicting or contradictory feedback can slow progress and create confusion about project direction.
Version Control Systems
Organized version control prevents confusion and ensures everyone works with current files. Establish clear naming conventions and file sharing protocols that make it easy to identify the most recent versions.
Use collaborative platforms that maintain revision history and allow for comment tracking. These tools help manage feedback and ensure that all suggestions are addressed appropriately.
Designate a single point of contact for design feedback to prevent conflicting instructions and maintain clear communication channels. This approach streamlines the revision process and improves efficiency.
Quality Assurance Checklists
Comprehensive quality assurance checklists ensure that final deliverables meet all project requirements and professional standards. Include verification items for accuracy, brand compliance, technical specifications, and accessibility considerations.
Review checklists should cover both content accuracy and design quality, including typography, color consistency, and file format verification. Systematic review processes prevent oversights that could require costly corrections.
Consider involving subject matter experts in quality assurance processes for projects involving technical or specialized information. Expert review can catch accuracy issues that might not be apparent to design-focused reviewers.
Common Mistakes to Avoid When You Hire Infographic Designers
Prioritizing Price Over Quality
Focusing primarily on cost often results in disappointing outcomes that require additional investment to correct. Low-priced options frequently lack the skills or experience necessary to handle complex projects effectively, leading to revisions, delays, and subpar results.
Quality infographic design requires significant expertise in both visual design and data communication. Designers who offer extremely low rates may lack this expertise or may need to rush through projects to maintain profitability.
Consider the total cost of ownership, including potential revision needs, timeline delays, and opportunity costs of ineffective communication. Investing in quality design often provides better long-term value than choosing the cheapest option.
Skipping Reference Checks
Reference checks provide valuable insights into designers' work quality, communication skills, and professional reliability. Previous clients can offer honest assessments of collaboration experiences and final deliverable quality.
Ask references specific questions about project management, responsiveness to feedback, adherence to deadlines, and overall satisfaction with results. These insights help predict potential collaboration challenges.
Be cautious of designers who are reluctant to provide references or whose references seem limited or outdated. Strong professionals typically maintain positive relationships with previous clients who are willing to provide recommendations.
Unclear Ownership Rights
Ambiguous ownership rights can create complications for future use, modifications, or licensing of your infographic. Establish clear agreements about intellectual property ownership, usage rights, and any restrictions on modification or redistribution.
Understand the difference between work-for-hire arrangements and licensing agreements, and choose the structure that best supports your intended usage. Some designers retain ownership while granting usage rights, which can limit your flexibility.
Address ownership of source files, fonts, and any third-party elements used in the design. Clear agreements prevent future complications if you need to make updates or adaptations.
Insufficient Project Timeline
Rushed timelines often compromise design quality and limit opportunities for feedback and refinement. Quality infographic design requires time for research, concept development, iteration, and polishing.
Factor in your internal review processes and any approvals required from stakeholders or subject matter experts. These steps often take longer than anticipated and should be included in timeline planning.
Consider seasonal workloads and designer availability when establishing project schedules. Popular designers may have limited availability during busy periods, requiring earlier project initiation.
Vague Performance Metrics
Unclear success criteria make it difficult to evaluate project outcomes and designer performance. Establish specific, measurable goals that align with your communication objectives and business needs.
Consider both quantitative metrics like engagement rates or download numbers and qualitative assessments like message clarity or brand alignment. Multiple evaluation criteria provide a comprehensive view of project success.
Communicate performance expectations upfront so designers understand how their work will be evaluated. This transparency helps ensure that design decisions support your success metrics.
Future Trends in Infographic Design Services
AI-Assisted Design Tools
Artificial intelligence tools are beginning to transform the infographic design process by automating routine tasks and suggesting design improvements. These tools can generate initial layouts, recommend color schemes, and even create basic visualizations from raw data inputs.
AI assistance allows designers to focus more time on creative problem-solving and strategic thinking rather than technical execution. However, human expertise remains essential for ensuring accuracy, brand alignment, and effective communication strategies.
The integration of AI tools is likely to change pricing structures and project timelines as routine tasks become more efficient. Designers who effectively leverage AI assistance may offer faster turnaround times and more competitive pricing for certain project types.
AR and VR Integration
Augmented and virtual reality technologies are creating new possibilities for immersive information design experiences. These technologies allow audiences to explore data in three-dimensional spaces and interact with information in ways that traditional flat designs cannot support.
AR integration enables infographics that overlay digital information onto real-world environments, creating contextual data experiences. VR applications allow for fully immersive data exploration that can be particularly effective for complex datasets or educational content.
While still emerging, AR and VR infographics require specialized technical skills and development resources. Early adopters in this space may command premium rates while the technology becomes more accessible.
Micro-Content Optimization
The trend toward shorter attention spans and mobile-first consumption is driving demand for micro-infographics that communicate key insights quickly and effectively. These condensed formats require exceptional skill in information prioritization and visual efficiency.
Micro-content optimization involves creating infographic series that can be consumed individually or as connected narratives. This approach supports social media sharing while allowing for more comprehensive information coverage across multiple pieces.
Designers specializing in micro-content creation need strong skills in visual hierarchy and message distillation. The ability to maintain impact while reducing complexity represents a valuable specialization area.
Real-Time Data Visualization
Dynamic infographics that update automatically with new data are becoming increasingly important for organizations that need to communicate changing information regularly. These systems require integration with data sources and technical infrastructure beyond traditional design skills.
Real-time visualization capabilities enable infographics that remain current without manual updates, reducing long-term maintenance costs while ensuring accuracy. However, they require more complex initial development and ongoing technical support.
Designers working with real-time systems need to understand data integration technologies and design for variable content scenarios. This specialization combines traditional design skills with technical development capabilities.
Voice-Activated Infographics
Voice interface integration is creating opportunities for audio-enhanced infographic experiences that support accessibility and hands-free information consumption. These systems can provide audio descriptions of visual elements or allow users to request specific information through voice commands.
Voice-activated features particularly benefit users with visual impairments and support multitasking scenarios where visual attention is limited. The technology also enables more personalized information delivery based on user requests.
Developing voice-enhanced infographics requires understanding of audio user experience design and integration with voice recognition technologies. This emerging field combines traditional visual design with audio interface expertise.