Freelancers using Looker Studio in IndiaFreelancers using Looker Studio in India
Excel & Data Analytics | Dashboards, KPI & Reporting
105
Followers
Excel & Data Analytics | Dashboards, KPI & Reporting
AI Solutions, Software Architect, AI Agents, Fractional CTO
14
Followers
AI Solutions, Software Architect, AI Agents, Fractional CTO
Cover image for I specialize in transforming complex
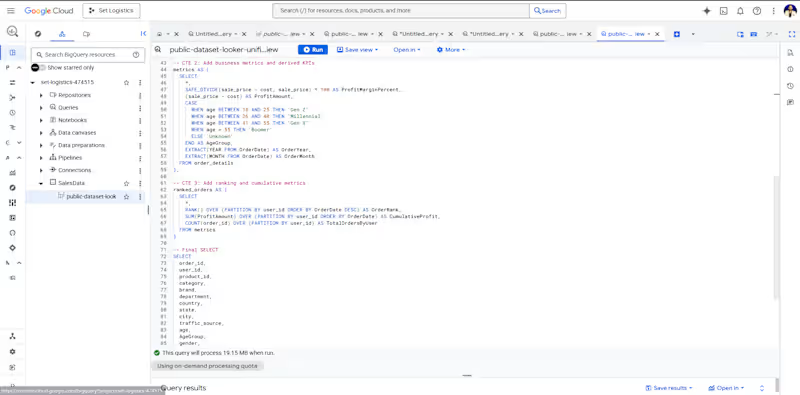
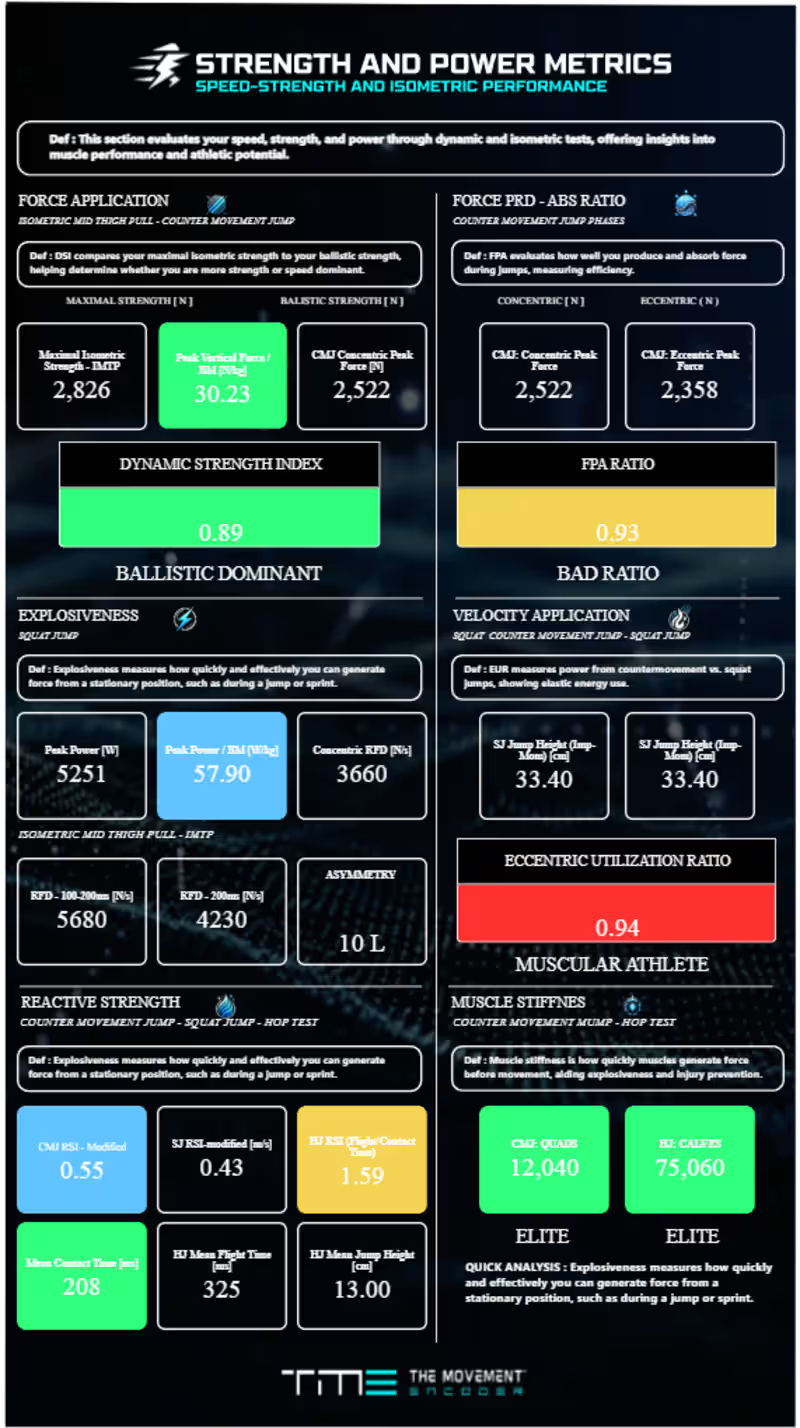
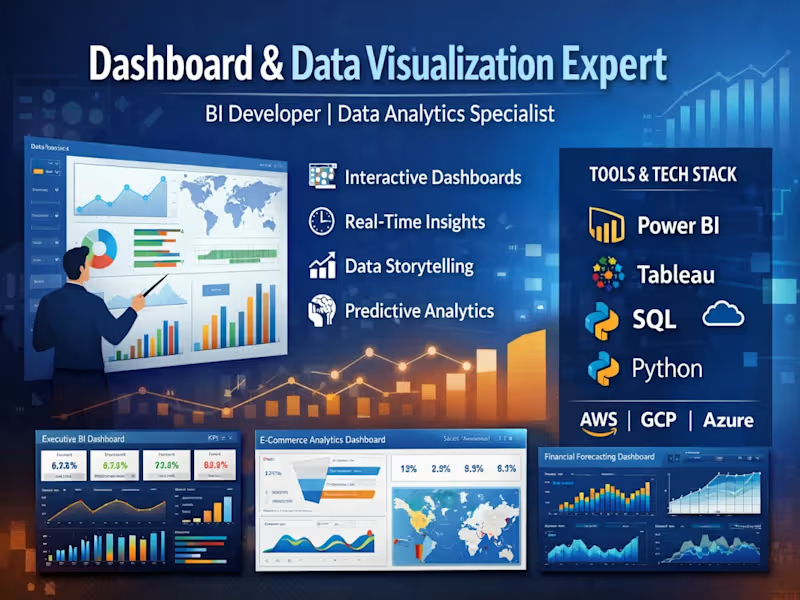
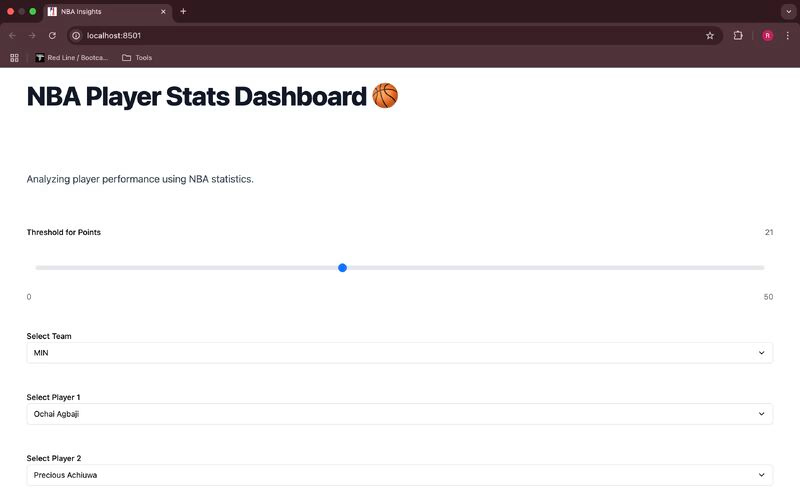
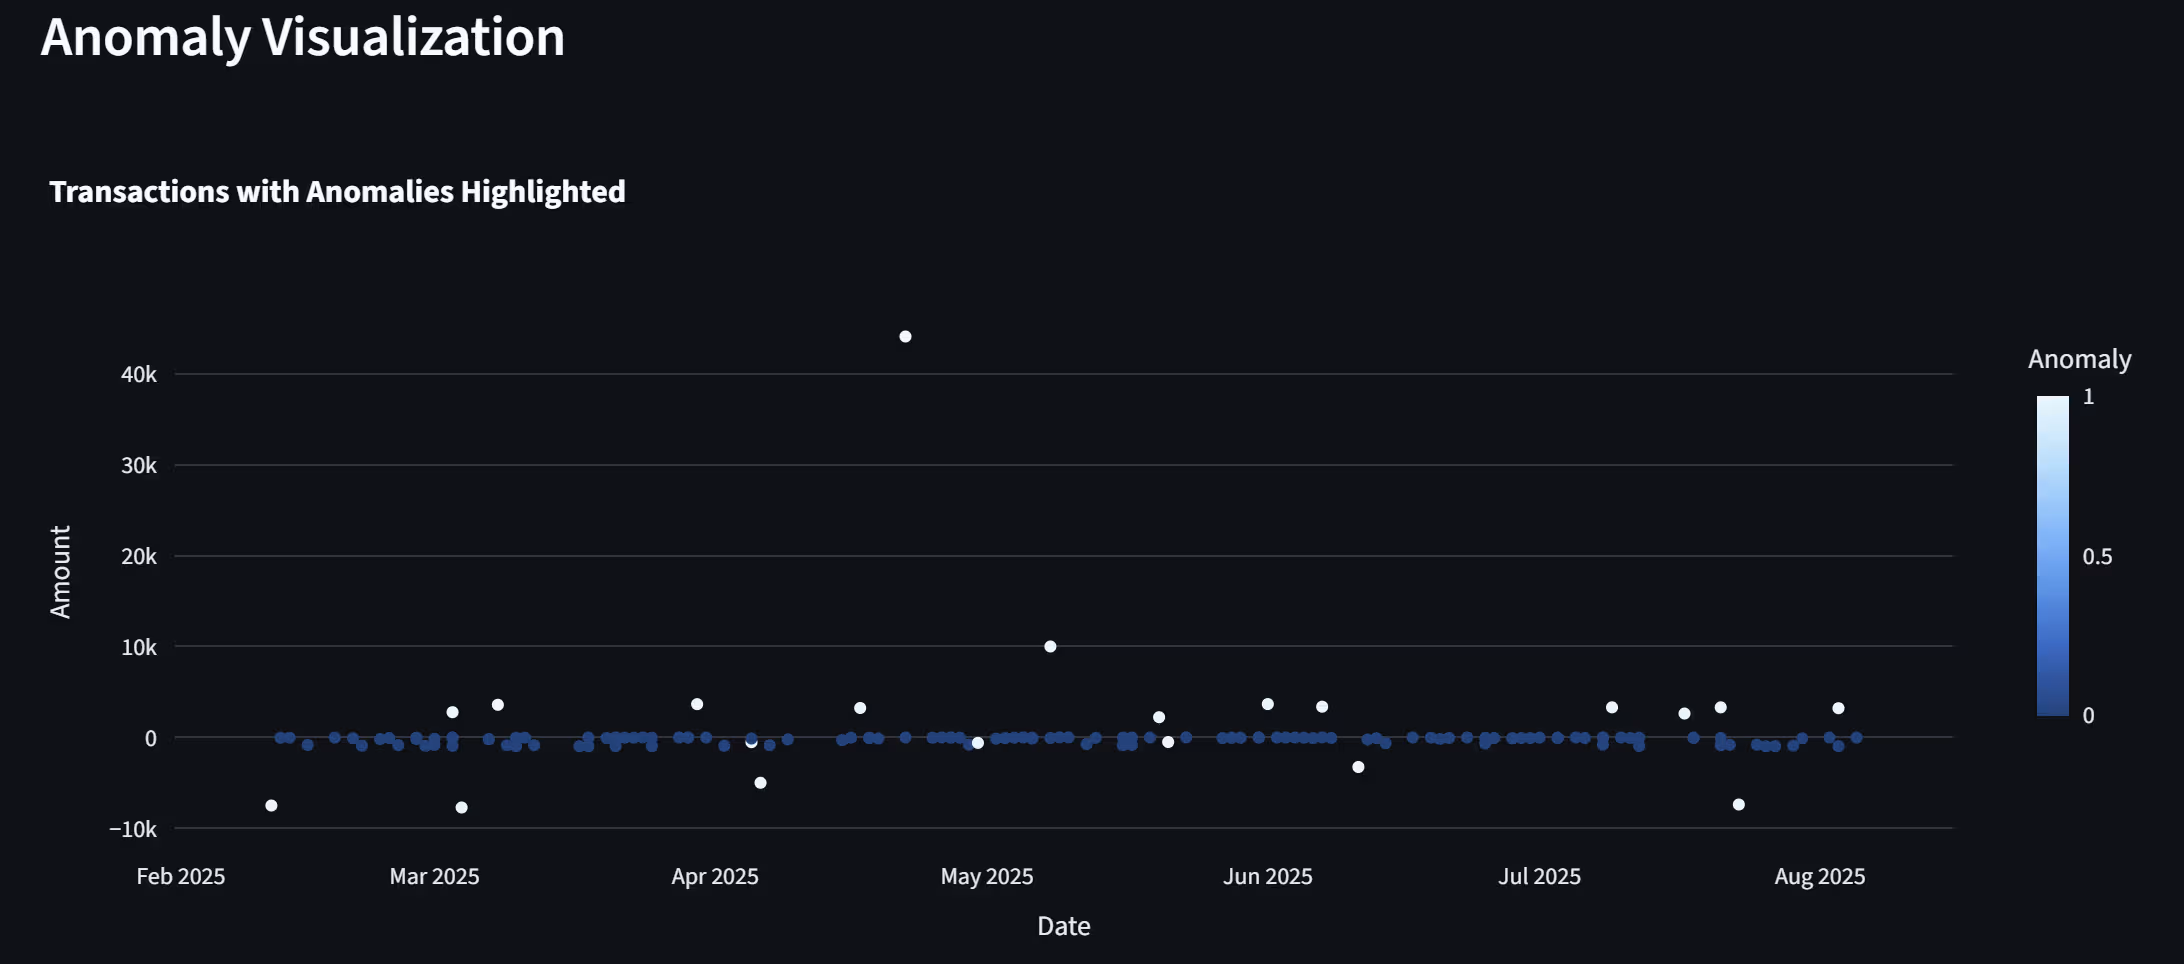
I specialize in transforming complex datasets into intuitive, visually compelling dashboards that drive strategic decision-making. With deep expertise in BI tools and data analytics, I design interactive, real-time reporting systems that help businesses uncover trends, monitor KPIs, and optimize performance. My approach combines data storytelling, clean UI/UX, and scalable architecture to deliver impactful insights. πŸ”Ή My Project Portfolio: πŸ“Š 1. Executive Business Intelligence Dashboard Built a dynamic KPI dashboard for C-level executives Integrated multiple data sources (CRM, ERP, marketing platforms) Delivered real-time insights on revenue, growth, and performance Tools: Power BI, SQL, Azure πŸ“ˆ 2. E-commerce Analytics Dashboard Designed a dashboard tracking sales, customer behavior, and conversion rates Implemented cohort analysis and funnel visualization Improved marketing ROI tracking by 40% Tools: Tableau, Python, Google Analytics πŸ“‰ 3. Financial Performance & Forecasting Dashboard Developed financial models and forecasting dashboards Visualized cash flow, P&L, and budget vs actuals Enabled data-driven financial planning Tools: Power BI, Excel, DAX πŸ“ 4. Operations & Supply Chain Dashboard Created logistics tracking and inventory monitoring system Real-time alerts for stock levels and delays Reduced operational inefficiencies Tools: Looker Studio, BigQuery πŸ“Š 5. AI-Powered Analytics Dashboard Integrated machine learning predictions into dashboards Automated anomaly detection and trend analysis Delivered predictive insights for decision-making Tools: Python, TensorFlow, Streamlit
1
2
208
Construction & MEP Finances Strategist Businesses.
6
Followers
Construction & MEP Finances Strategist Businesses.
Cover image for Are you actually watching your
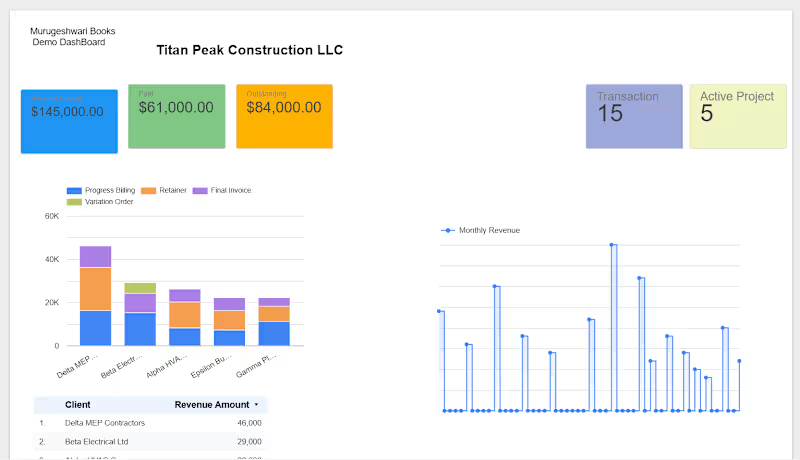
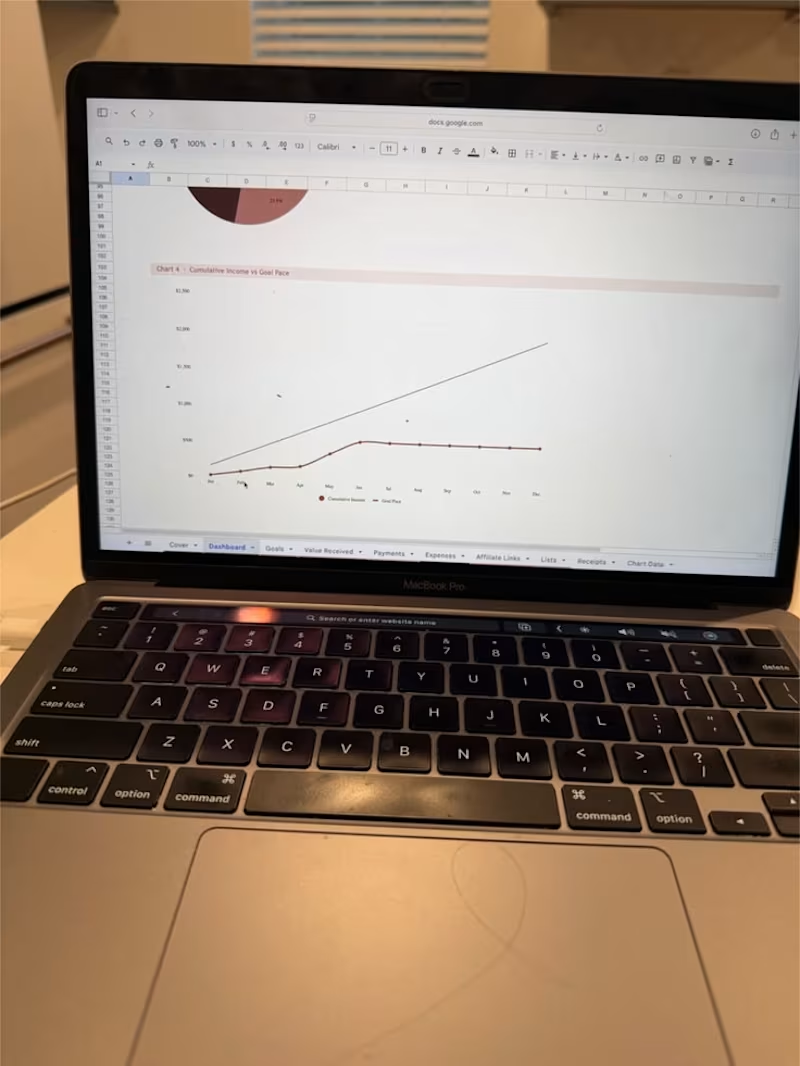
Are you actually watching your revenue trend or just hoping it is going up? Construction and MEP contractors look at revenue only at month end or year end. But the trend is where the real story is Are your billings growing month by month? Did revenue suddenly drop after a big project finished? Is your cash inflow stable, or spiky and risky? In my work with contractors, I don’t just show total revenue. I build Revenue Trend Dashboards in Looker Studio that show == Month-by-month revenue movement == Project-wise contribution to total revenue == Breakup of Retainers, Progress Billings, and Final Invoices When you can see your revenue trend clearly: You know when to push sales harder. You can plan cash flow instead of reacting. You spot dependency on 1–2 big clients early. Right now I’m building sample Revenue Trend dashboards from simple Google Sheets data and turning them into visual reports for construction businesses. If you’re a contractor or trade business (HVAC, Electrical, Plumbing, MEP) and want to see your revenue trend instead of just static totals, DM me #ConstructionAccounting (https://www.linkedin.com/search/results/all/?keywords=%23constructionaccounting&origin=HASH_TAG_FROM_FEED) #RevenueTrend (https://www.linkedin.com/search/results/all/?keywords=%23revenuetrend&origin=HASH_TAG_FROM_FEED) #JobCosting (https://www.linkedin.com/search/results/all/?keywords=%23jobcosting&origin=HASH_TAG_FROM_FEED) #MurugeshwariBooks (https://www.linkedin.com/search/results/all/?keywords=%23murugeshwaribooks&origin=HASH_TAG_FROM_FEED)
1
26
AI Automation Specialist β€” I build AI workflows that ship
New to Contra
AI Automation Specialist β€” I build AI workflows that ship
Cover image for TACTICAL DIMENSION is a 10-screen
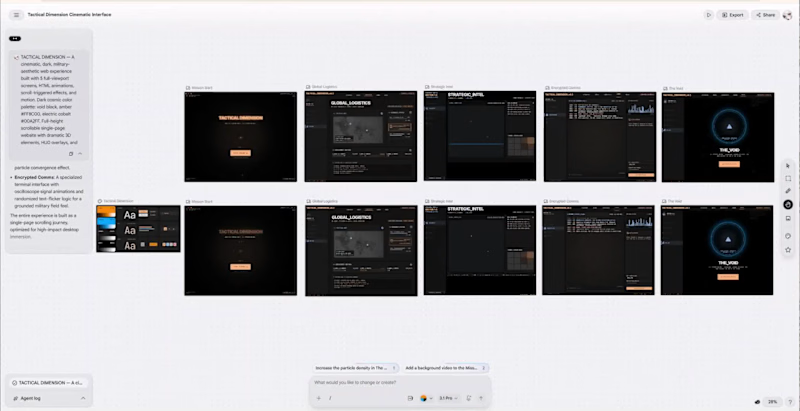
TACTICAL DIMENSION is a 10-screen cinematic military HUD interface built entirely with Google Stitch. Inspired by dark tactical aesthetics, the project features a custom animated boot sequence, targeting ring systems, a live global logistics map, encrypted comms terminal with real-time decryption animation, sensor dashboards, diagnostics panels, and a final void sequence β€” all connected into one navigable prototype. The design system is locked across all 10 screens: void black #02040E, amber #FF8C00, cobalt #00A2FF, Bebas Neue + Space Mono. Every screen was generated and iteratively refined inside Stitch β€” moving from a single descriptive prompt to a fully interactive, motion-rich interface in one session. ============================================================= How Stitch was used by ME ? Google Stitch was the core tool for every stage of this project: STREAMING GENERATION I started with a single detailed prompt describing the tactical aesthetic, color system, and layout. Stitch streamed the full interface directly to the canvas in real time β€” letting me see the design direction immediately and course-correct early without wasted effort. IN-PLACE AI EDITS This was the game-changer. Instead of regenerating screens from scratch, I used Stitch's in-place edit feature to refine individual elements β€” adding HUD overlays, enhancing targeting rings, fixing layout issues, and layering motion effects β€” all while preserving the existing design. Every screen went through 2-4 rounds of in-place refinement. ITERATION WORKFLOW The canvas became a living design document. I could see all 10 screens side by side, compare iterations (old vs new shown simultaneously), and make decisions fast. Stitch's ability to show before/after versions on the same canvas made the iteration loop extremely tight. EXPORT + DEPLOYMENT Used Stitch's built-in Netlify export to deploy each screen individually, then connected all 10 into a unified prototype with a custom boot sequence and navigation system. DESIGN CONSISTENCY Stitch maintained the amber/cobalt/void color system and Space Mono + Bebas Neue typography automatically across all 10 screens β€” something that would have taken hours to enforce manually. ============================================================= My Feedback on Stitch Stitch is the fastest path I've found from idea to interactive interface. What works brilliantly: β€” Streaming generation to canvas feels genuinely exciting. Watching the design appear in real time changes how you think about iteration. β€” In-place AI edits are the killer feature. Clicking an element and describing what to change β€” without losing everything else β€” is exactly how creative tools should work. β€” The canvas as a workspace (seeing all screens together) gives a bird's-eye view that Figma-style tools miss entirely. What I'd love to see next: β€” Video file upload support (not just images) for video backgrounds β€” Multi-screen prototype linking built directly into Stitch β€” One-click full multi-page site deploy (not screen by screen) β€” More control over animation timing and easing in generated motion Overall: Stitch cut my design-to-prototype time by roughly 80%. The combination of AI generation + in-place editing + instant export is a workflow that genuinely didn't exist before. Impressive. ============================================================= Live Site : https://tactical-dimension-googleai.netlify.app/ Live Site v2 : https://tactical-dimension.netlify.app/ Stitch Project : https://stitch.withgoogle.com/projects/15697475248820729706 X : https://x.com/NDDimension/status/2062110075444203533?s=20 LinkedIN : https://www.linkedin.com/posts/dhanraj-sharma-nddimension_googlestitch-builtwithstitch-uidesign-ugcPost-7467876011657863168-i0Ep/?utm_source=social_share_send&utm_medium=member_desktop_web&rcm=ACoAAFzn9PQBrwaChcRrWWQQVV5SA6r16Jm6fP0
2
2
128
Data Analyst & ML Engineer | Predictive Model | Dashboard |

Aspiring Data Analyst | Exploring Visualization projects