Freelancers using Google BigQuery in IndiaFreelancers using Google BigQuery in India
Make.com Level 5 & Zapier Expert: AI and Ops Automation
10
Followers
Make.com Level 5 & Zapier Expert: AI and Ops Automation
Cover image for Does someone on your team
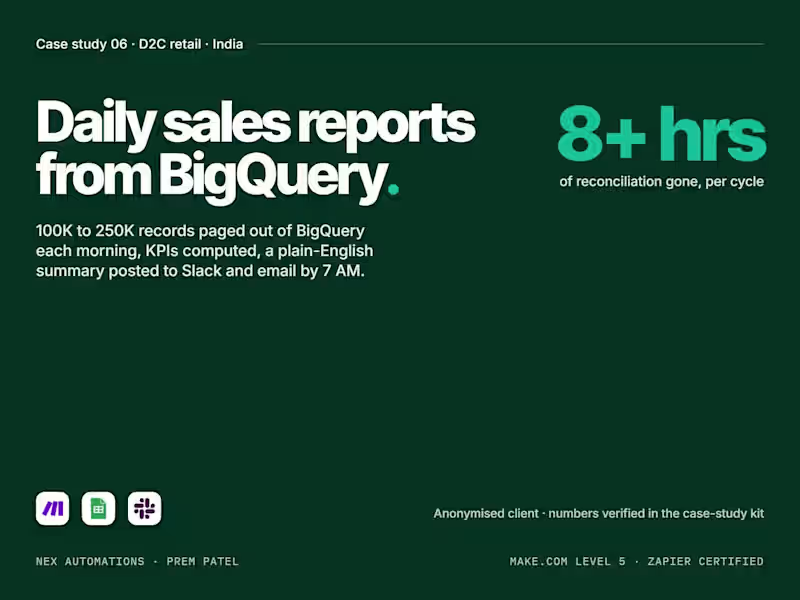
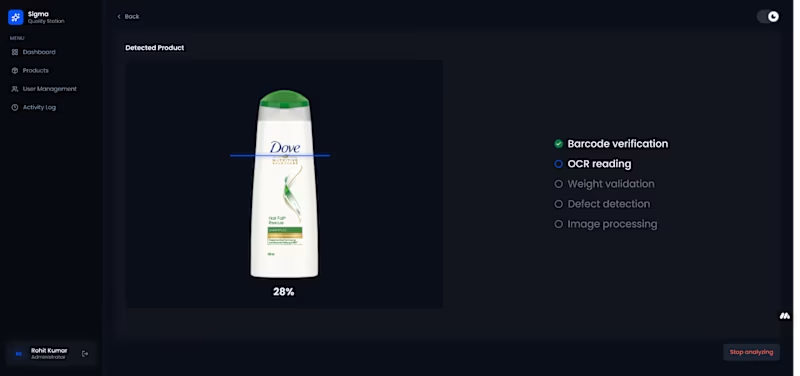
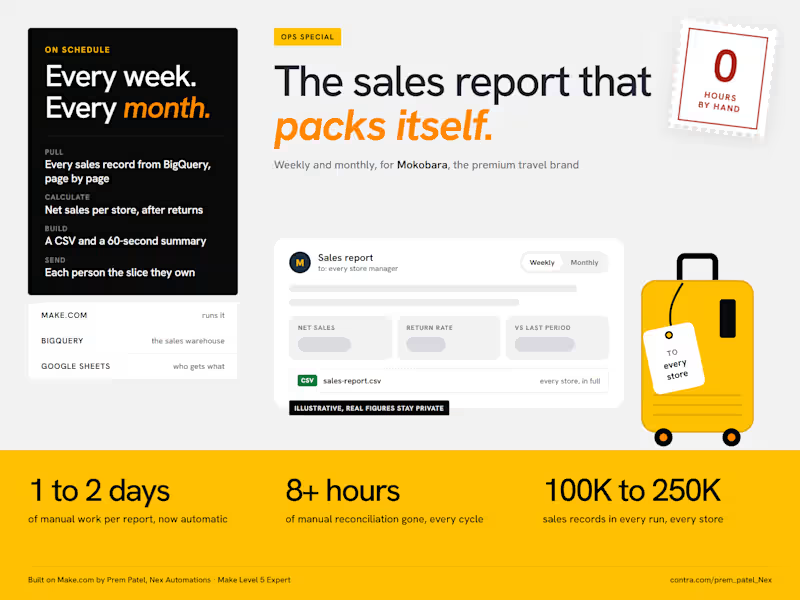
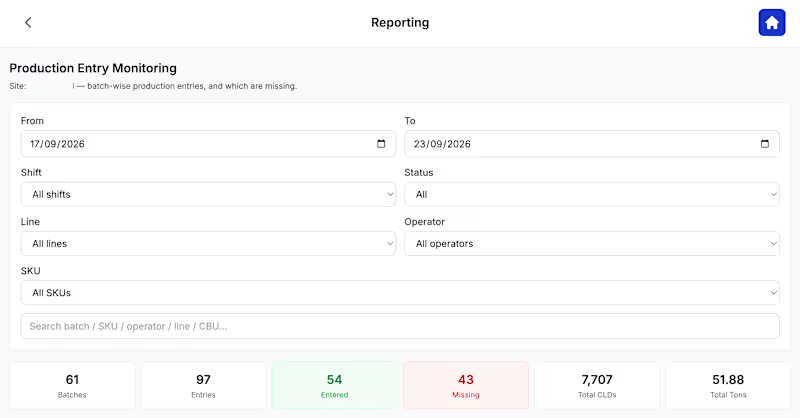
Does someone on your team lose a day or two building the sales report every week or month? That was the starting point at Mokobara, the premium travel brand. Pulling sales across all their stores, checking returns, reconciling the numbers and emailing each manager took 1 to 2 days every cycle, with 8+ hours of that spent just reconciling. I built them an automation on Make.com (http://Make.com) a few months ago. It has run on its own ever since, weekly and monthly: Make pulls every sales record from BigQuery, 100K to 250K per cycle. That is too many for one request, so it reads them page by page and stitches them back together. It calculates the numbers the team actually uses: net sales per store after returns and discounts, return rates and the change against the last period. It builds a CSV with the full breakdown and a short email summary you can read in 60 seconds. It reads a Google Sheet of store representatives and emails every one of them the report for their own store. The result: the reporting problem is gone. The report went from 1 to 2 days of manual work to fully automatic, and the 8+ hours of reconciliation dropped to zero. Two things I would do the same way again: Calculate "net sales" in the automation, not in the warehouse. The business rule for what counts as a net sale is not what the raw data stores. Send people their slice, not the whole report. One report for everyone gets skimmed by everyone. The figures in the image are placeholders, the real ones stay with the client. What report is your team still building by hand? Tell me where the data lives and I will tell you how I would automate it.
4
468
Cover image for How do you automate a
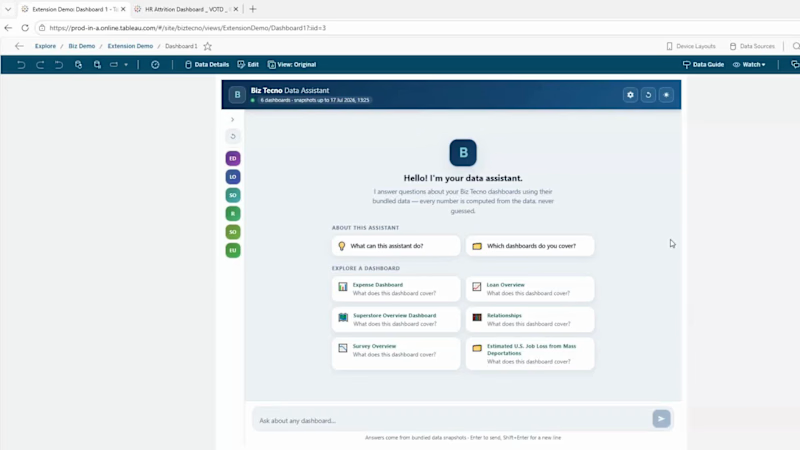
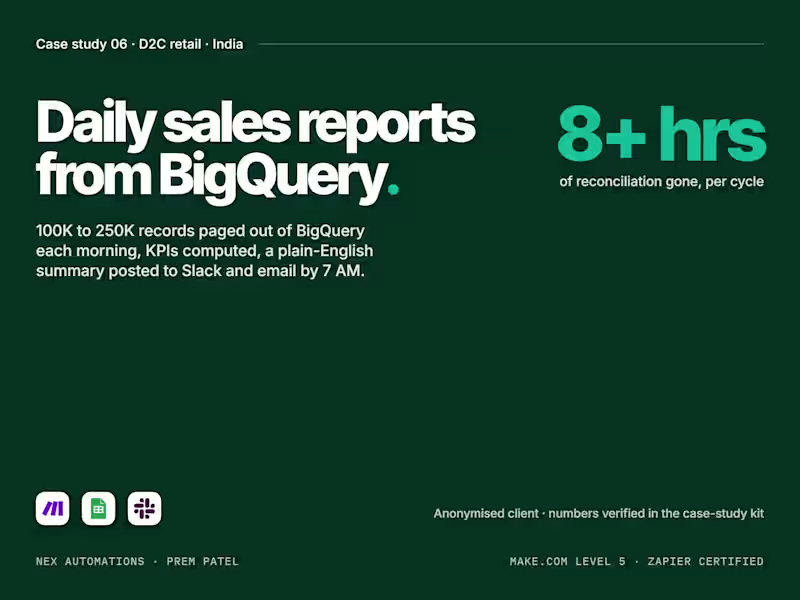
How do you automate a daily sales report from BigQuery to Slack with Make.com, when the data is 250,000 rows and the reader is not an analyst? Six decisions make or break it. A direct-to-consumer brand's daily sales report took one to two days to compile, which meant Monday's numbers arrived on Wednesday. A 7 AM Make.com scenario now pages the data out of BigQuery, computes the KPIs and posts a plain-English summary to Slack and email before anyone opens a laptop. The six decisions: 1. Page, do not pull. A day can be up to 250,000 rows. The scenario pages through BigQuery in chunks and aggregates as it goes, so no single step holds the whole table. 2. Compute the KPIs in the scenario, not in the prompt. Revenue, orders, average order value, top products and day-on-day change are arithmetic. The model only writes the sentences. 3. Give the model numbers, never the rows. A short structured summary goes to OpenAI with a fixed template; the output is two paragraphs a founder reads in thirty seconds. 4. Check before you post. If a KPI is null, if the row count is far below the trailing average, if a query failed, the scenario alerts the owner instead of posting a confident wrong report. 5. Post where people already look. Slack channel at 7 AM plus an email copy for the people not in Slack. No dashboard to remember to open. 6. Keep a paper trail. Every run logs the query window, row count, KPIs and the text it posted, so a number can be traced back a month later. The diagram shows the run: schedule, paged query, KPI step, summary, checks, Slack and email. The full case study is on my profile. The same scenario shape works with Shopify, Stripe, a CRM or a Sheet as the source. Prem Patel, Nex Automations. Make.com Level 5 certified, official Make partner, Zapier Certified Expert.
1
292
Cover image for Is your Contra discovery score
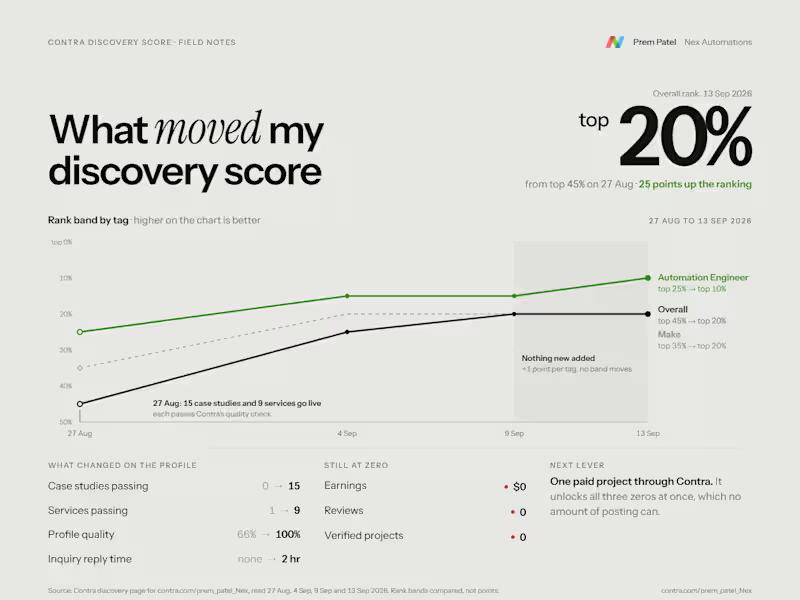
Is your Contra discovery score stuck? Mine went from top 45% to top 20% in 13 days, and posting more is not what moved it. And i need real Project On Contra๐Ÿ˜… I log my score on every tag with a small script that reads all 48 options on the discovery page, so this is what actually changed between 27 August and 9 September 2026, and what did not. What moved it: Case studies. From 0 passing Contra's quality check to 15. Contra's checklist is short: a custom cover, a clear descriptive title, an engaging description, in-depth content and real media. My first two projects failed it, one on the description and one on the media. Services. From 1 passing service to 9, each with its own cover, a descriptive title, a rate and a real summary. Every tag a service carries gets the lift, so tag the tools you actually used. Profile quality, 66% to 100% after the profile rewrite. Replying to the first inquiry quickly. Response time was blank until then. It now reads 2 hours. The result: Overall top 45% to top 20%. Automation Engineer top 25% to top 10%. Make top 35% to top 20%. What did not move it: the four days after. From 9 to 13 September every tag gained exactly 1 point. Nothing new on the profile, nothing moves. And the three biggest levers on my board are still at zero: earnings, reviews and verified projects. All three come from the same move, one paid project routed through Contra, so that is where my next week goes. One thing if you compare yourself with others: Contra's point scale changed between my runs, so compare your rank band (top X%) rather than the raw points. What moved yours? If yours is stuck, reply with your score and the tag, and I will tell you which lever I would pull first.
2
4
212
Full-Stack Developer | React, Next.js, Node.js & Python
New to Contra
Full-Stack Developer | React, Next.js, Node.js & Python
Growth Manager with 8+ years experience of AI in Growth
New to Contra
Growth Manager with 8+ years experience of AI in Growth

Senior Data Analyst | Business Intelligence Consultant
11
Followers
Senior Data Analyst | Business Intelligence Consultant
Data Analyst | SQL, PowerBI, Tableau, Python