Data Science and Visualization Expert
Data visualization engineer, Data Analyst, BI Expert
Transforming data into insights that drive growth with AI
Chartered Accountant | IFRS, US GAAP | Data Analyst 📊
Chartered Accountant | IFRS, US GAAP | Data Analyst 📊


View more →
Transforming complexity into clarity through data.
Transforming complexity into clarity through data.


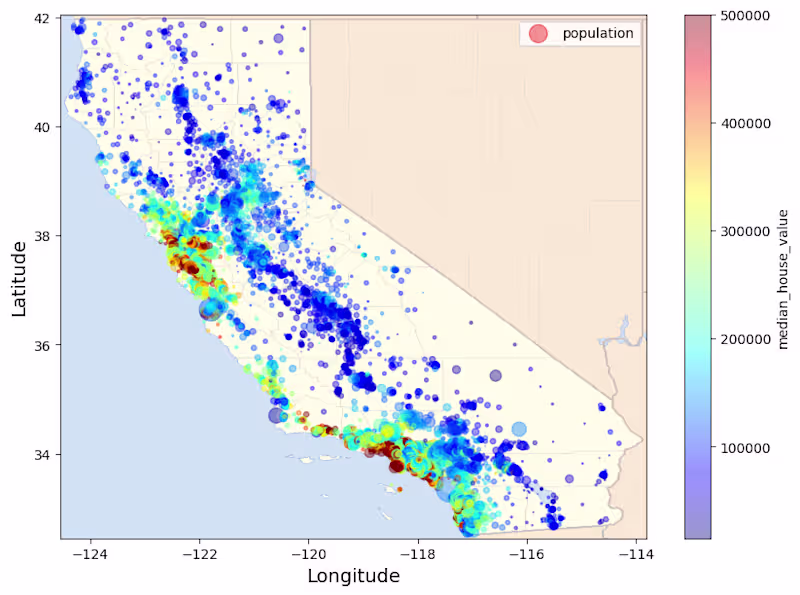
Expert Data Visualization with Tableau & Matplotlib
Expert Data Visualization with Tableau & Matplotlib

View more →
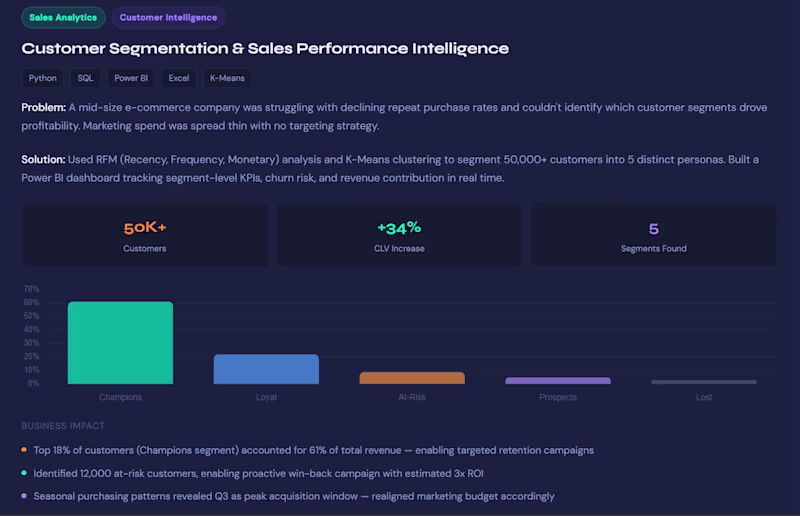
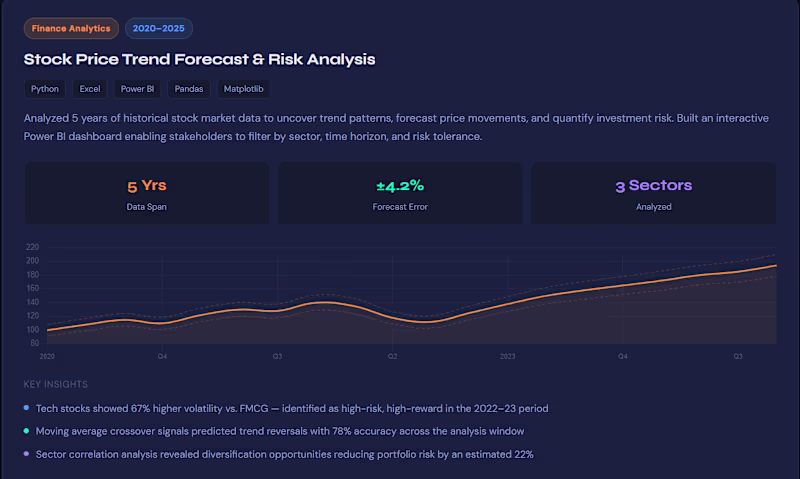
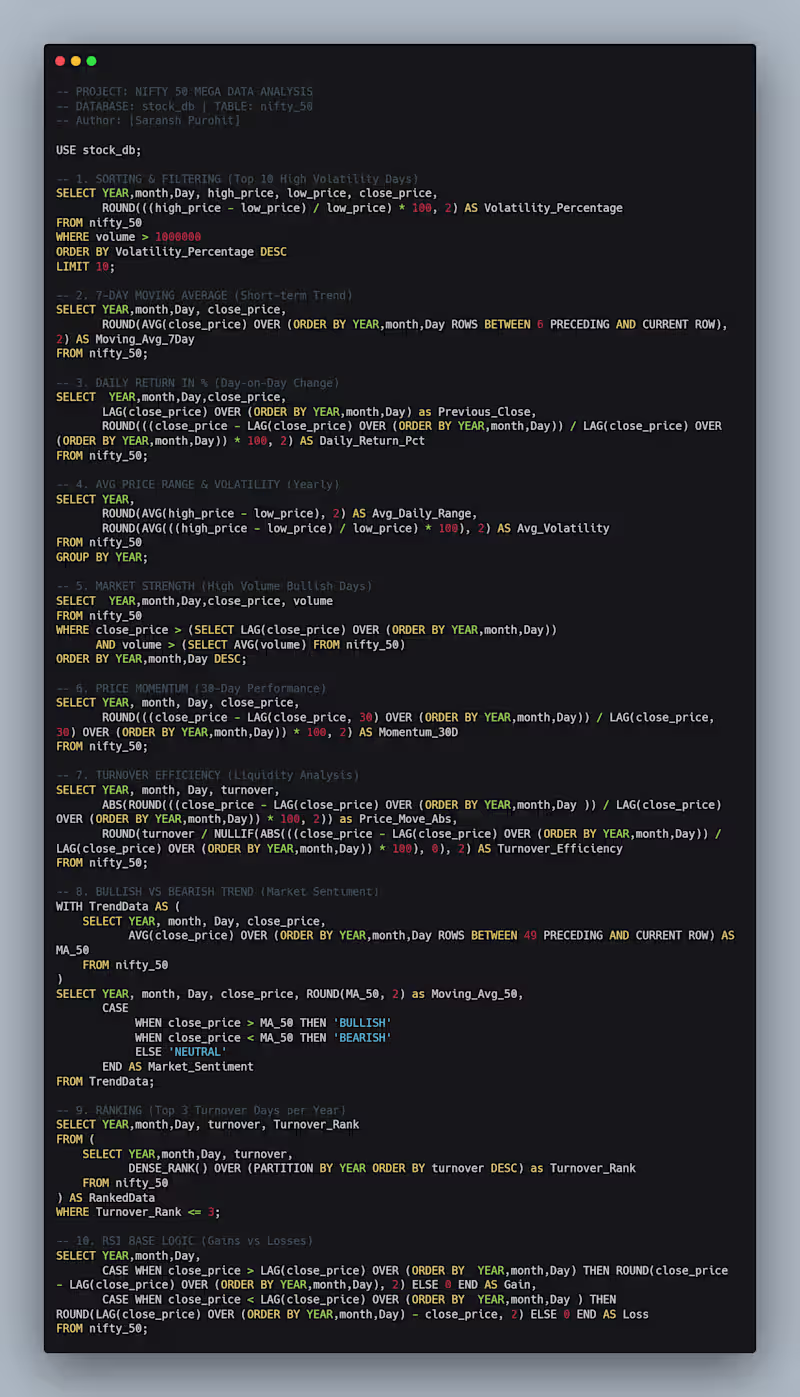
Data Analyst | SQL & Power BI Specialist
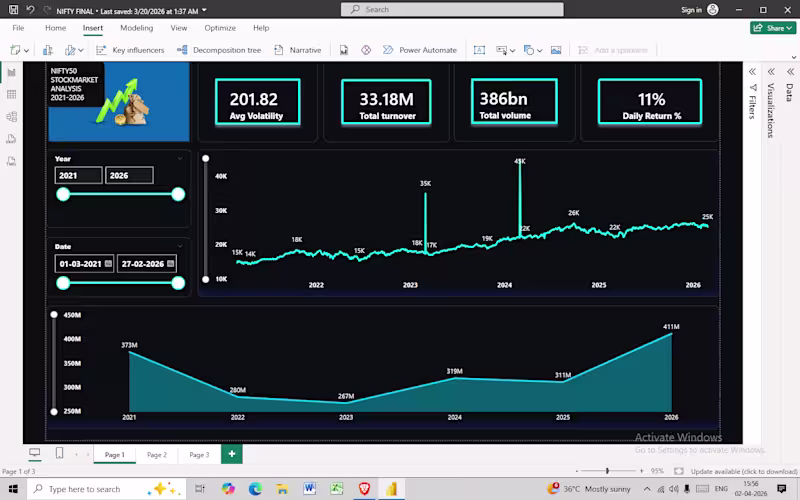
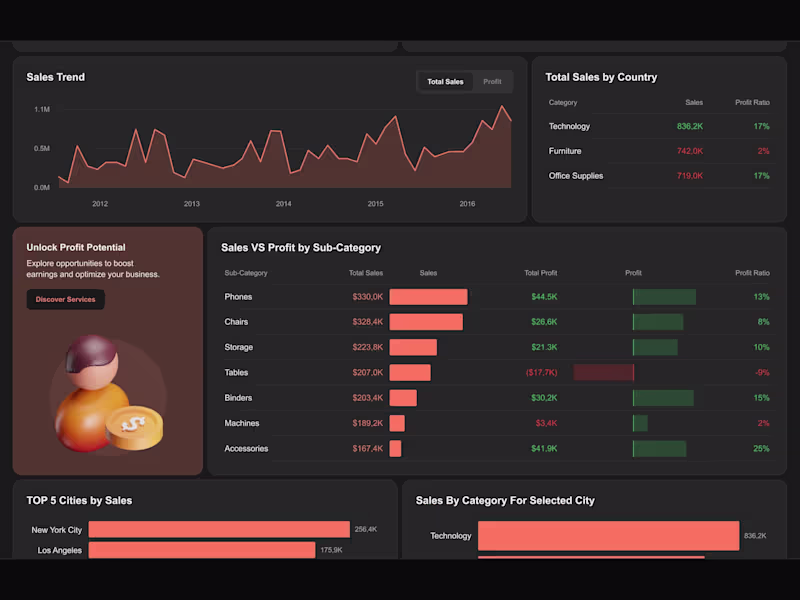
Business Intelligence Specialist | Power BI & Excel Expert
Business Intelligence Specialist | Power BI & Excel Expert