
Digital architect — websites, systems, AI builds.


The Barracks is a 32-year-old leather-and-brotherhood institution. The owner is relocating from Palm Springs to a 4,600 sq ft space in Phoenix's Melrose District — and the move opens the door to a full rebrand.
I built a single interactive deck giving the client three full strategic directions to choose from, each rendered as its own self-contained brand world inside one URL:
⦿ Solid Alpha — dark, military, badge-forward. The confident anchor, built on the venue's existing brand colors.
⦿ Desert Reborn — warm, editorial, cinematic. A mythic rebirth that leans into "Phoenix" itself.
⦿ The Hide — leather-forward heritage. Gear, hardware, oxblood and brass. The most true to what The Barracks has always been.
Each direction keeps the wolf, the 32-year legacy, and the leather soul — they simply feel like three different nights.
Engineered as a gateway landing with a sticky switcher, each direction loaded as an isolated full pitch deck (iframe srcdoc) so their separate color systems never collide. One URL, three full brand visions, frictionless comparison.
Built end-to-end under Rare by Design. The full interactive deck is available on request.
0
112


Websites, Stores & Funnels| Framer, Shopify,Kajabi,Wordpress


Websites, Stores & Funnels| Framer, Shopify,Kajabi,Wordpress





Building intuitive experiences. From concept to launch


Building intuitive experiences. From concept to launch


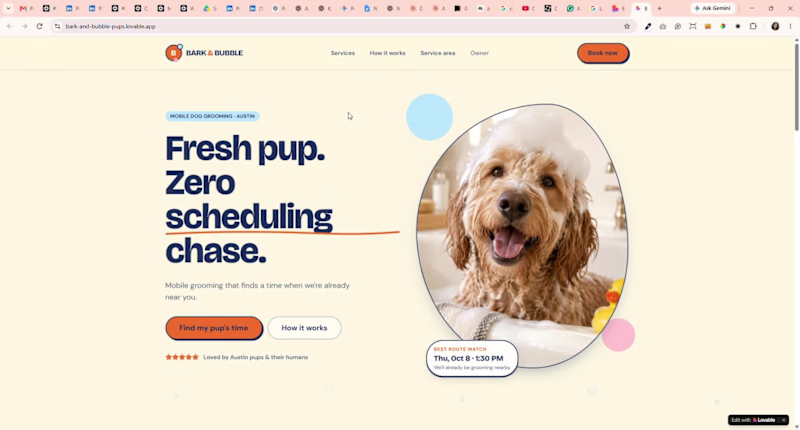
Built BARK & BUBBLE 🐾 for the @Lovable challenge — a booking experience for a solo mobile dog groomer where scheduling isn’t just about finding an open time.
The flow considers the dog, service time, location, and the van’s existing route to suggest smarter appointments. Customers can book and pay a deposit without the usual back-and-forth, while the owner’s schedule updates automatically.
My favorite part: when a cancellation happens, the system checks the waitlist, finds the best route-friendly match, sends the offer, and fills the opening if they accept — without the owner having to chase anyone.
From “Can I book my dog?” to “You’re booked.” 🐶🚐
1
201


Design & Development Made Easy


Squarespace Dev & Brand Strategist for Bold Creative Brands
- 5.0
- Rating
- 11
- Followers
Squarespace Dev & Brand Strategist for Bold Creative Brands


Product designer (fintech, B2B SaaS, AI-assisted systems)




Founder & AI Automation Systems Architect
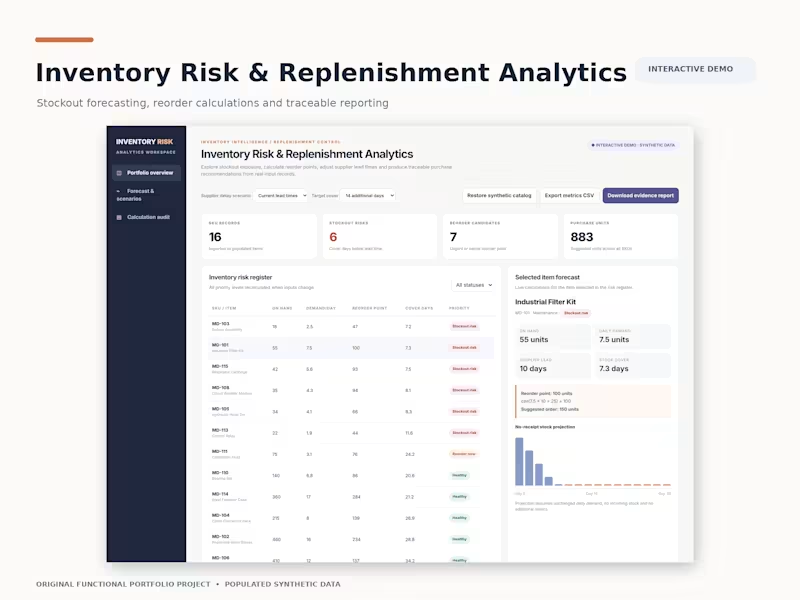
This video demonstrates an interactive inventory analytics application designed to help operations teams monitor stock availability, identify supply shortages, and make informed replenishment decisions.
Using 16 populated synthetic inventory records, the walkthrough demonstrates how changes in stock quantities and supplier lead times automatically update inventory risk calculations.
What the Video Demonstrates
Inventory Dashboard: Displays stock availability, six stockout-risk items, and seven replenishment candidates.
Stockout Risk Detection: Identifies products that may run out before replacement inventory arrives.
Supplier Delay Simulation: Demonstrates how changing lead times affects replenishment calculations and risk exposure.
Interactive Inventory Management: Shows how stock adjustments immediately update dashboard metrics.
Replenishment Analytics: Calculates reorder points using demand, lead time, and safety stock.
Reporting: Provides calculated inventory results and export capabilities.
Technical Implementation
Developed the interactive dashboard, inventory calculation logic, scenario controls, risk filtering, and data import/export functionality using JavaScript, HTML5, and CSS3.
The demonstration showcases a functional inventory management analytics application with reproducible calculations and clearly identified synthetic data.
2
0
124
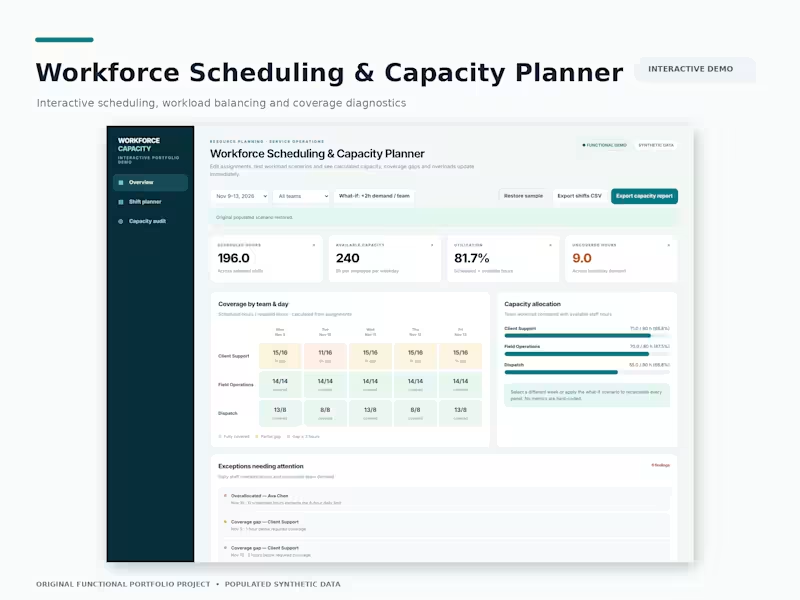
Workforce Scheduling & Capacity Planner | Interactive Demo
This video demonstrates a desktop-optimized workforce scheduling application designed to help operations teams manage staff assignments, monitor capacity, and identify coverage gaps.
Using populated synthetic workforce data, the walkthrough shows how scheduling changes automatically recalculate staffing availability and operational performance metrics.
What the Video Demonstrates
Workforce Capacity Dashboard: Displays 196 scheduled hours, 240 available hours, and 81.7% workforce utilization.
Interactive Shift Management: Demonstrates adding staff assignments and automatically recalculating capacity metrics.
What-If Scenario Planning: Simulates increased staffing demand, raising uncovered hours from 9 to 33.
Multi-Dimensional Coverage Analysis: Displays staffing requirements across departments and weekdays using interactive coverage grids.
Capacity Auditing: Identifies staffing shortages, employee overallocations, and operational exceptions requiring attention.
Technical Implementation
Application Logic: Developed interactive state management that updates dashboard calculations when assignments, reporting periods, or staffing requirements change.
Data Processing: Implemented calculations comparing scheduled staffing hours against available capacity and departmental demand.
Data Management: Built CSV import/export functionality, input validation, and downloadable capacity reports.
Technology: JavaScript, HTML5, and CSS3.
The demonstration showcases a functional workforce planning application with traceable calculations and interactive scenario analysis.
0
32
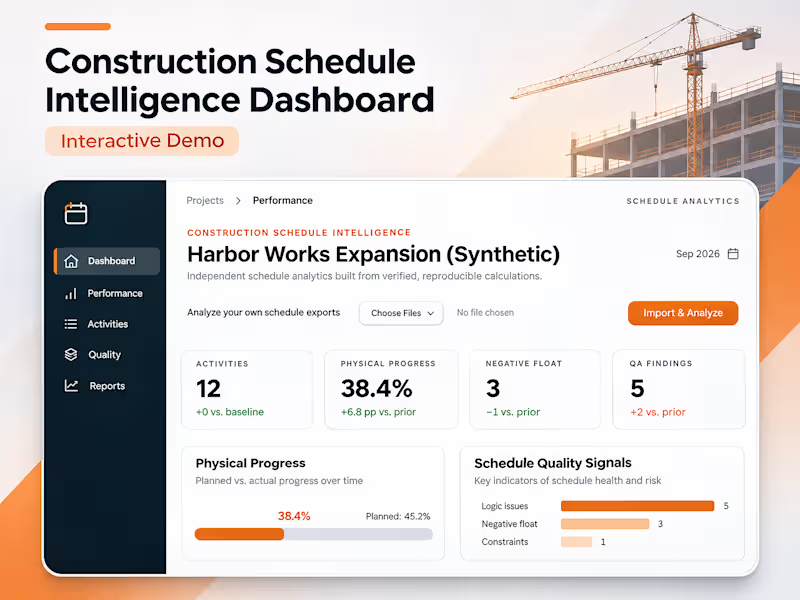
Construction Schedule Intelligence Dashboard | Interactive Demo
This video demonstrates an interactive, local-first construction schedule analytics dashboard designed to process Primavera P6 XER files, evaluate project performance, and identify scheduling risks.
Using the Harbor Works Expansion synthetic project, the walkthrough highlights how construction schedule data is transformed into measurable performance insights.
What the Video Demonstrates
Schedule Data Processing: An interactive dashboard populated with construction activity data and project scheduling information.
Project Health Metrics: 12 activities, 38.4% calculated physical progress, 3 negative-float activities, and 5 automated quality assurance findings.
Performance Visualization: Interactive progress tracking comparing 38.4% completion against a 33% baseline target.
Schedule Risk Detection: Identification of negative float and scheduling quality issues requiring attention.
Data Export: CSV and JSON export capabilities for sharing activity records and calculated results.
The demonstration showcases how automated schedule analysis can support faster project reviews, clearer performance reporting, and more informed project controls decisions.
0
31

Fullstack Dev: Expert in Ruby on Rails & Laravel
Fullstack Dev: Expert in Ruby on Rails & Laravel


