Construction Schedule Intelligence Dashboard |

Construction Schedule Intelligence Dashboard | Interactive Demo
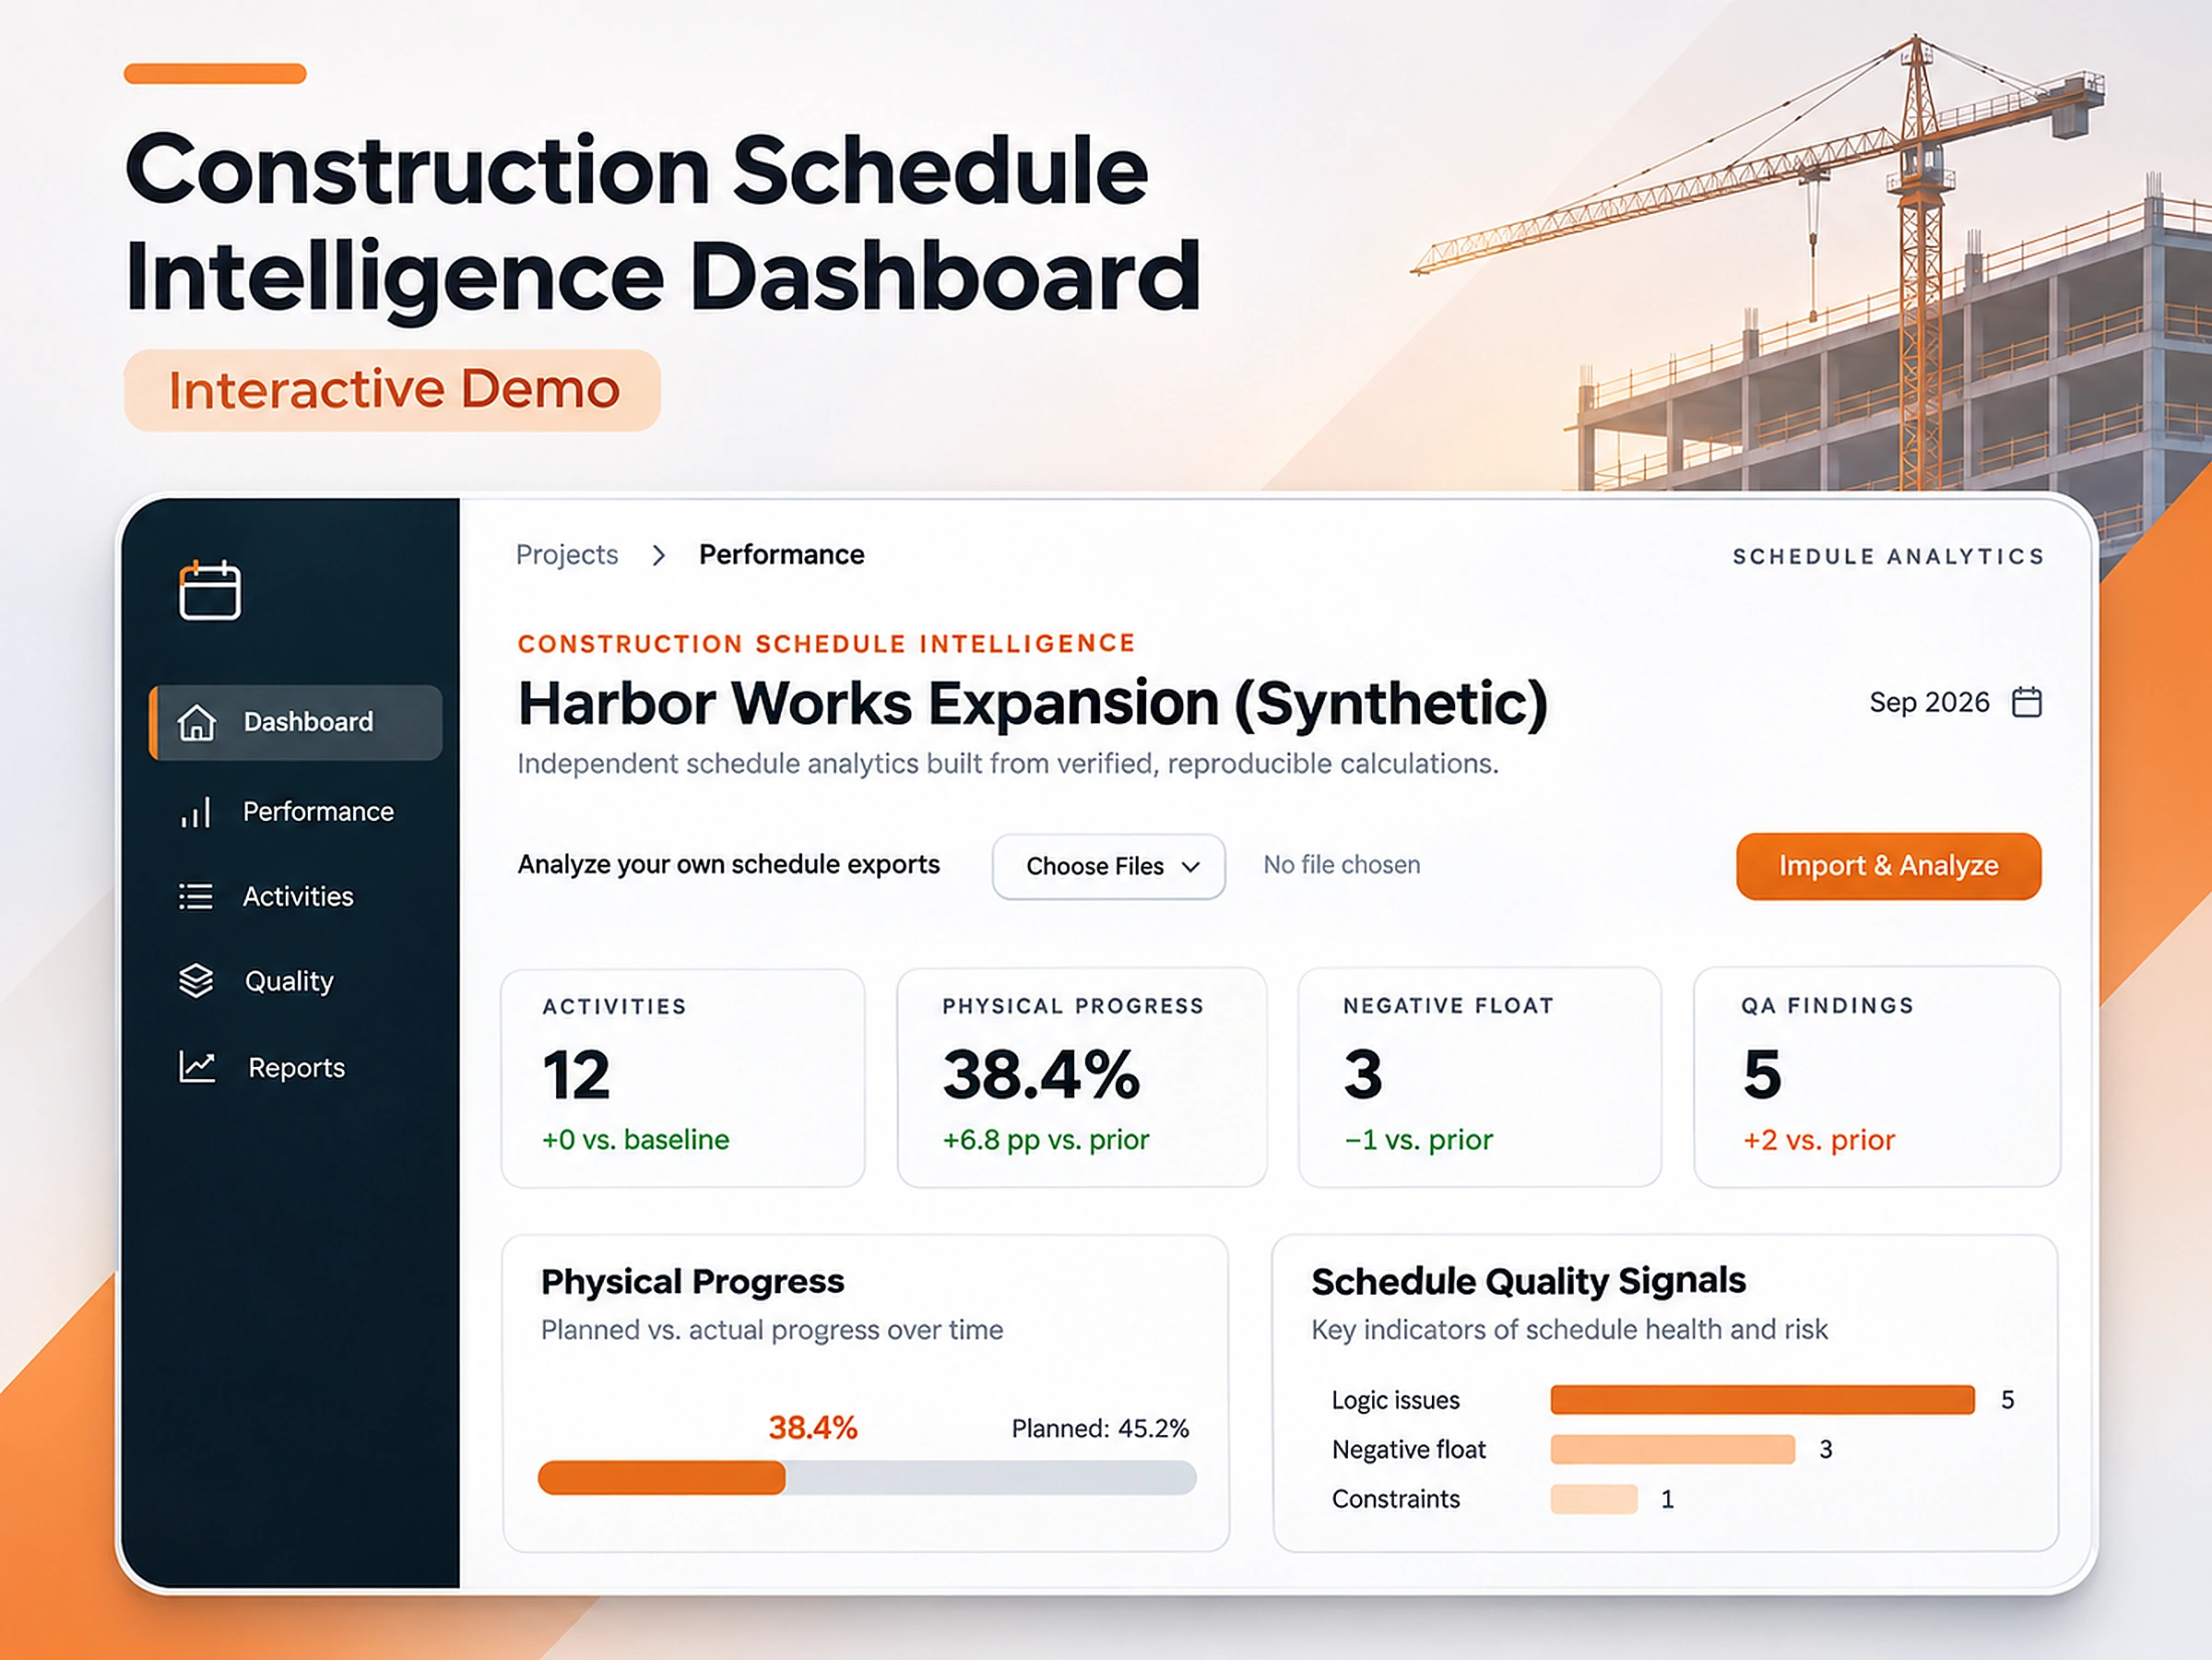
This video demonstrates an interactive, local-first construction schedule analytics dashboard designed to process Primavera P6 XER files, evaluate project performance, and identify scheduling risks.
Using the Harbor Works Expansion synthetic project, the walkthrough highlights how construction schedule data is transformed into measurable performance insights.
What the Video Demonstrates
Schedule Data Processing: An interactive dashboard populated with construction activity data and project scheduling information.
Project Health Metrics: 12 activities, 38.4% calculated physical progress, 3 negative-float activities, and 5 automated quality assurance findings.
Performance Visualization: Interactive progress tracking comparing 38.4% completion against a 33% baseline target.
Schedule Risk Detection: Identification of negative float and scheduling quality issues requiring attention.
Data Export: CSV and JSON export capabilities for sharing activity records and calculated results.
The demonstration showcases how automated schedule analysis can support faster project reviews, clearer performance reporting, and more informed project controls decisions.
0 likes · 0 views · Nov 9, 2026
Construction Schedule Intelligence Dashboard | Interactive Demo This video demonstrates an interactive, local-first construction schedule analytics dashboard...