
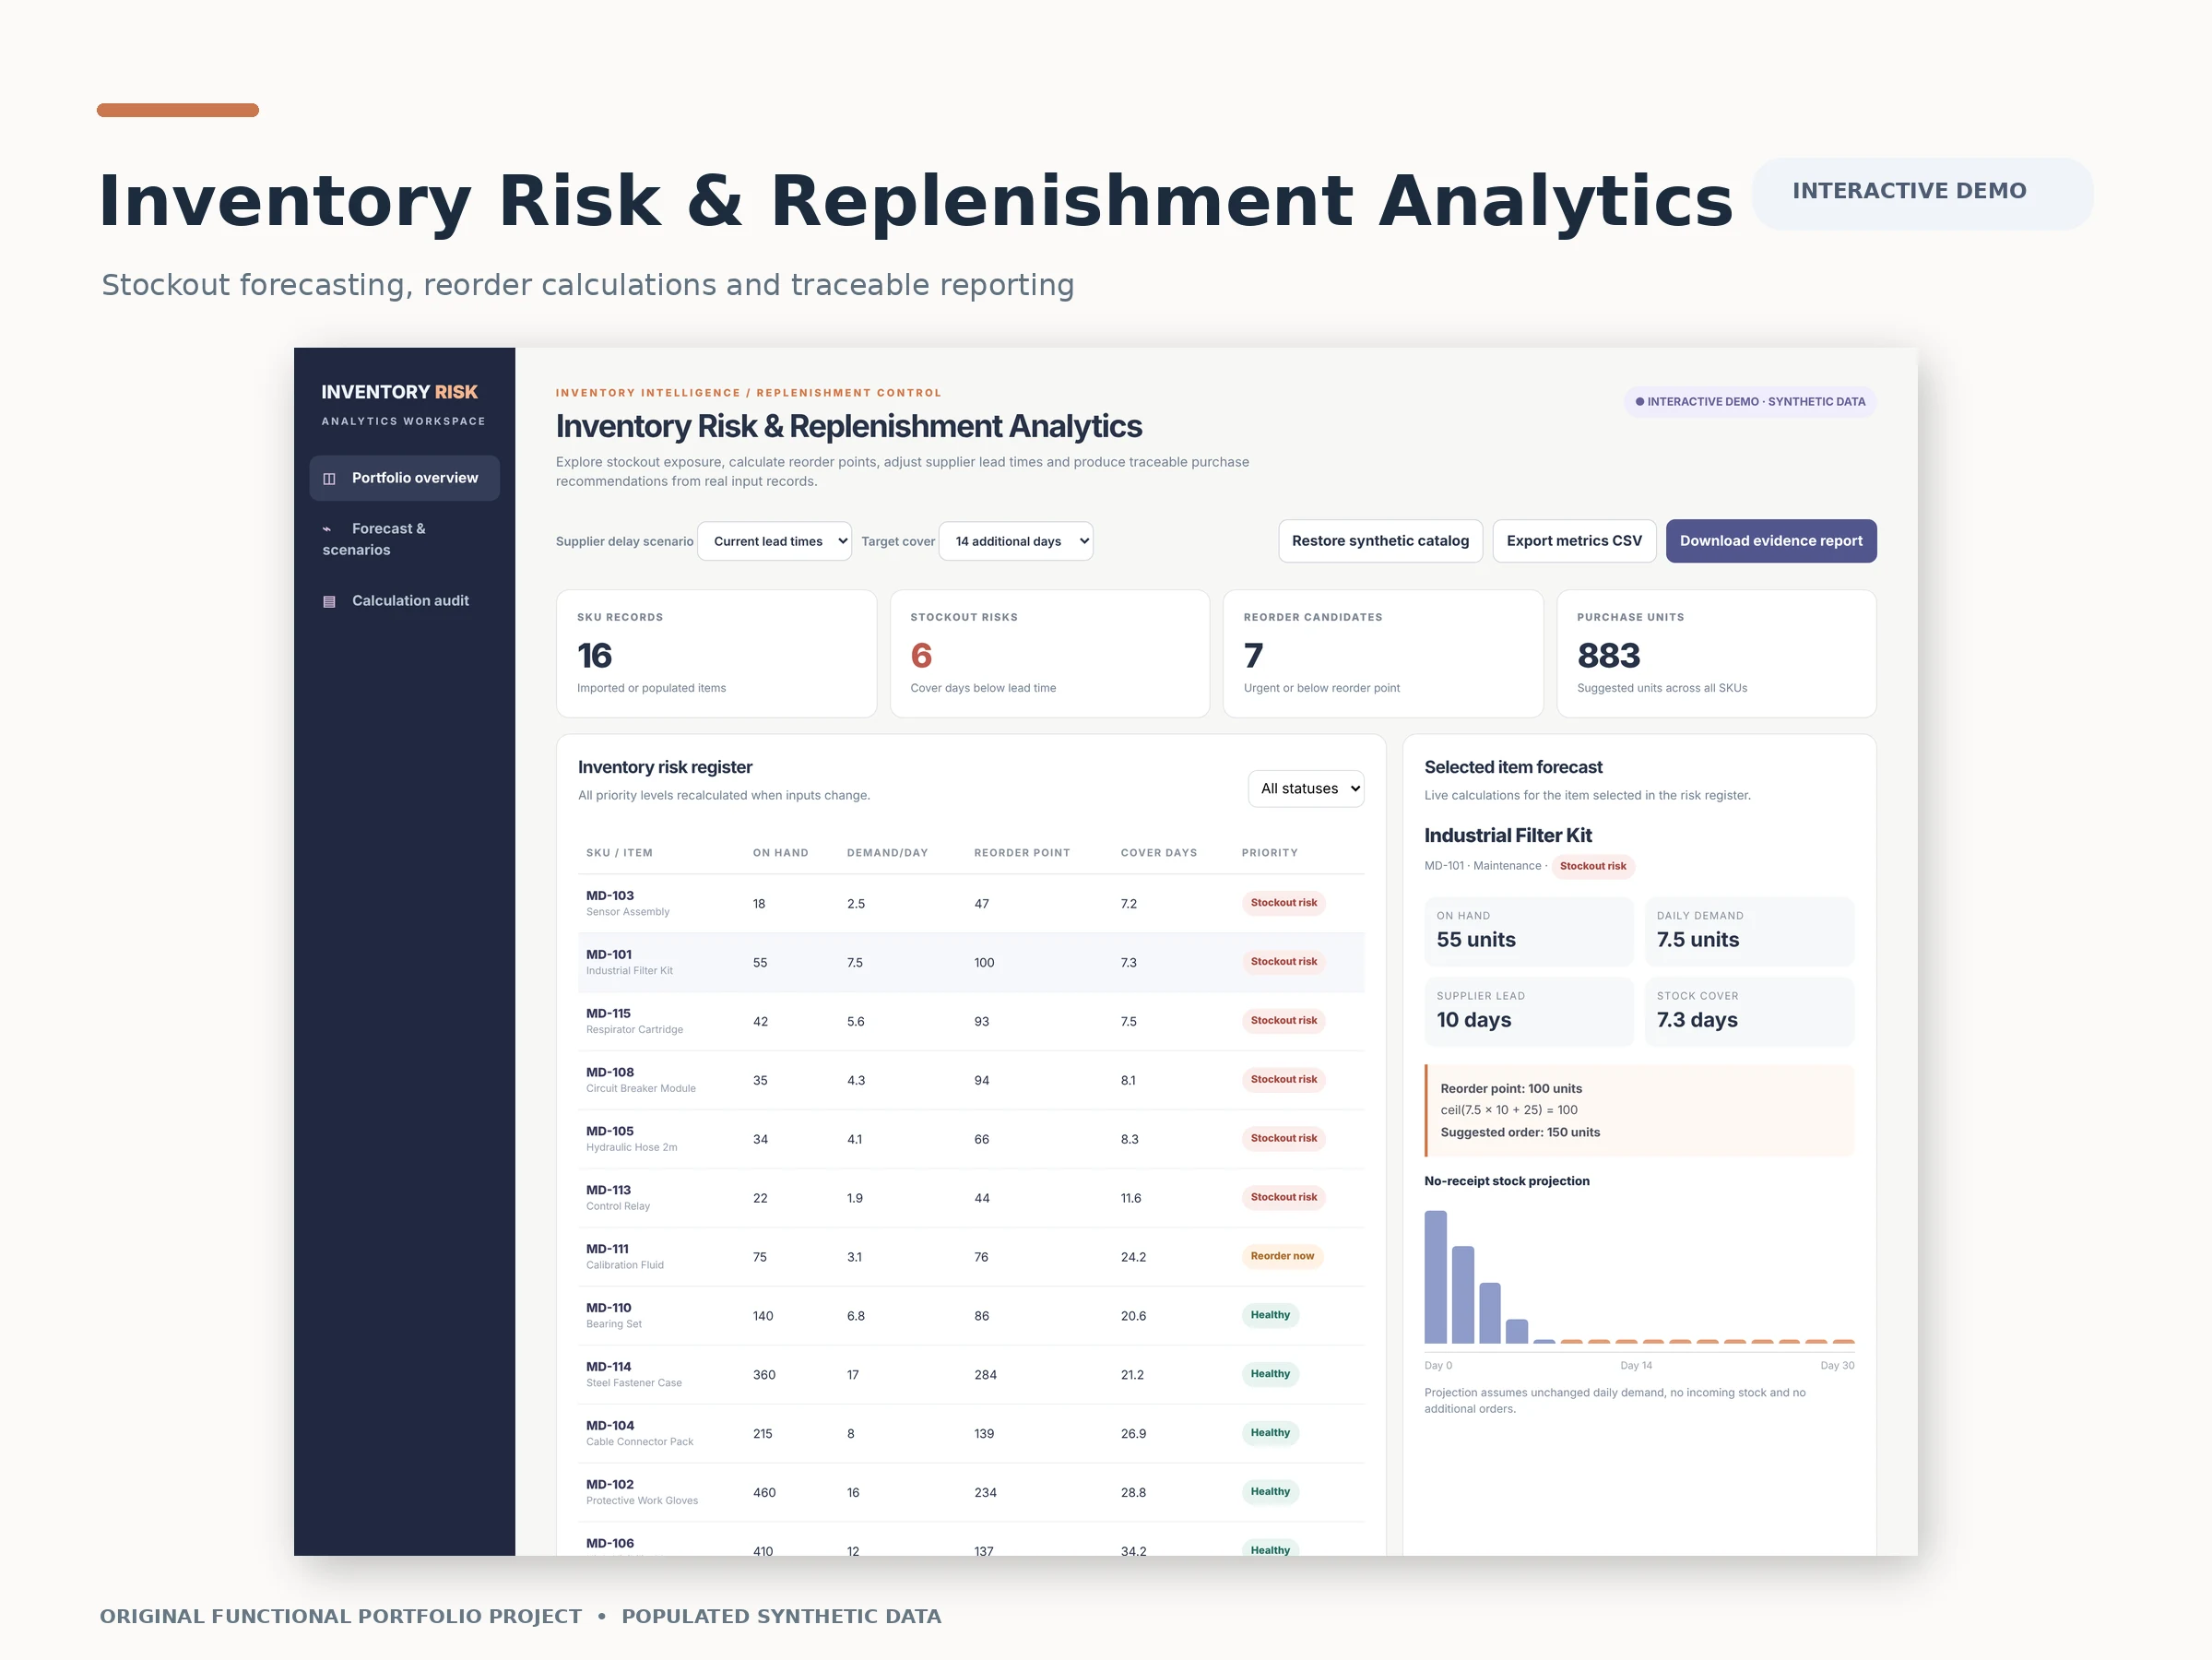
This video demonstrates an interactive inventory analytics application designed to help operations teams monitor stock availability, identify supply shortages, and make informed replenishment decisions.
Using 16 populated synthetic inventory records, the walkthrough demonstrates how changes in stock quantities and supplier lead times automatically update inventory risk calculations.
What the Video Demonstrates
Inventory Dashboard: Displays stock availability, six stockout-risk items, and seven replenishment candidates.
Stockout Risk Detection: Identifies products that may run out before replacement inventory arrives.
Supplier Delay Simulation: Demonstrates how changing lead times affects replenishment calculations and risk exposure.
Interactive Inventory Management: Shows how stock adjustments immediately update dashboard metrics.
Replenishment Analytics: Calculates reorder points using demand, lead time, and safety stock.
Reporting: Provides calculated inventory results and export capabilities.
Technical Implementation
Developed the interactive dashboard, inventory calculation logic, scenario controls, risk filtering, and data import/export functionality using JavaScript, HTML5, and CSS3.
The demonstration showcases a functional inventory management analytics application with reproducible calculations and clearly identified synthetic data.
0 likes · 0 views · Nov 9, 2026
This video demonstrates an interactive inventory analytics application designed to help operations teams monitor stock availability, identify supply shortage...


