Freelancers using QGIS
Sign Up
Post a job
Sign Up
Log In
Filters
1
Projects
People
Shaun Ducker
Ko Tao, Thailand
UAV Photogrammetry & GIS Specialist | Metashape + QGIS
New to Contra
Follow
Message
UAV Photogrammetry & GIS Specialist | Metashape + QGIS
0
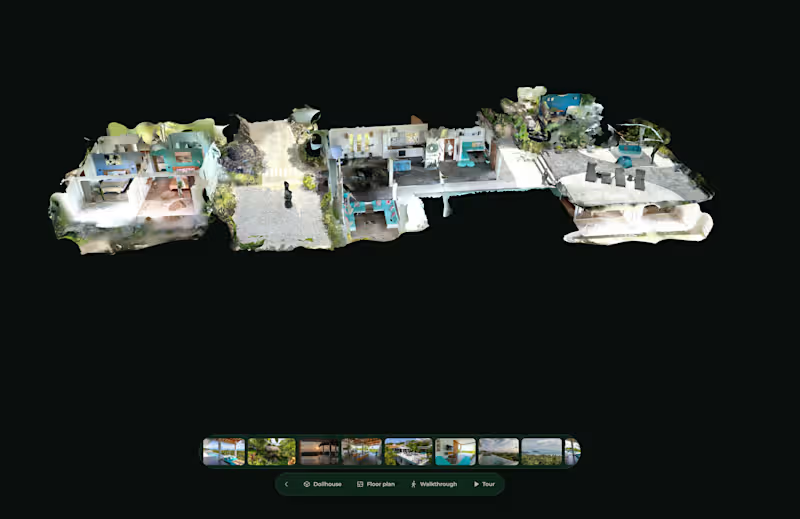
Shades of Blue is a complete property reality-capture and interactive 3D experience built for a luxury villa in Thailand. The project combined exterior drone photogrammetry, detailed 3D reconstruction and interior 360° capture into a single explorable property experience. I handled the workflow from capture and processing through to the final interactive presentation, including: • Exterior UAV photogrammetry • Detailed textured 3D property model • Interior 360° walkthrough • Spatial navigation between rooms • Floor-plan and dollhouse-style views • Terrain and surrounding landscape context • Optimisation for an interactive web-based property viewer The goal was to let potential buyers and clients understand the entire property remotely — both inside and outside — in a way that standard photography cannot.
0
15
0
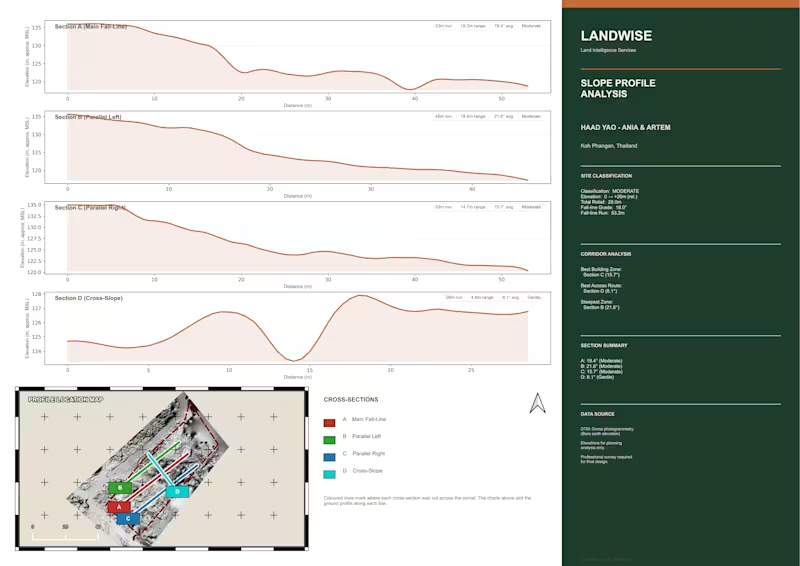
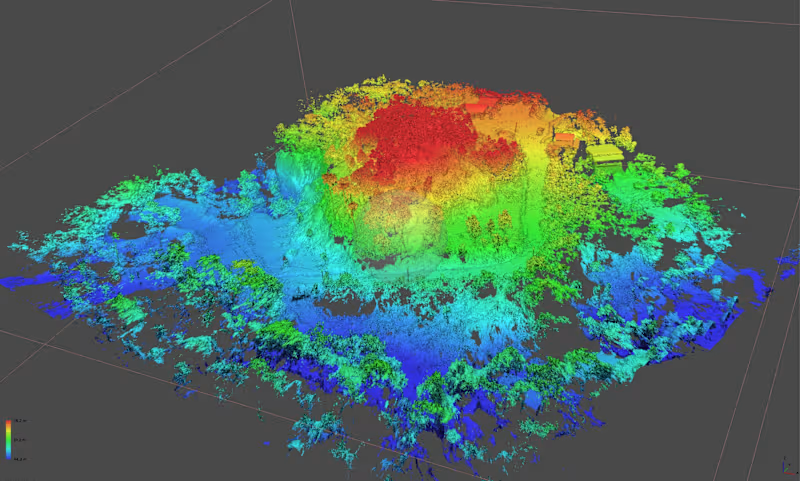
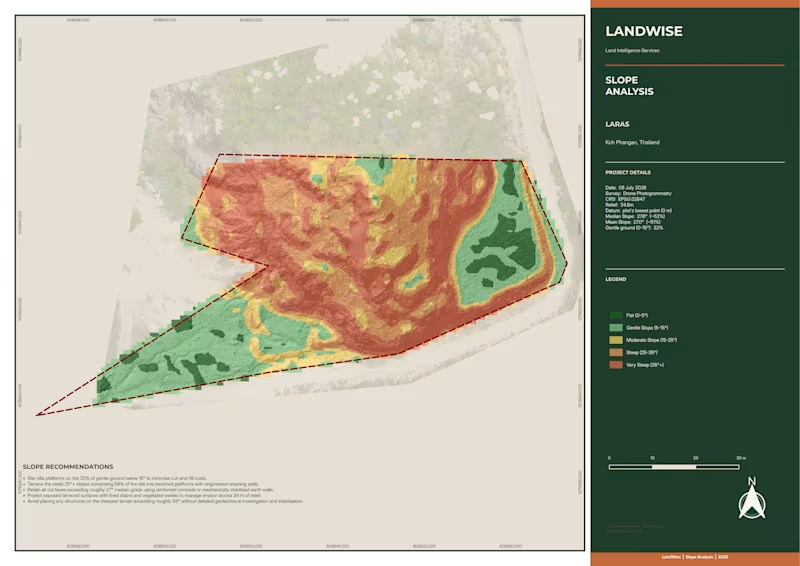
Complete UAV photogrammetry and geospatial processing project for a hillside property in Thailand. I processed 1,272 aerial images in Agisoft Metashape Professional and QGIS, producing a high-resolution orthomosaic, dense point cloud, ground-classified terrain data, DTM/DEM, 0.5 m contours, elevation analysis and a detailed 3D reconstruction. The dataset generated more than 376 million dense points, including over 121 million ground-classified points, with mapping outputs at approximately 1 cm resolution. The final deliverables were prepared for practical land and property analysis, with clear visual outputs showing terrain, elevation, slope and site conditions.
0
21
0
Complete UAV photogrammetry and geospatial processing project for a hillside property in Thailand. I processed 1,272 aerial images in Agisoft Metashape Professional and QGIS, producing a high-resolution orthomosaic, dense point cloud, ground-classified terrain data, DTM/DEM, 0.5 m contours, elevation analysis and a detailed 3D reconstruction. The dataset generated more than 376 million dense points, including over 121 million ground-classified points, with mapping outputs at approximately 1 cm resolution. The final deliverables were prepared for practical land and property analysis, with clear visual outputs showing terrain, elevation, slope and site conditions.
0
22
0
Complete UAV photogrammetry and geospatial processing project for a hillside property in Thailand. I processed 1,272 aerial images in Agisoft Metashape Professional and QGIS, producing a high-resolution orthomosaic, dense point cloud, ground-classified terrain data, DTM/DEM, 0.5 m contours, elevation analysis and a detailed 3D reconstruction. The dataset generated more than 376 million dense points, including over 121 million ground-classified points, with mapping outputs at approximately 1 cm resolution. The final deliverables were prepared for practical land and property analysis, with clear visual outputs showing terrain, elevation, slope and site conditions.
0
32
QGIS
(4)
Follow
Message
Jenish Jana
Coimbatore, India
Senior GIS Specialist | ArcGIS & QGIS Expert
New to Contra
Follow
Message
Senior GIS Specialist | ArcGIS & QGIS Expert
0
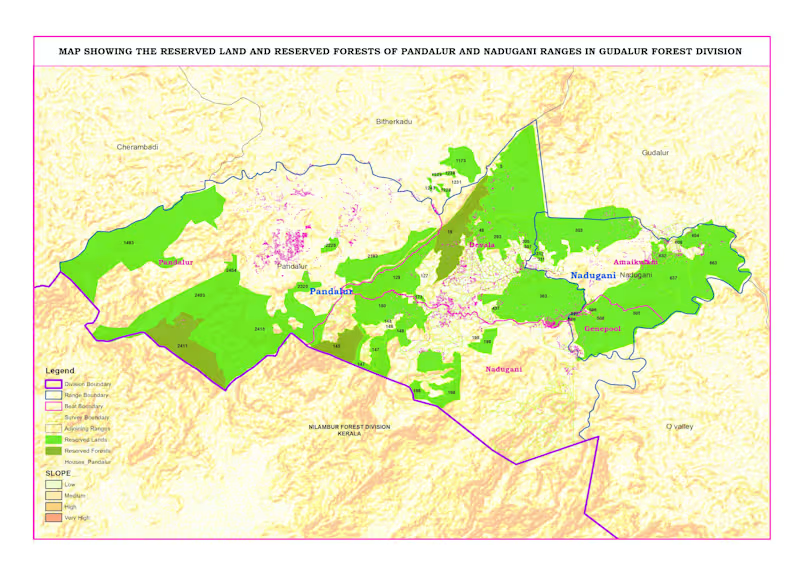
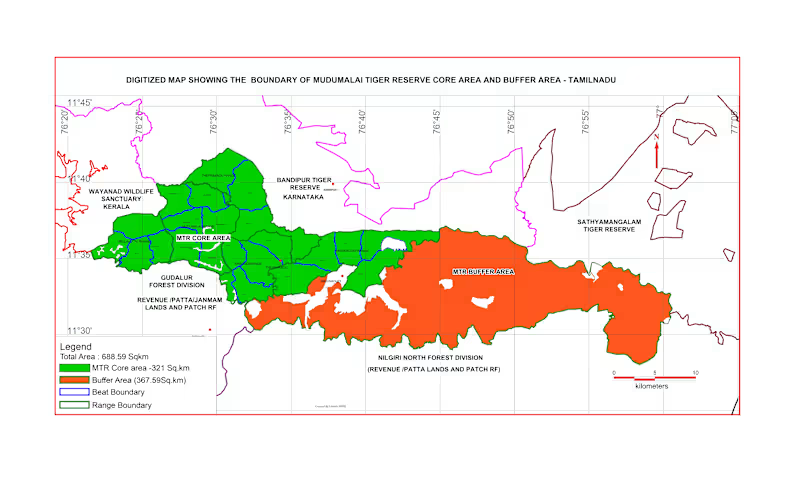
Reserved Land & Reserved Forest Map – Pandalur & Nadugani Ranges This project focuses on mapping reserved lands and reserved forests in the Pandalur and Nadugani ranges under the Gudalur Forest Division. Using QGIS, I created a detailed administrative map including division, range, beat, and survey boundaries. I integrated forest classification data with terrain (slope) analysis to provide a clear understanding of land distribution and landscape characteristics. The map also highlights human settlements within and around forest areas, helping in planning, management, and decision-making. This project demonstrates my expertise in administrative mapping, boundary digitization, and geospatial data visualization for government and environmental applications. 👉 Available for administrative mapping and GIS projects. Feel free to message me.
0
69
0
Administrative Boundary Mapping & GIS Solutions I provide accurate and professional administrative boundary mapping services using ArcGIS and QGIS. With 12+ years of GIS experience, I create clear and reliable maps for districts, taluks, villages, and other administrative units. I can digitize boundaries from maps, georeference data, and prepare clean GIS layers (Shapefile, GeoJSON, KML). These maps are useful for planning, governance, reporting, and decision-making. Whether you need boundary correction, map visualization, or data preparation, I ensure high accuracy, proper alignment, and professional output. 👉 Message me to discuss your mapping requirements.
0
68
0
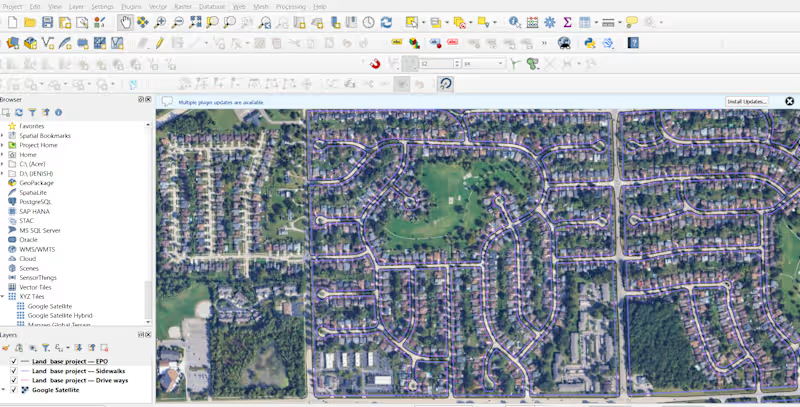
Utility Mapping & Asset Digitization using GIS Description Accurate utility mapping is essential for infrastructure planning and asset management. In this project, I developed a comprehensive GIS-based utility map by integrating field-collected GPS data with spatial datasets. I digitized utility assets such as pipelines, electrical lines, and infrastructure features, ensuring proper alignment and georeferencing. Using ArcGIS and QGIS, I organized the data into structured layers, making it easy to analyze, update, and use for decision-making. The final output included clean, high-precision maps and GIS datasets (Shapefile/GeoJSON) that can be used for planning, maintenance, and future expansion of utility networks. This project highlights my ability to handle large datasets, ensure spatial accuracy, and deliver professional GIS solutions for real-world applications. 👉 Available for utility mapping, asset digitization, and GIS data management projects. Feel free to message me.
0
86
0
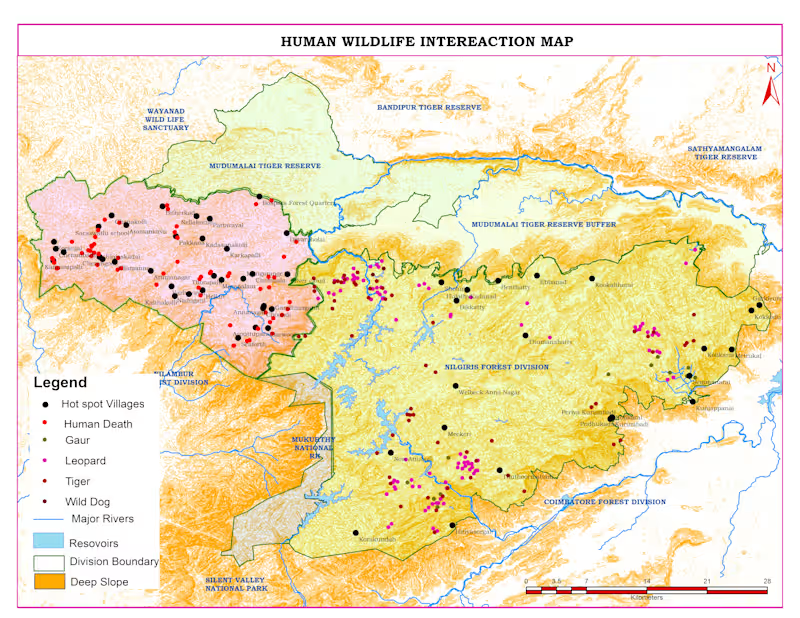
Human–Wildlife Conflict Map Human–wildlife conflict is a major challenge in forest fringe areas. In this project, I analyzed conflict incidents across the Nilgiris landscape to identify high-risk zones and support better decision-making. Using ArcGIS and QGIS, I mapped human death incidents, wildlife presence (leopard, tiger, gaur, wild dog), and hotspot villages. I integrated terrain (slope), forest boundaries, rivers, and reservoirs to understand patterns of wildlife movement and interaction with human settlements. The analysis revealed that most conflict incidents occur near forest edges and buffer zones, especially in villages close to protected areas. Leopard activity was widely distributed, indicating higher interaction risk with human populations.This project demonstrates my ability to transform complex geospatial data into clear, actionable insights for forest management and conservation planning. 👉 Available for similar GIS mapping and spatial analysis projects. Feel free to message me.
0
77
QGIS
(4)
Follow
Message
Cinzia Bongino
Metropolitan City of Turin, Italy
Graphic, UX/UI, and Data Visualization Designer
$1k+
Earned
3x
Hired
5.0
Rating
19
Followers
Follow
Message
Graphic, UX/UI, and Data Visualization Designer

3
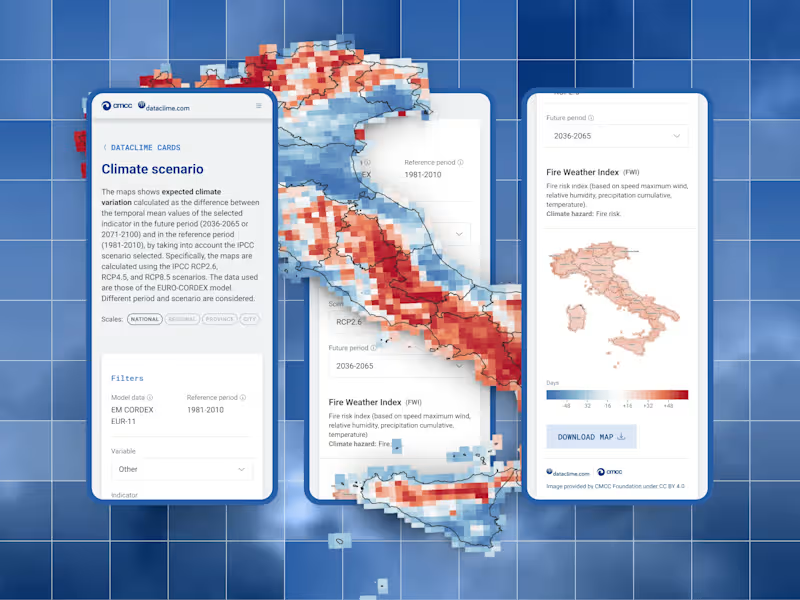
Dataclime Platform Redesign
1
3
48
2
Identity and data visualization for an exhibition
2
49
1
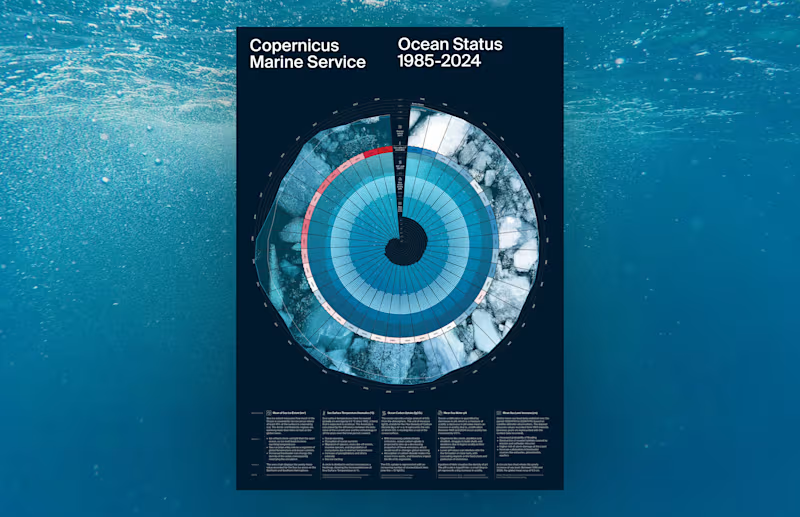
Ocean Status 1985-2924
1
4
0
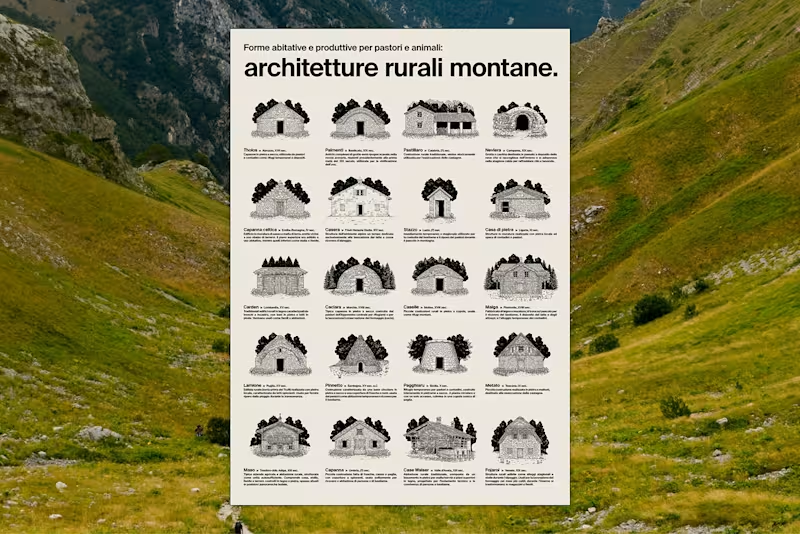
Italian Mountain Architecture Poster
0
5
QGIS
(2)
Follow
Message
Aline Moraes
Brasília - Brasilia, Brazil
GIS developer | Environmental mapping and spatial analysis
5.0
Rating
6
Followers
Follow
Message
GIS developer | Environmental mapping and spatial analysis
17
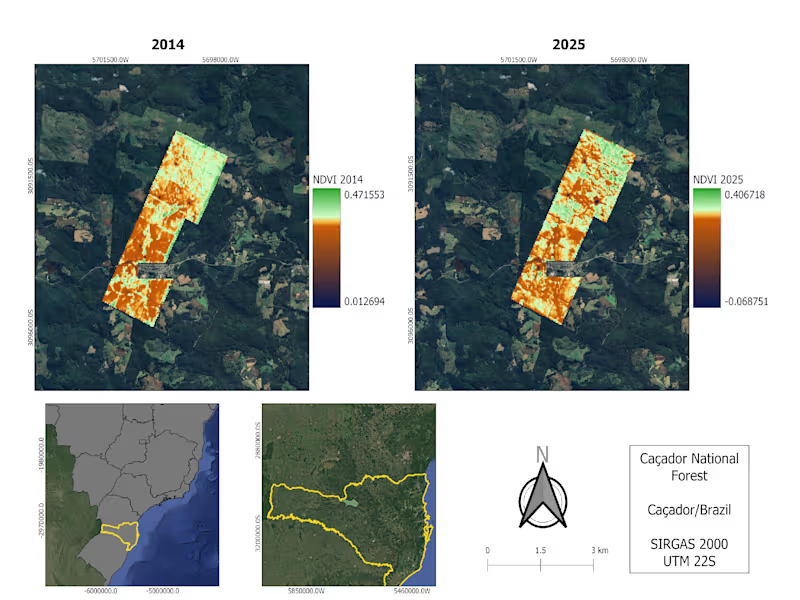
We use satellite imagery to monitor different types of environmental data. The map below shows the NDVI (Normalized Difference Vegetation Index) calculated using Landsat 8 imagery, which indicates vegetation health. You can find more details on this topic in my papers and reports.
1
17
246
16
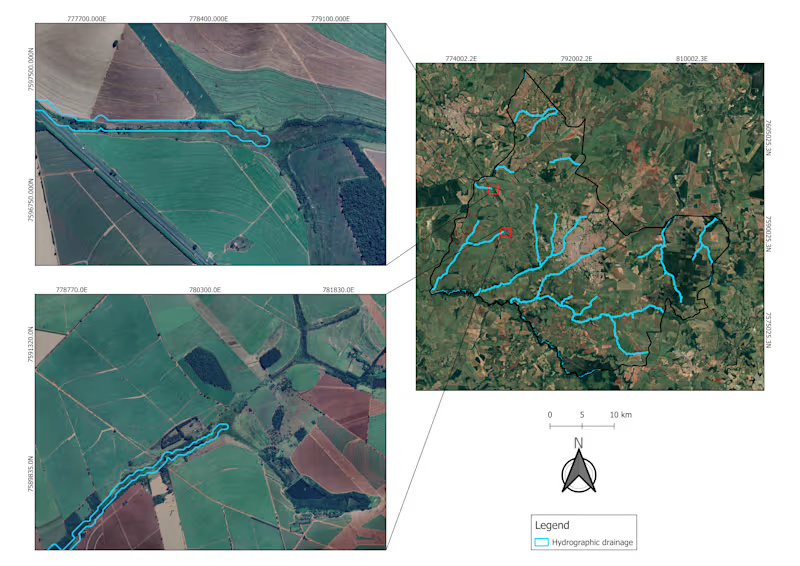
Technologies for the carbon market In the map below, hydrograph drainage was generated using satellite imagery (Copernicus Global DSM 30m). The satellite imagery reveals that, in many cases where rivers and springs occur, the required vegetation cover is not properly maintained. With climate change, issues like this are becoming increasingly relevant. The carbon market has great potential for growth and improvement with the use of these technologies.
16
219
0
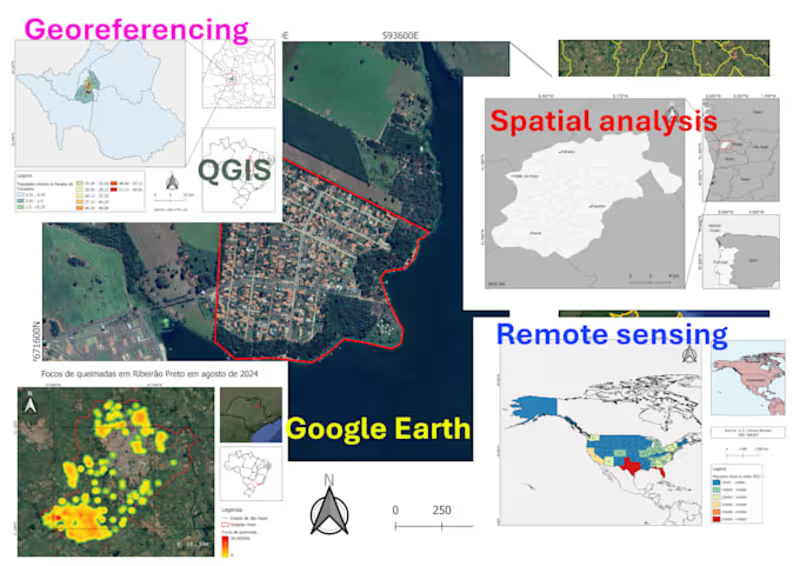
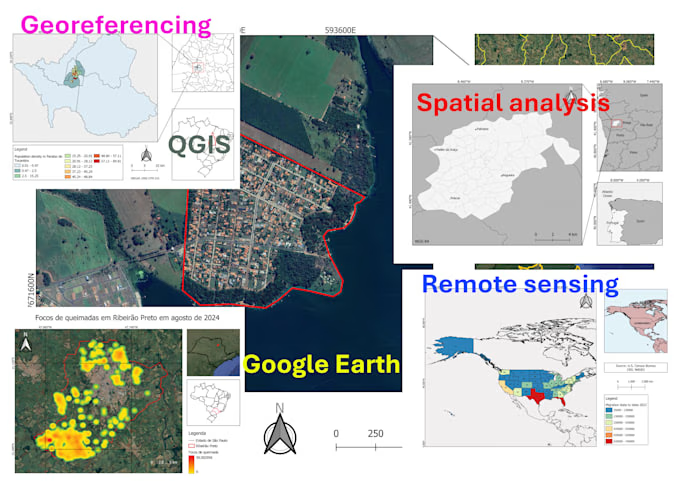
GIS Mapping and Spatial Analysis Project
0
20
View more →
QGIS
(3)
Follow
Message
Miguel Martín
Colombia
Project Manager & Implementation Consultant
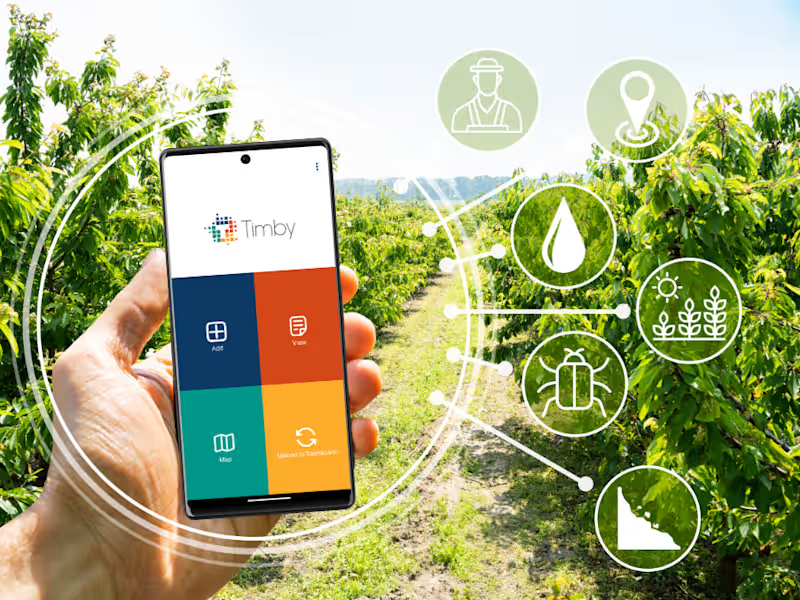
Follow
Message
Project Manager & Implementation Consultant

0
Project Management for Canadian Tech Startup
0
37
0
Implementing Solutions for Global Environmental Competition
0
15
0
Implementation Consulting for US-based Nonprofit
0
13
0
E-Learning Platform for Legal BPO Firm
0
20
QGIS
(1)
Follow
Message
Ahmad Mustafa
Lahore, Pakistan
GIS & Python Developer | Geospatial AI Specialist
New to Contra
Follow
Message
GIS & Python Developer | Geospatial AI Specialist
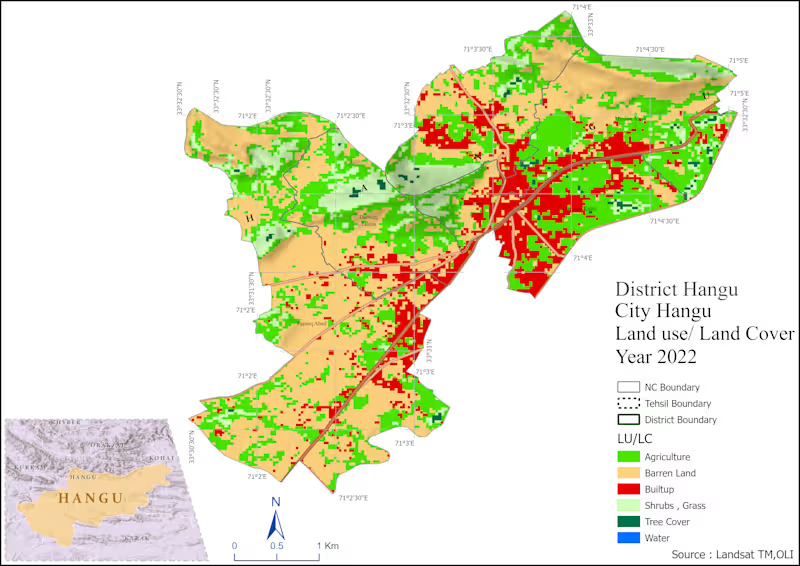
0
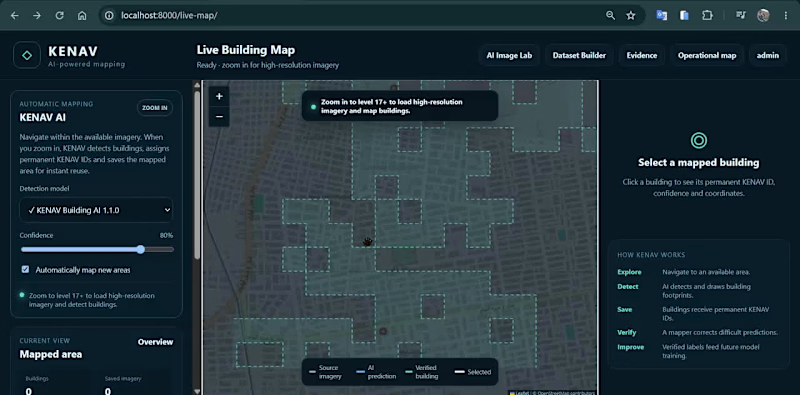
🛰️ AI-Powered Building Detection & Human-in-the-Loop GIS A look at a geospatial AI platform I developed for detecting, reviewing, and managing building footprints from satellite imagery. The workflow combines GeoAI, GIS and human validation to turn AI predictions into reliable geospatial datasets. In this demo: • AI-based building footprint detection • Interactive satellite imagery and GIS mapping • Building polygon visualization • Confidence-based AI predictions • Accept / reject prediction workflow • Manual correction of detected footprints • Human-reviewed labels for future model improvement • Geospatial coordinates and building-level data management The goal is to create a scalable workflow where AI performs the initial mapping while human review improves accuracy and provides better training data for subsequent model versions. Built around GIS + GeoAI + computer vision + satellite imagery. Always interested in connecting with people working in GIS, GeoAI, remote sensing, mapping and spatial AI.
0
40
0
GIS-based spatial analysis and mapping project using ArcGIS, QGIS, and Remote Sensing data. Developed accessibility, land use, and spatial distribution maps to support urban planning and decision-making.
0
28
0
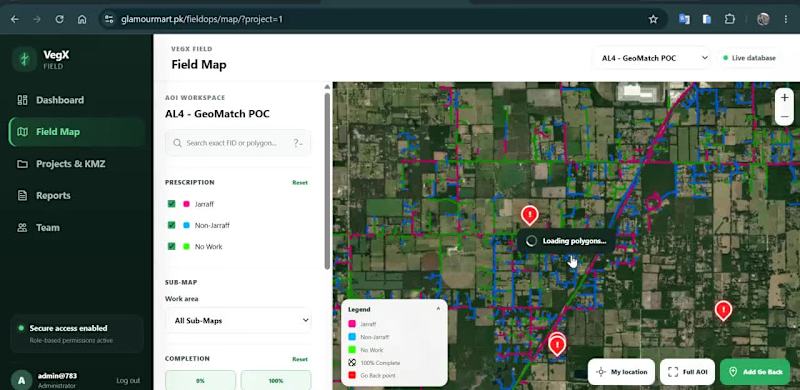
🗺️ Web GIS for Field Operations & Location-Based Data Collection I developed an interactive geospatial platform designed to help teams visualize, manage and update field-work information directly on a map. The application combines Web GIS, satellite imagery, spatial data management and field reporting in a single workflow. Key capabilities include: • Interactive field map with spatial work areas • Color-coded work / prescription classifications • Multiple GIS sub-maps and project views • Satellite and OpenStreetMap basemap switching • Work completion and status tracking • Location-based field-point creation • GPS coordinate capture • Field categorization and notes • Photo attachment support for field observations • Map-based project and team workflows The goal is to replace disconnected field records with a centralized spatial workflow, where teams can see exactly where work is required, record observations from the field, and maintain geographically accurate project information. Built around Web GIS, spatial databases and interactive mapping. Interested in projects involving GIS development, field-data collection, asset management, spatial dashboards and geospatial workflow automation.
0
16
0
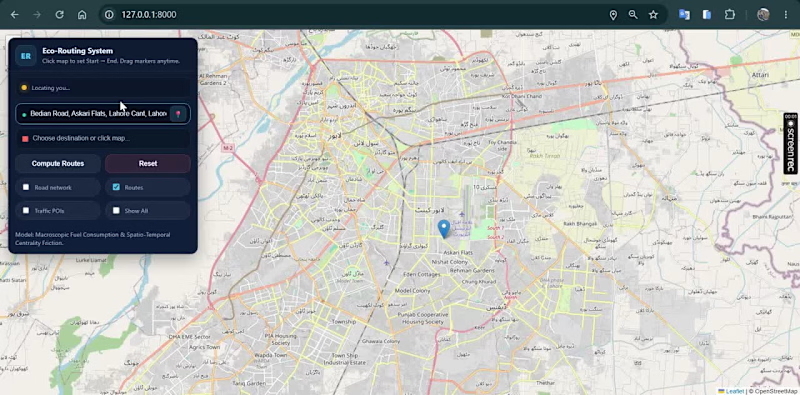
🚗🌍 Can a navigation system recommend the most fuel-efficient route instead of simply the shortest one? This project was developed as part of my MPhil Remote Sensing & GIS thesis. I designed and developed an intelligent Web GIS routing system that generates and compares four alternative routes between an origin and destination and recommends the most suitable route using a Multi-Criteria Decision-Making (MCDM) approach. Instead of considering only distance, the system evaluates multiple factors such as: • 🌱 Fuel-efficiency / environmental suitability • ⏱ Travel duration • 🚧 Road hurdles and route conditions • 📏 Travel distance The alternatives are evaluated using a TOPSIS-based decision model, allowing the system to identify the route with the best overall balance rather than simply choosing the shortest path. I also integrated an AI assistant that explains route recommendations in natural language, helping users understand why one route is preferable to the alternatives. Key features: • Interactive Web GIS navigation • Four-route generation and comparison • MCDM/TOPSIS route ranking • Fuel-efficient route recommendation • Route distance and travel-time analysis • Road-condition / hurdle consideration • AI-generated route explanations • Interactive route visualization • Decision-support interface for sustainable mobility Built with Python, Django, GIS, Leaflet/OpenStreetMap, MCDM and AI integration. This research explores how GIS + decision science + AI can support smarter and more sustainable urban mobility.
0
22
QGIS
(2)
Follow
Message
Colin Sherman
San Antonio, USA
Market intelligence & AI workflows for CRE and EDC teams
New to Contra
Follow
Message
Market intelligence & AI workflows for CRE and EDC teams
1
Over 3.5 years as Director of Hospitality Analytics at CoStar Group, I authored 140+ market analyses covering hotel performance across 60+ U.S. markets — with a focus on Texas, the U.S. South, and major metros including Dallas, Austin, San Antonio, New Orleans, Nashville, and Atlanta. Work was published at CoStar.com (http://CoStar.com) and syndicated through regional Business Journals and national outlets including the Wall Street Journal. Topics included supply pipeline analysis, demand segmentation, RevPAR forecasting, and emerging market trends — including early calls on extended stay demand driven by infrastructure spending and border city occupancy surges. These analyses were consumed by hotel brand executives, private equity firms, REIT investors, and developers making high-stakes investment and development decisions. Content is owned by CoStar Group. Link directs to my author profile on their platform.
1
99
1
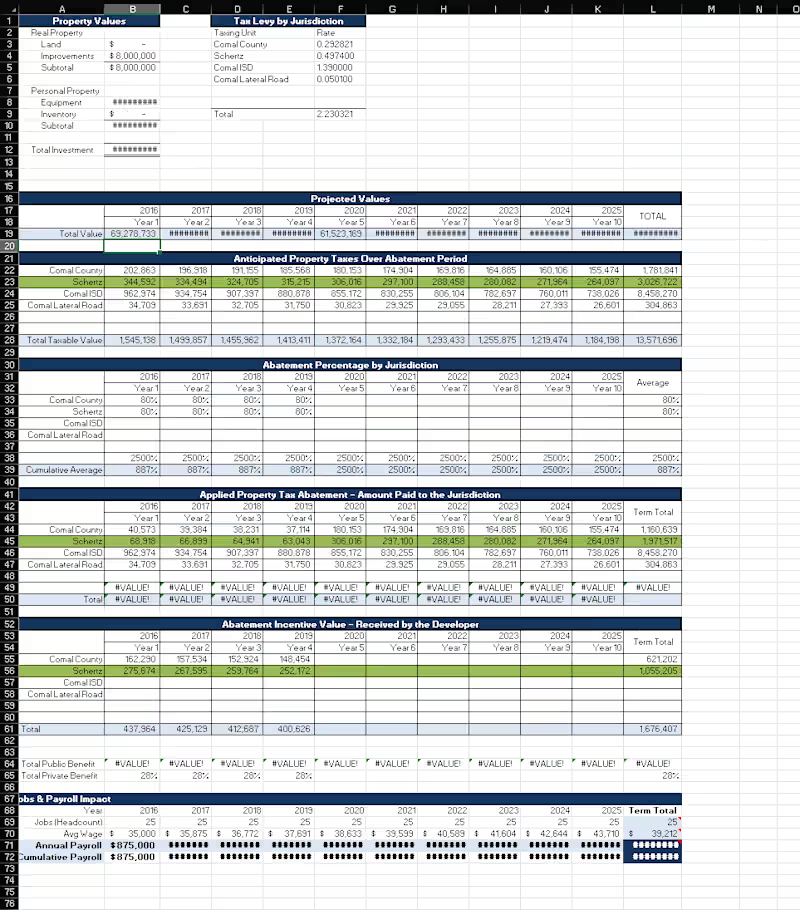
Built a reusable economic impact analysis model in Excel for evaluating business attraction, capital investment, and job creation scenarios for economic development clients. Model calculates direct, indirect, and induced impacts using multiplier methodology, and outputs board-ready summary tables for executive and city council presentations.
1
83
1
Delivered 60+ executive presentations annually at national hospitality industry conferences including the STR Data Conference, Hunter Hotel Conference, The Lodging Conference, Revonate Austin, and BTA New York. Also presented state-of-the-market briefings across major metros including Dallas, Austin, San Antonio, New Orleans, Nashville, Atlanta, and New York. Audiences included hotel brand executives, private equity firms, REIT investors, and developers making high-stakes investment decisions.
1
84
1
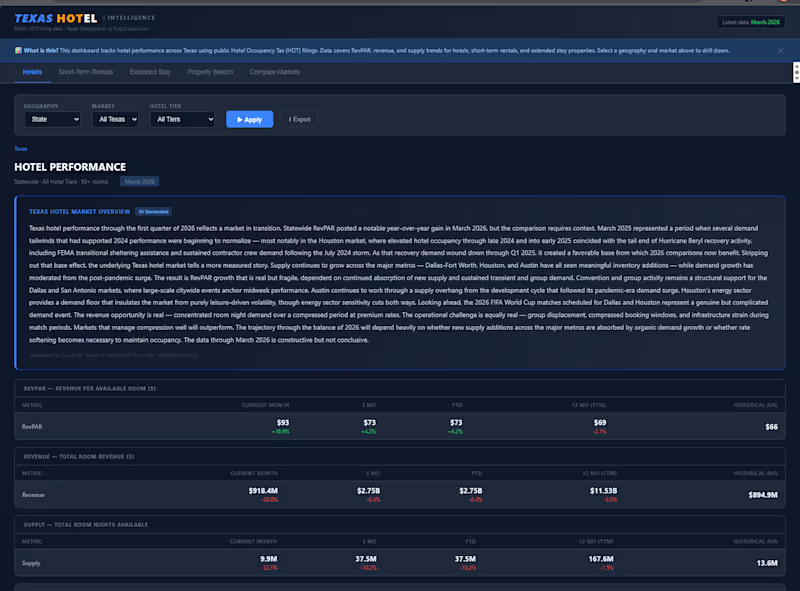
Built a free Texas Hotel Intelligence Dashboard from public HOT tax filings — covering 15 MSAs and 1,000+ cities with RevPAR, supply, and revenue trends. No STR subscription required. Built independently in Python, hosted on Render. This is the kind of AI-augmented research workflow I build for CRE and EDC teams.
1
92
QGIS
(1)
Follow
Message
Hacina Djaafri
France
UX/UI designer, translator, architectural renderer
5.0
Rating
5
Followers
Follow
Message
UX/UI designer, translator, architectural renderer
0
Render for a rehabilitation project in the seaside-city of Royan
0
26
0
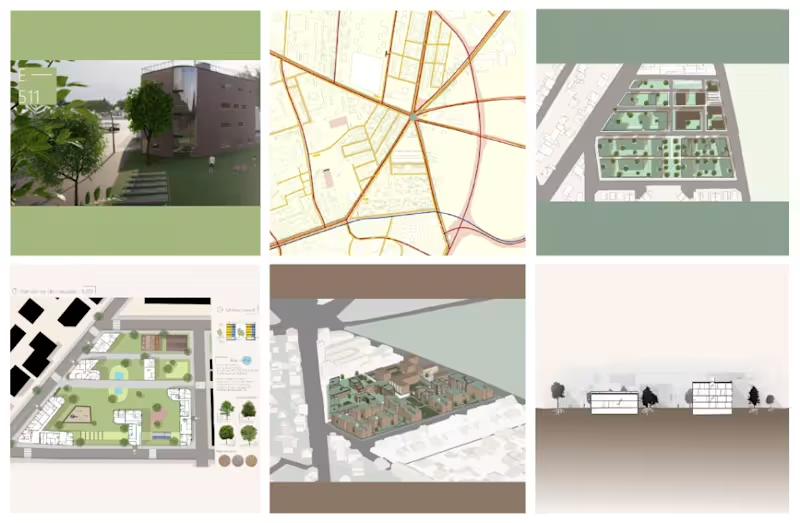
Renders for an urbanism project
0
29
0
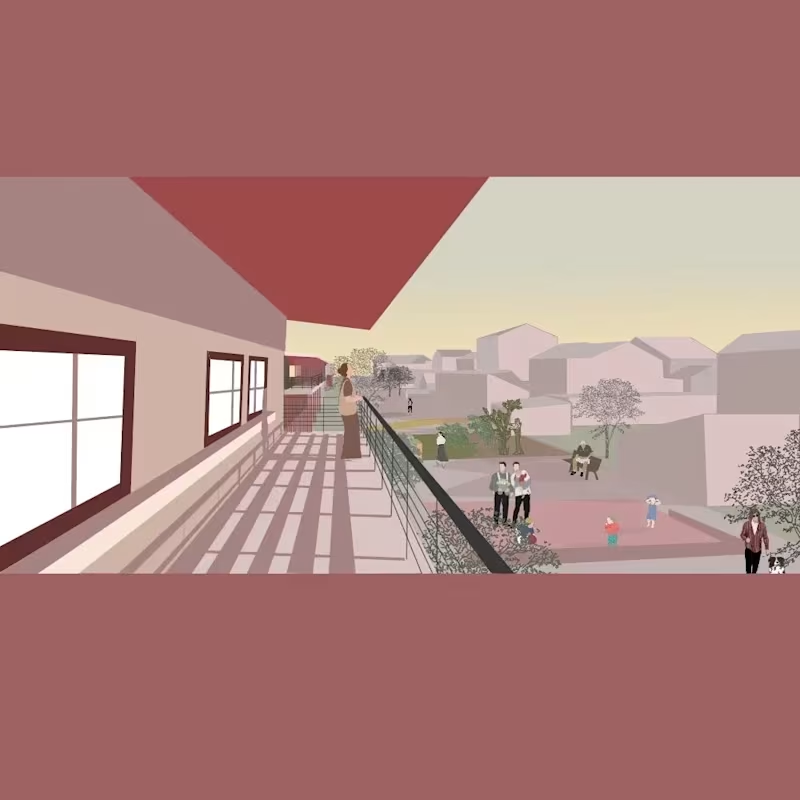
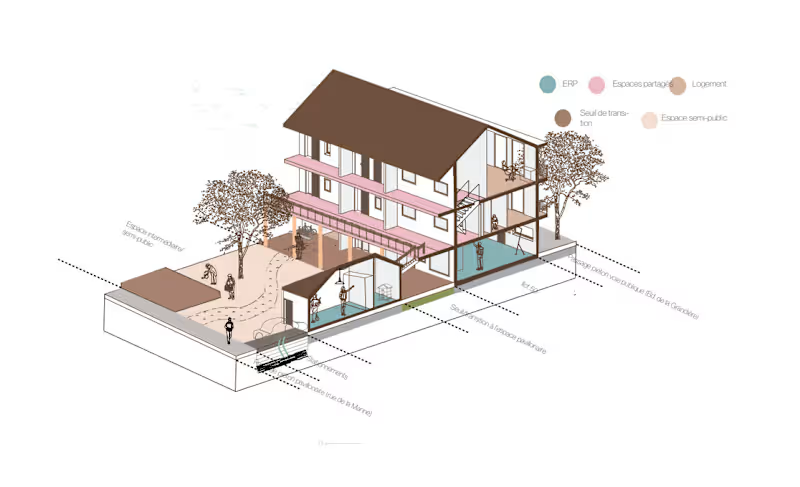
Architectural renders of a sustainable housing complex in France
0
50
2
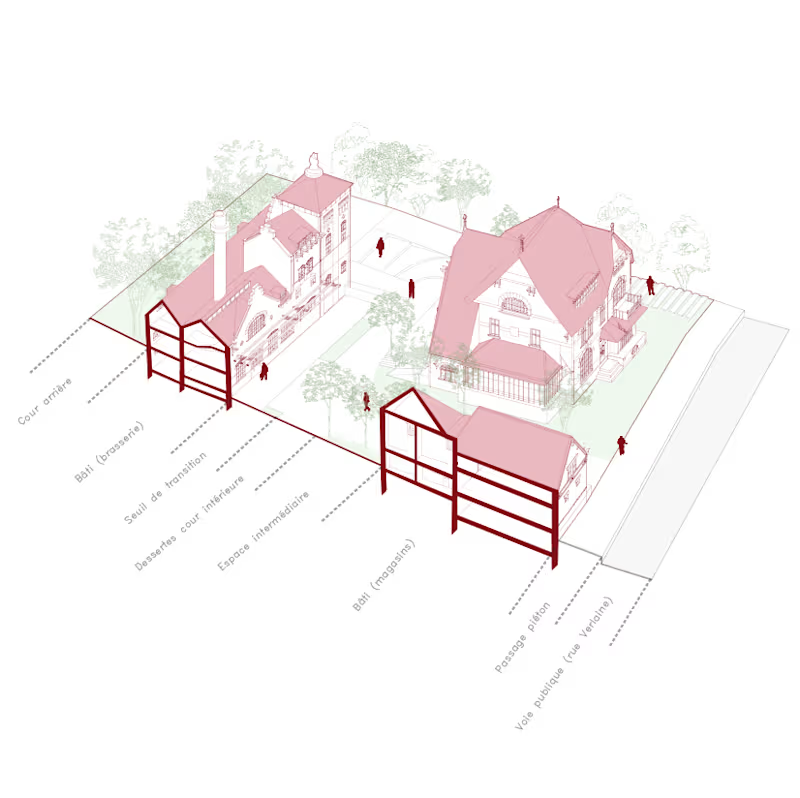
Brewery rehabilitation project in rural Fampoux (France)
2
87
QGIS
(3)
Follow
Message
Explore people