
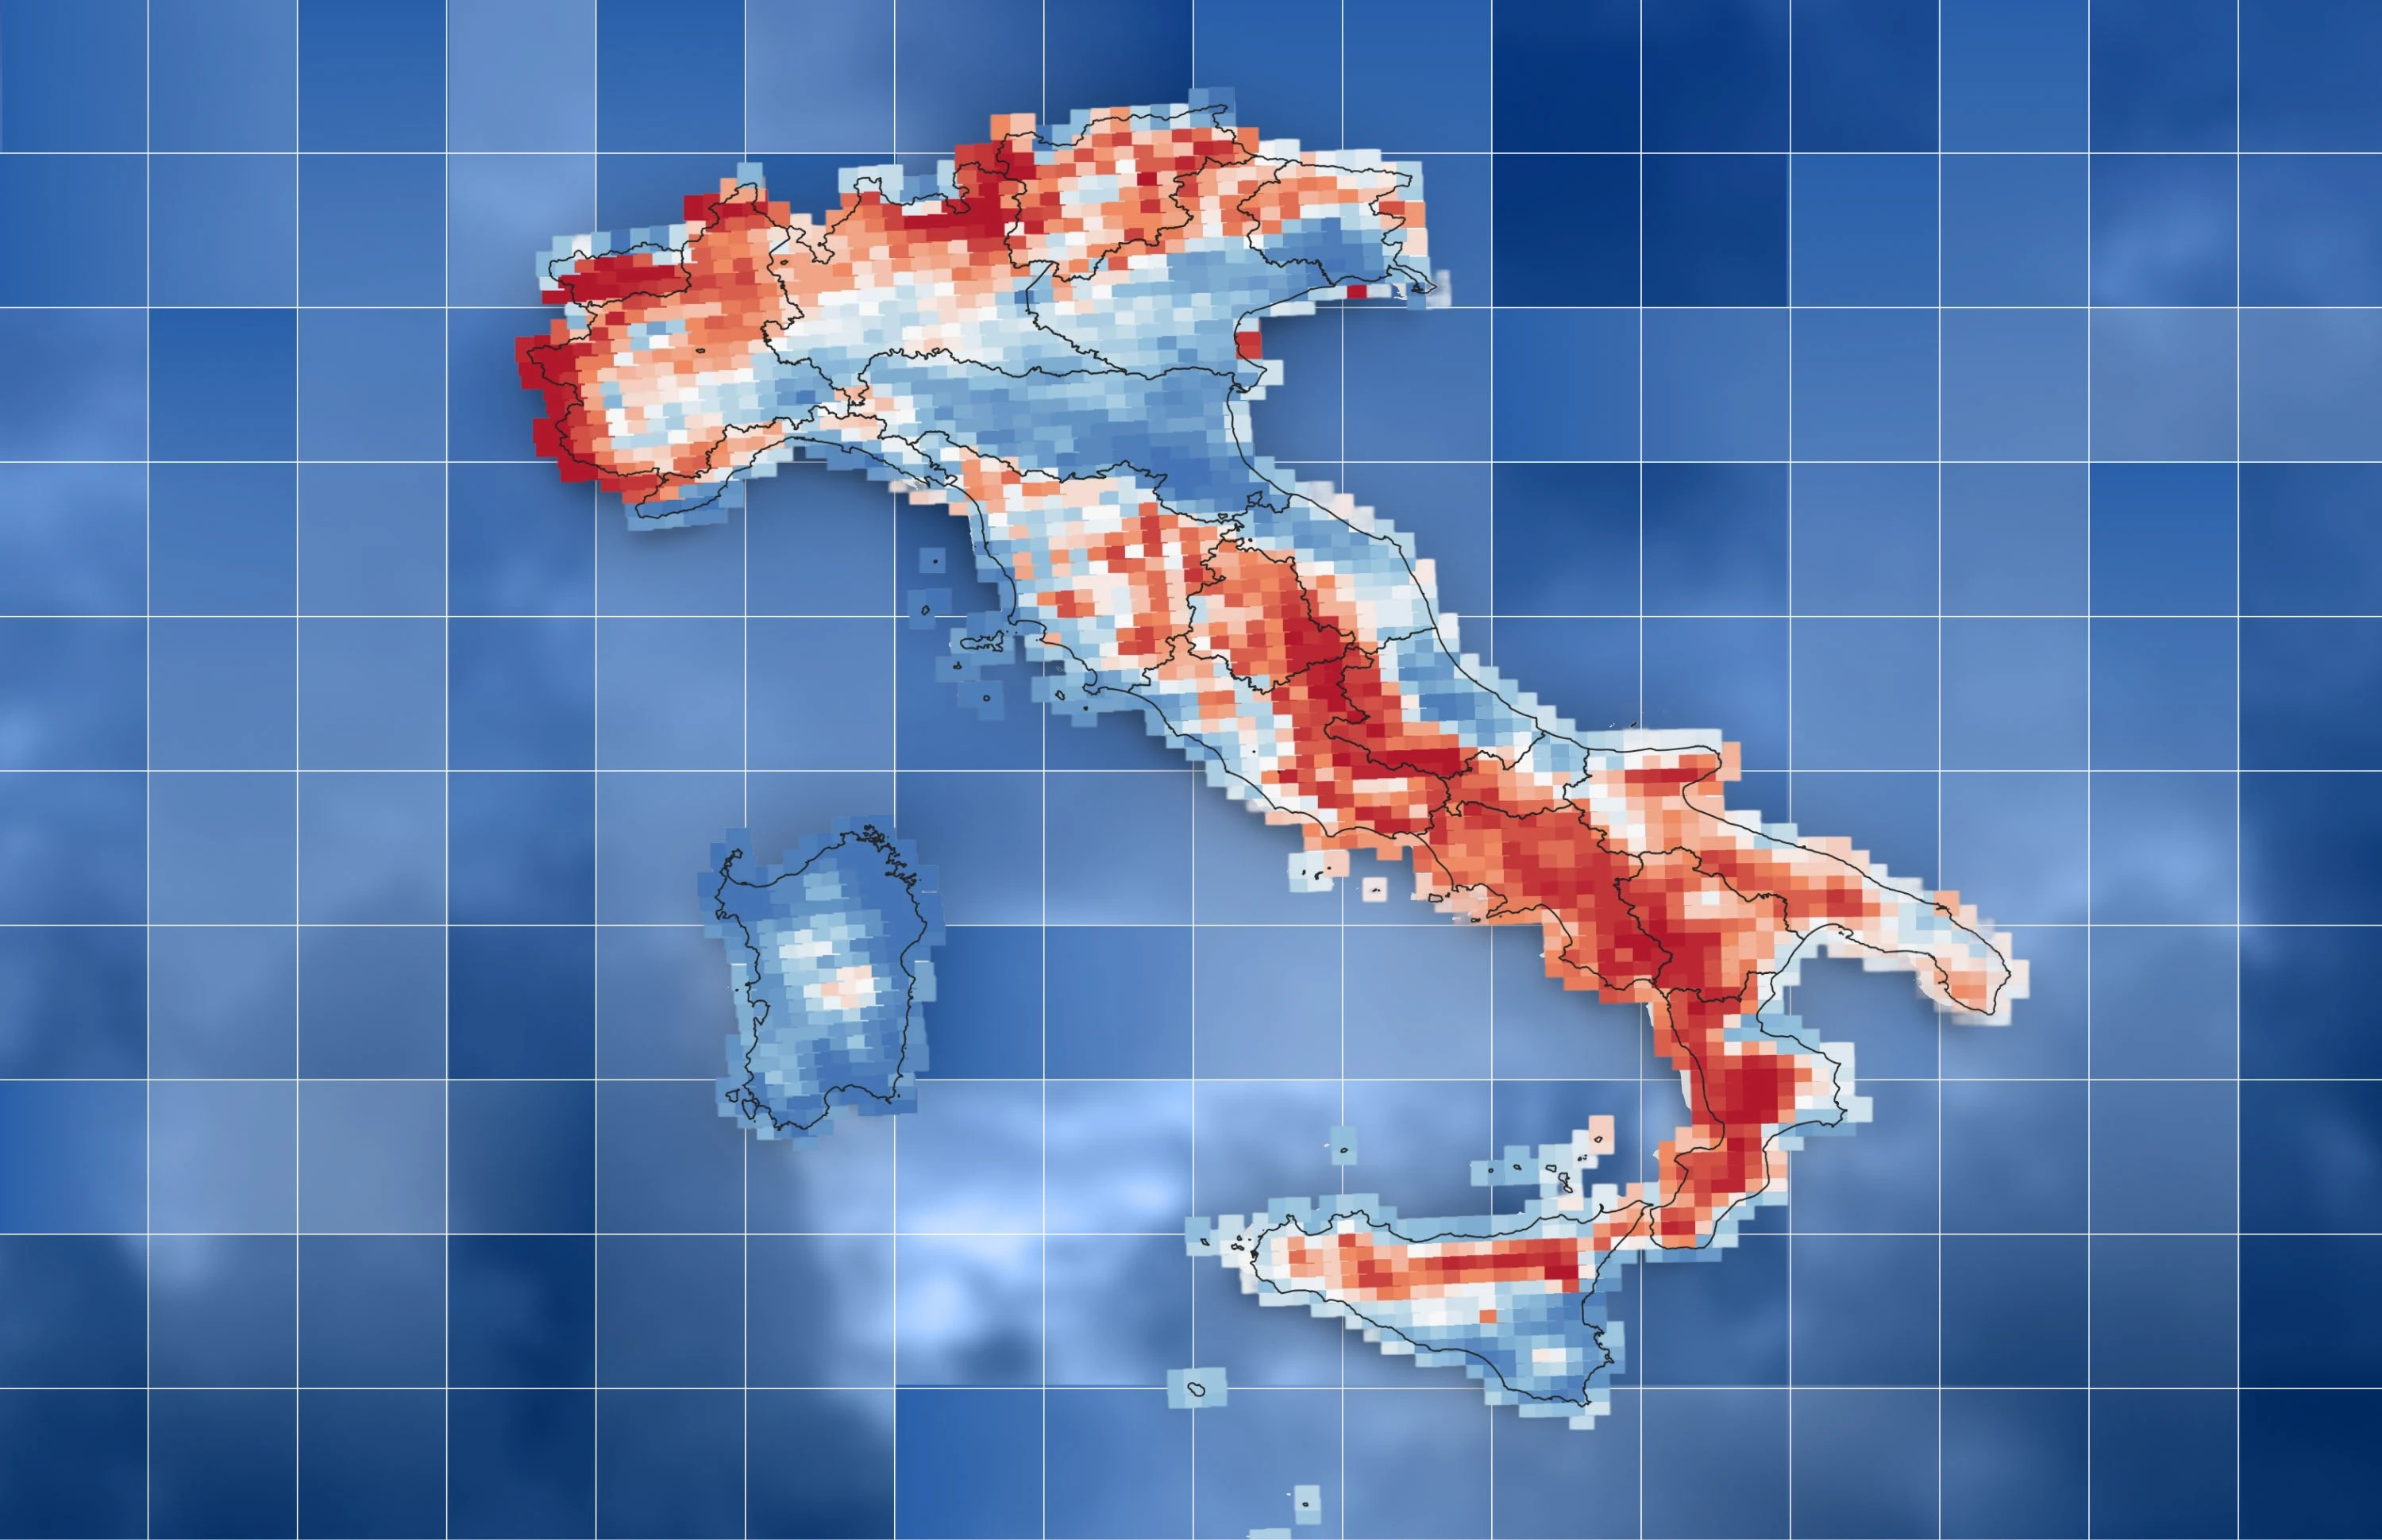
Dataclime
Dataclime is an advanced climate forecast data platform that translates complex weather predictions into actionable insights. The platform provides comprehensive climate risk analysis, hazard assessments, and adaptation strategy recommendations.
Developed by the Regional Models and Geo-Hydrological Impacts Division (REMHI) of the Institute for Climate Resilience (ICR) at the CMCC Foundation (Euro-Mediterranean Center on Climate Change), Dataclime has been operational since 2018. In 2024, I redesigned the platform, enhancing the user interface, improving map visualizations, and optimizing the overall user experience. Following these improvements, Dataclime now offers a suite of new services and features.
Dataclime is accessible previous registration here ↗.
Homepage
Homepage mobile
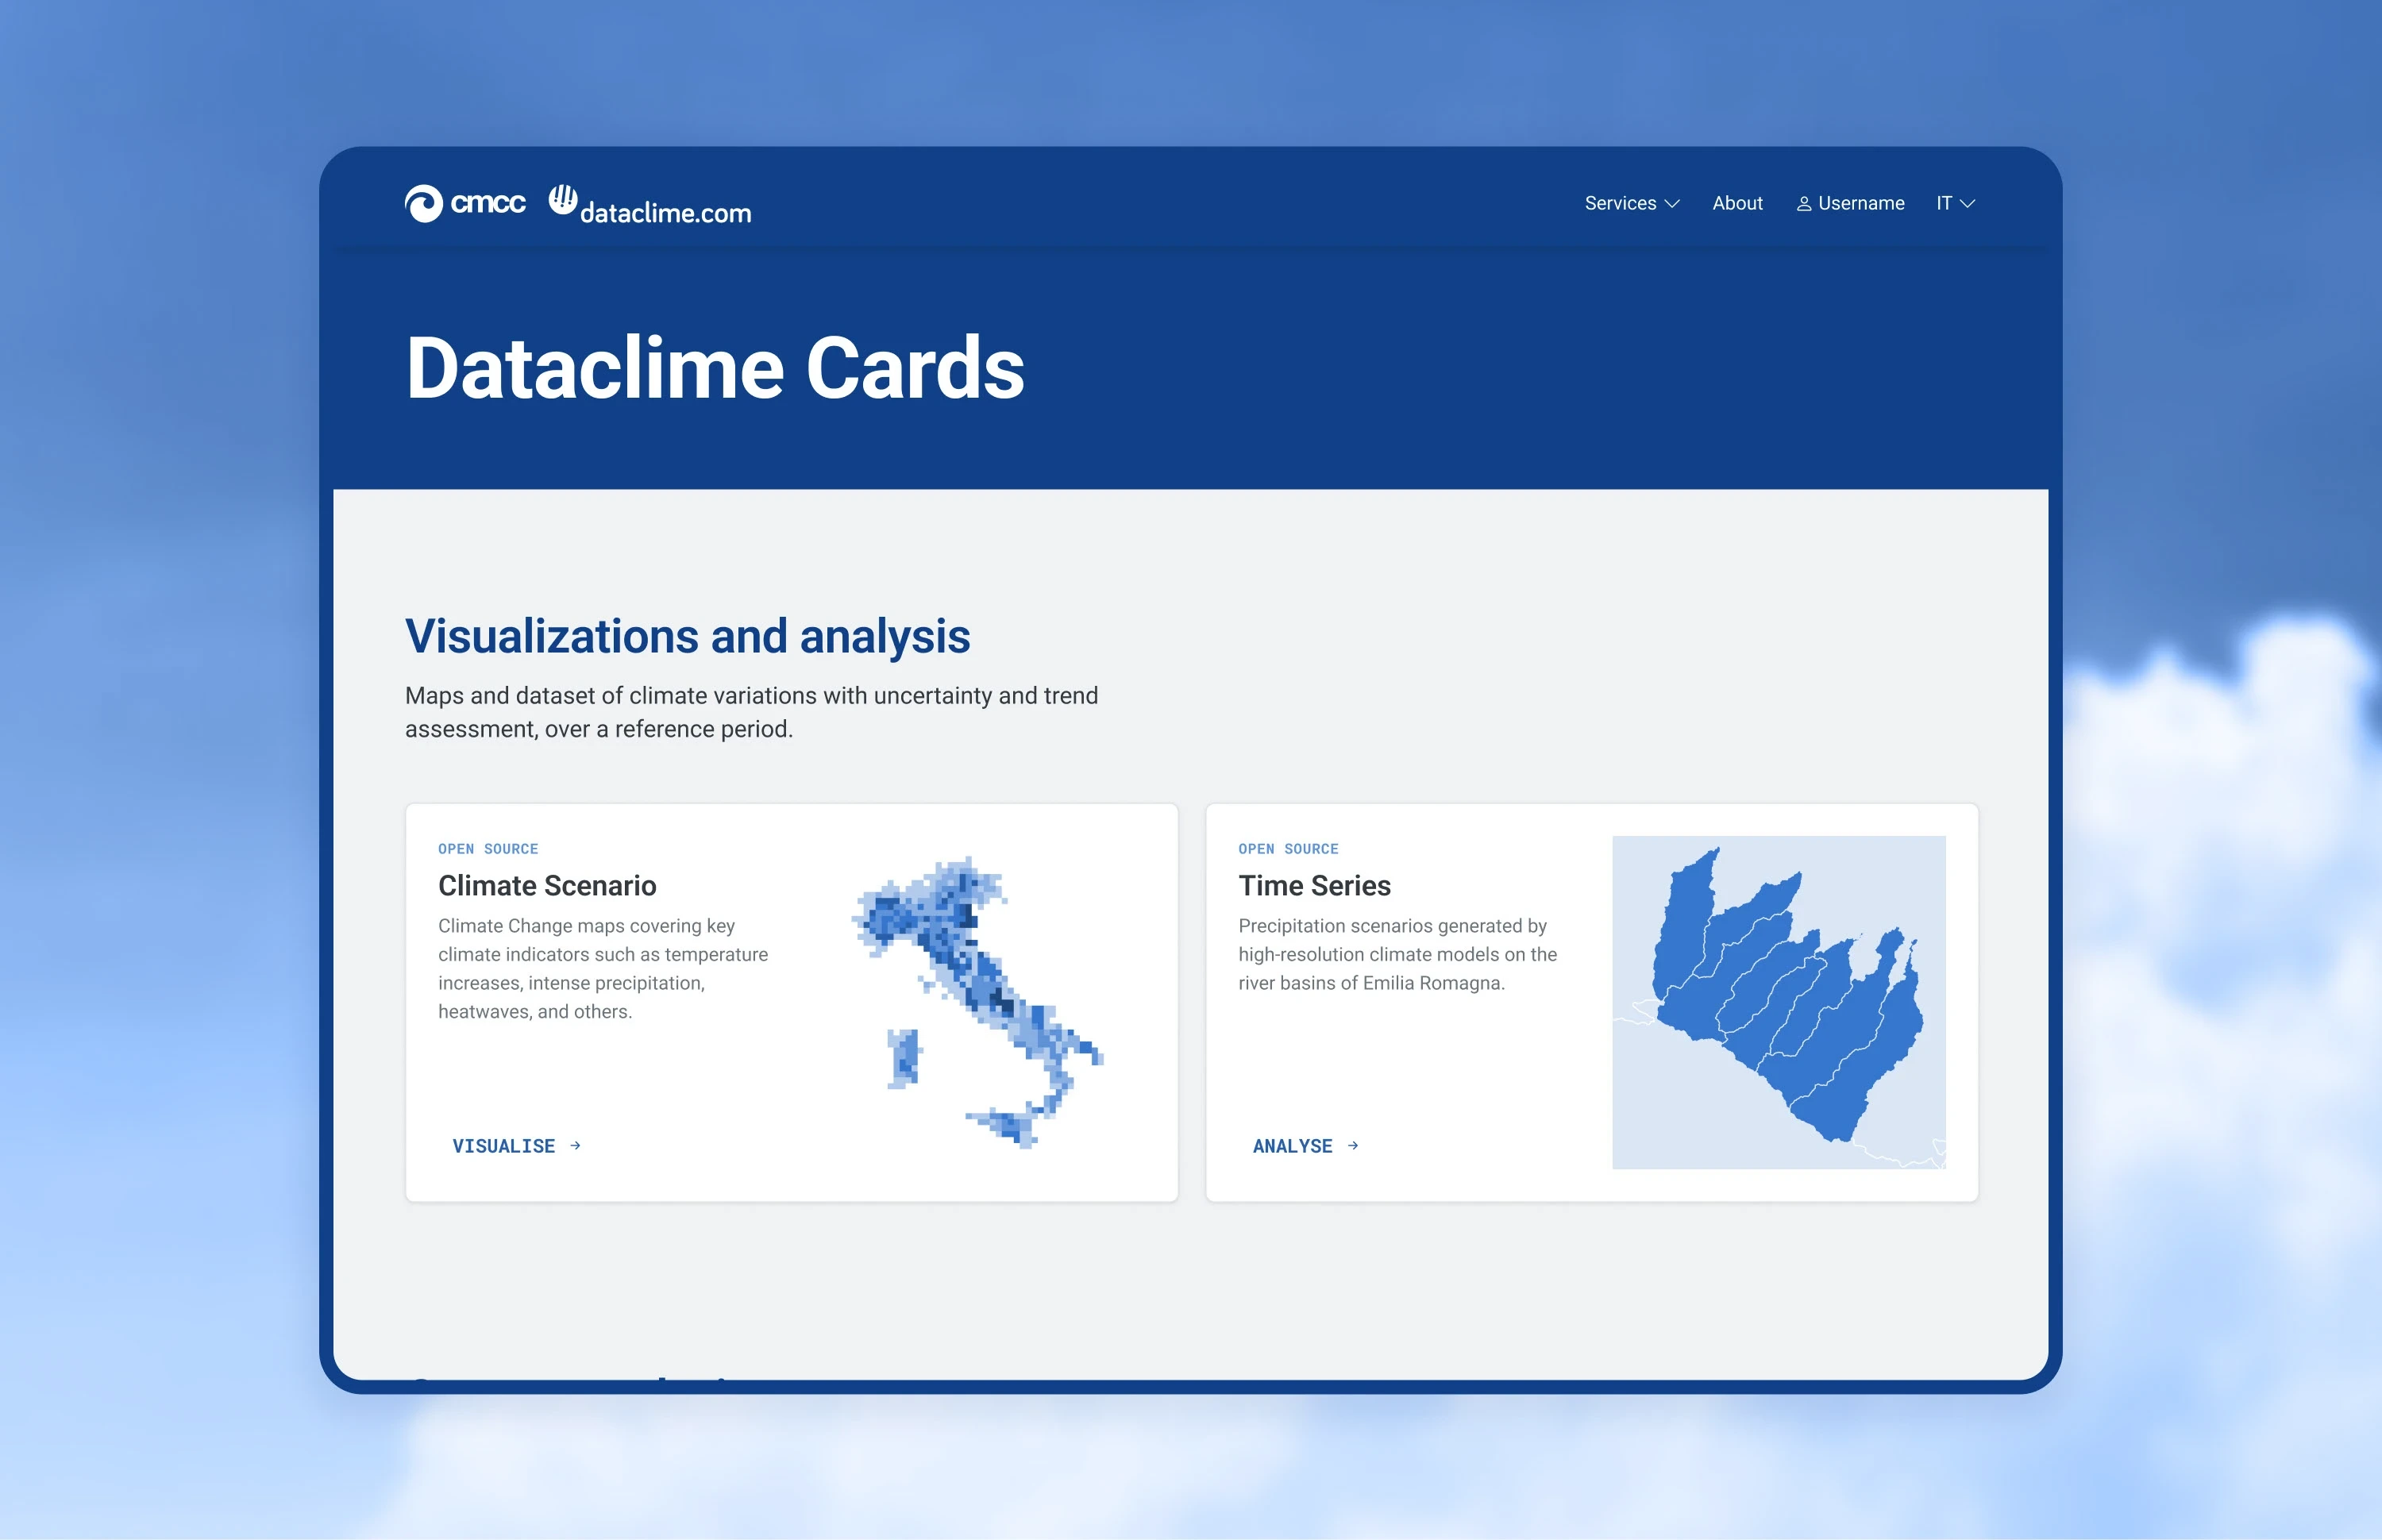
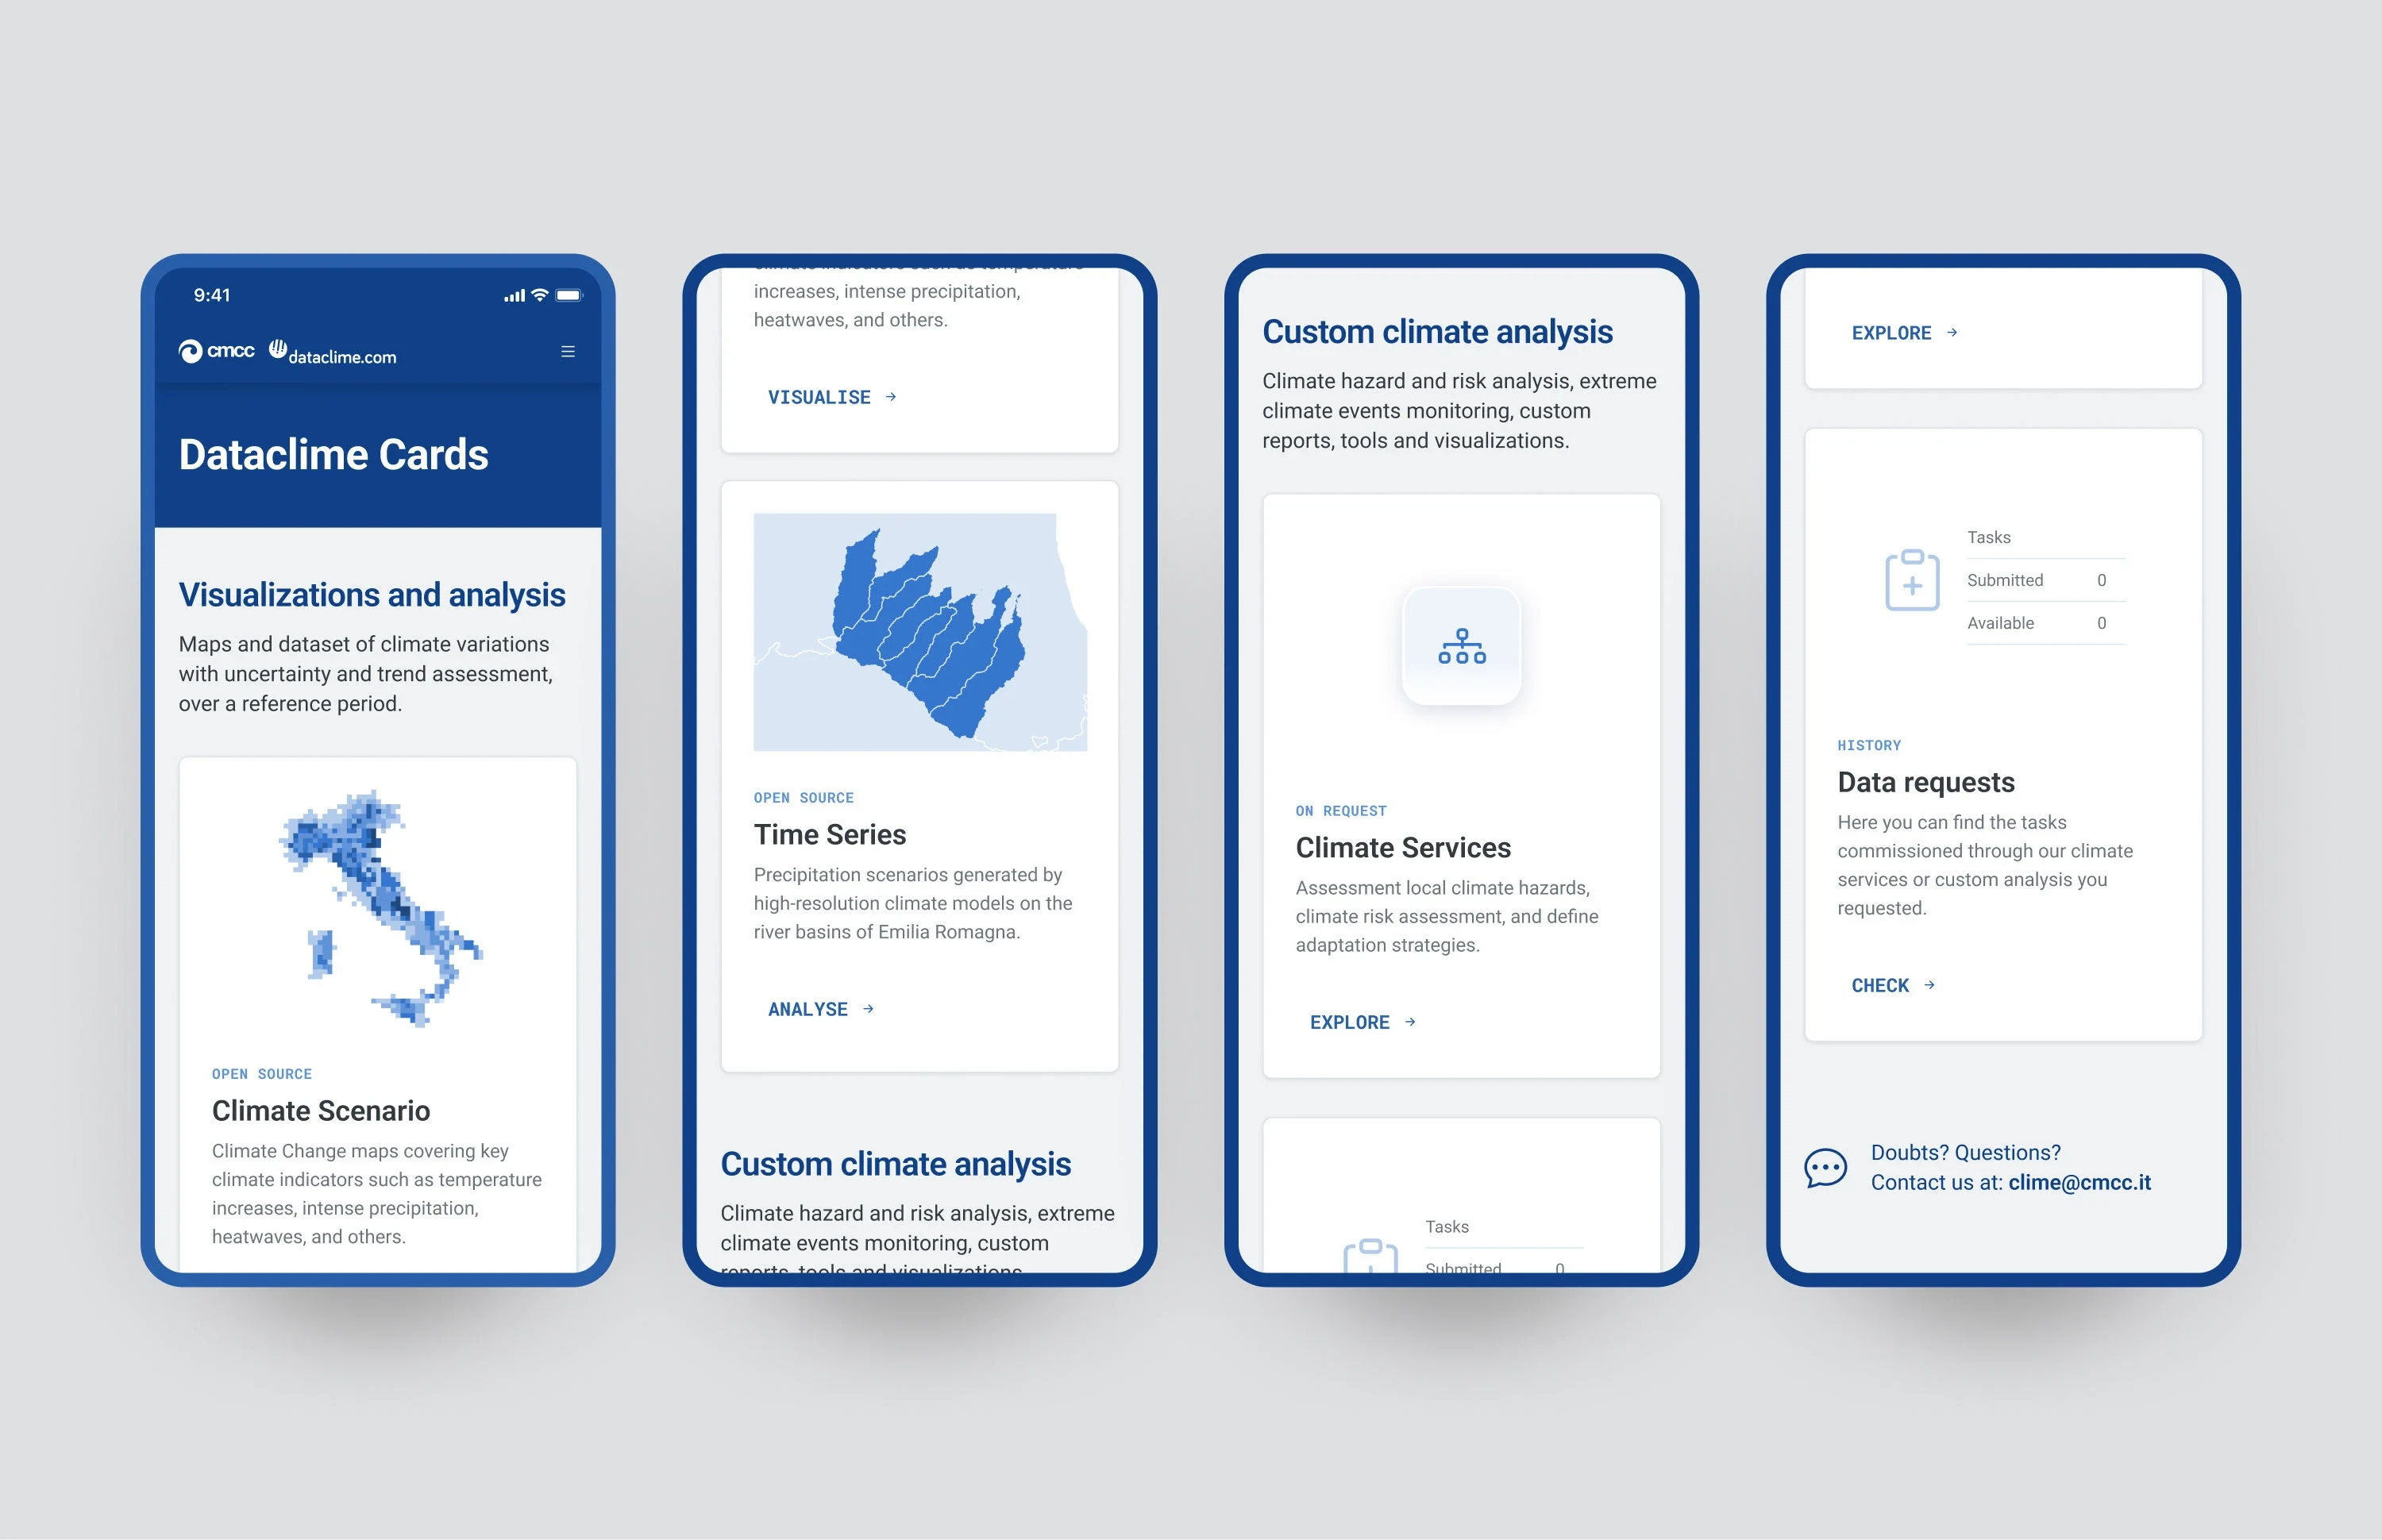
The Dataclime homepage showcases the full range of services available, from free resources to customized climate analyses. Users can explore how the platform combines multiple data models and future scenarios to deliver weather forecasts for the next decades.
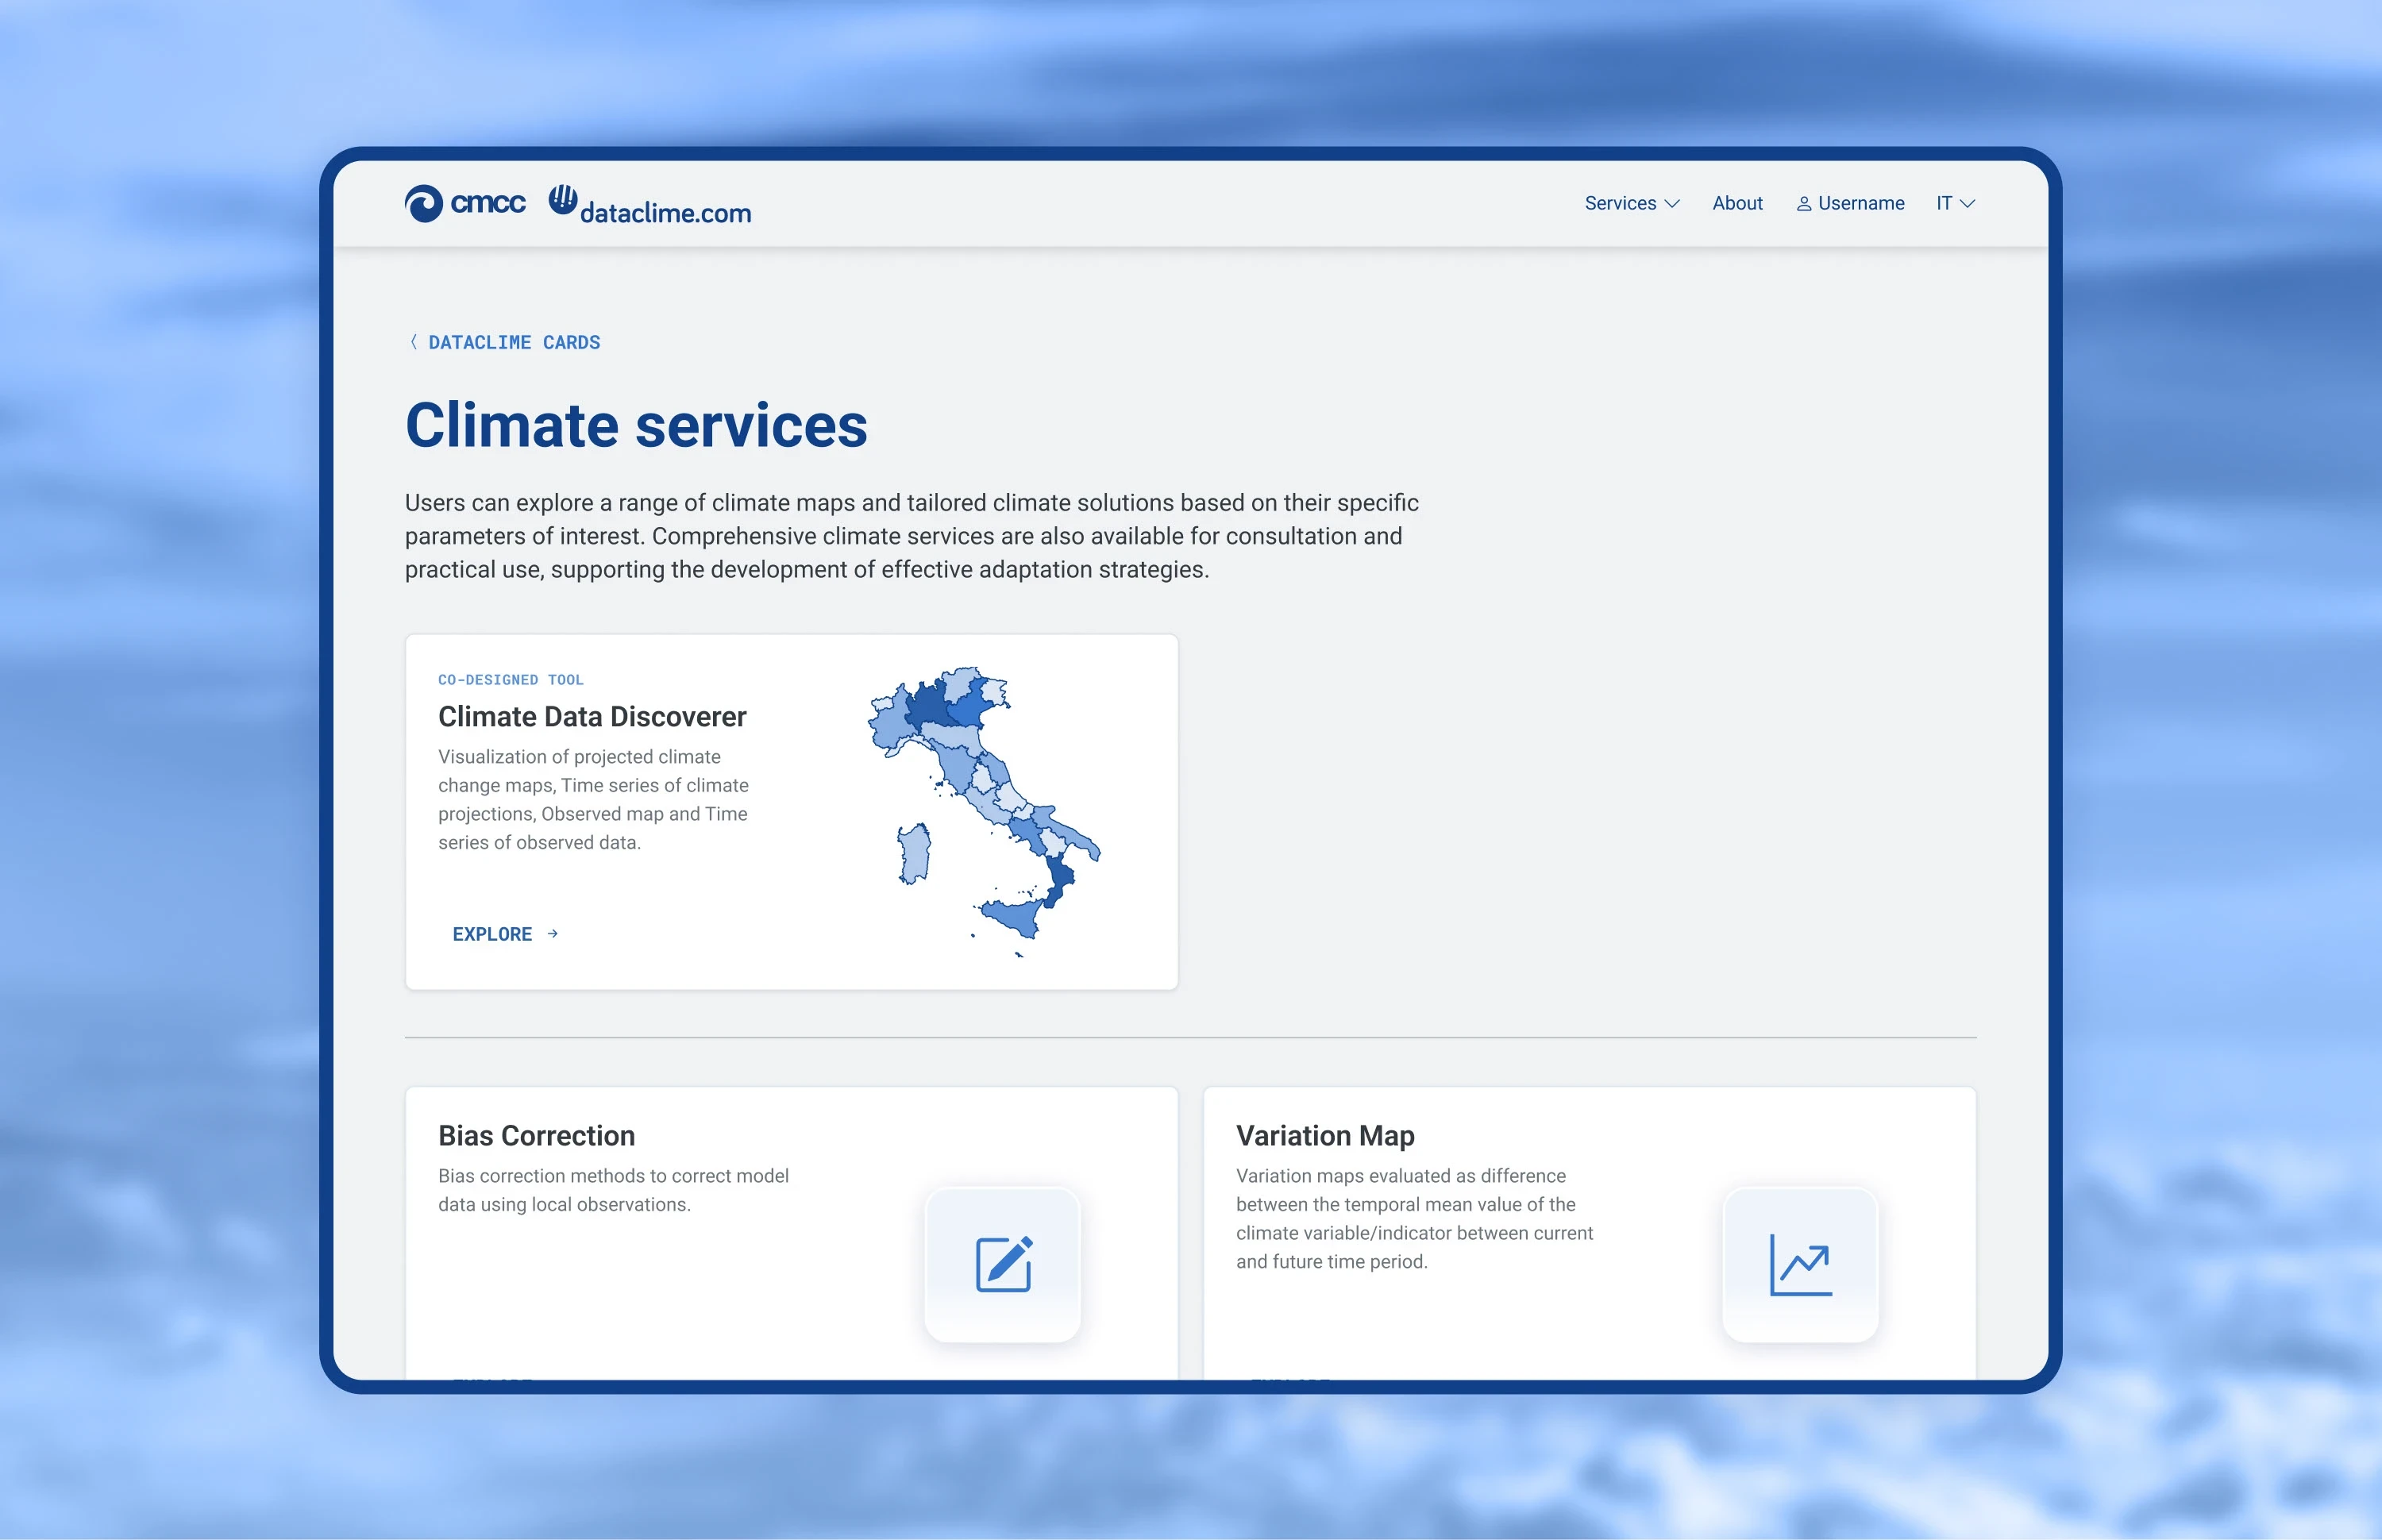
On the Climate Services page, users can deepen their understanding of risk and environmental analysis by exploring bespoke tools developed for previous clients. If a particular result or service sparks their interest, users can submit a request. The CMCC team will promptly follow up to address their needs and provide tailored solutions.
Service page
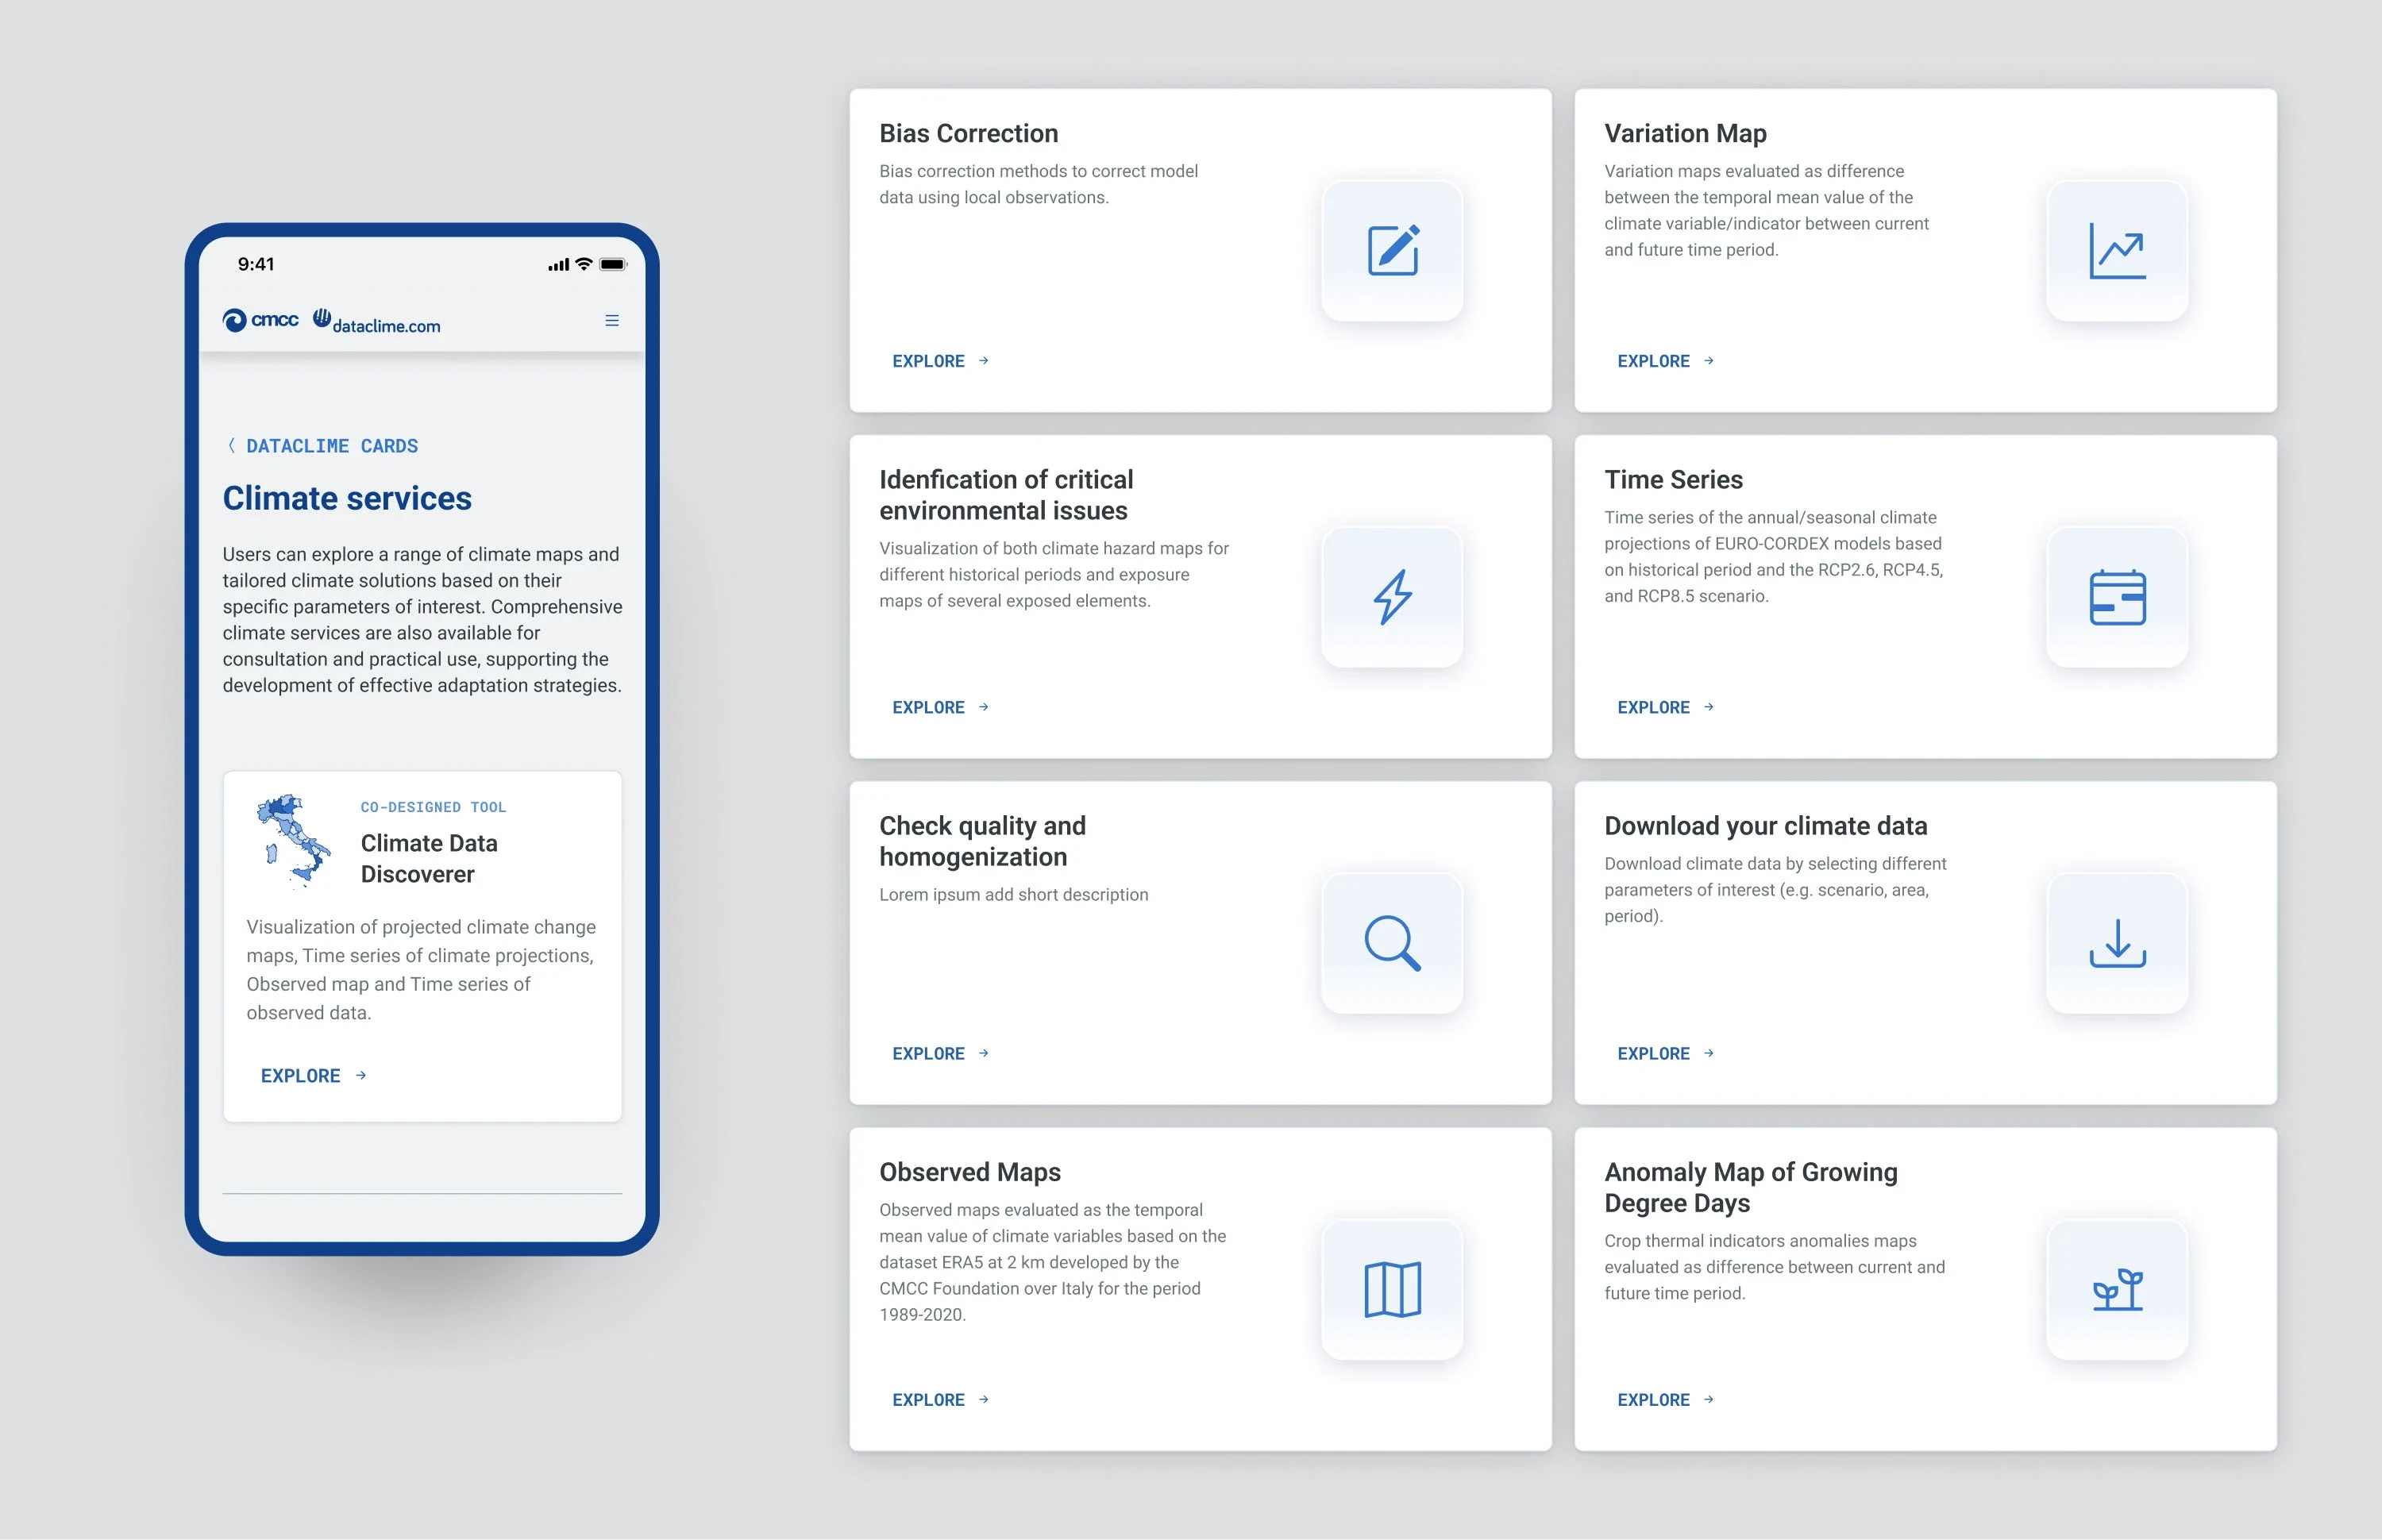
An example of the service component
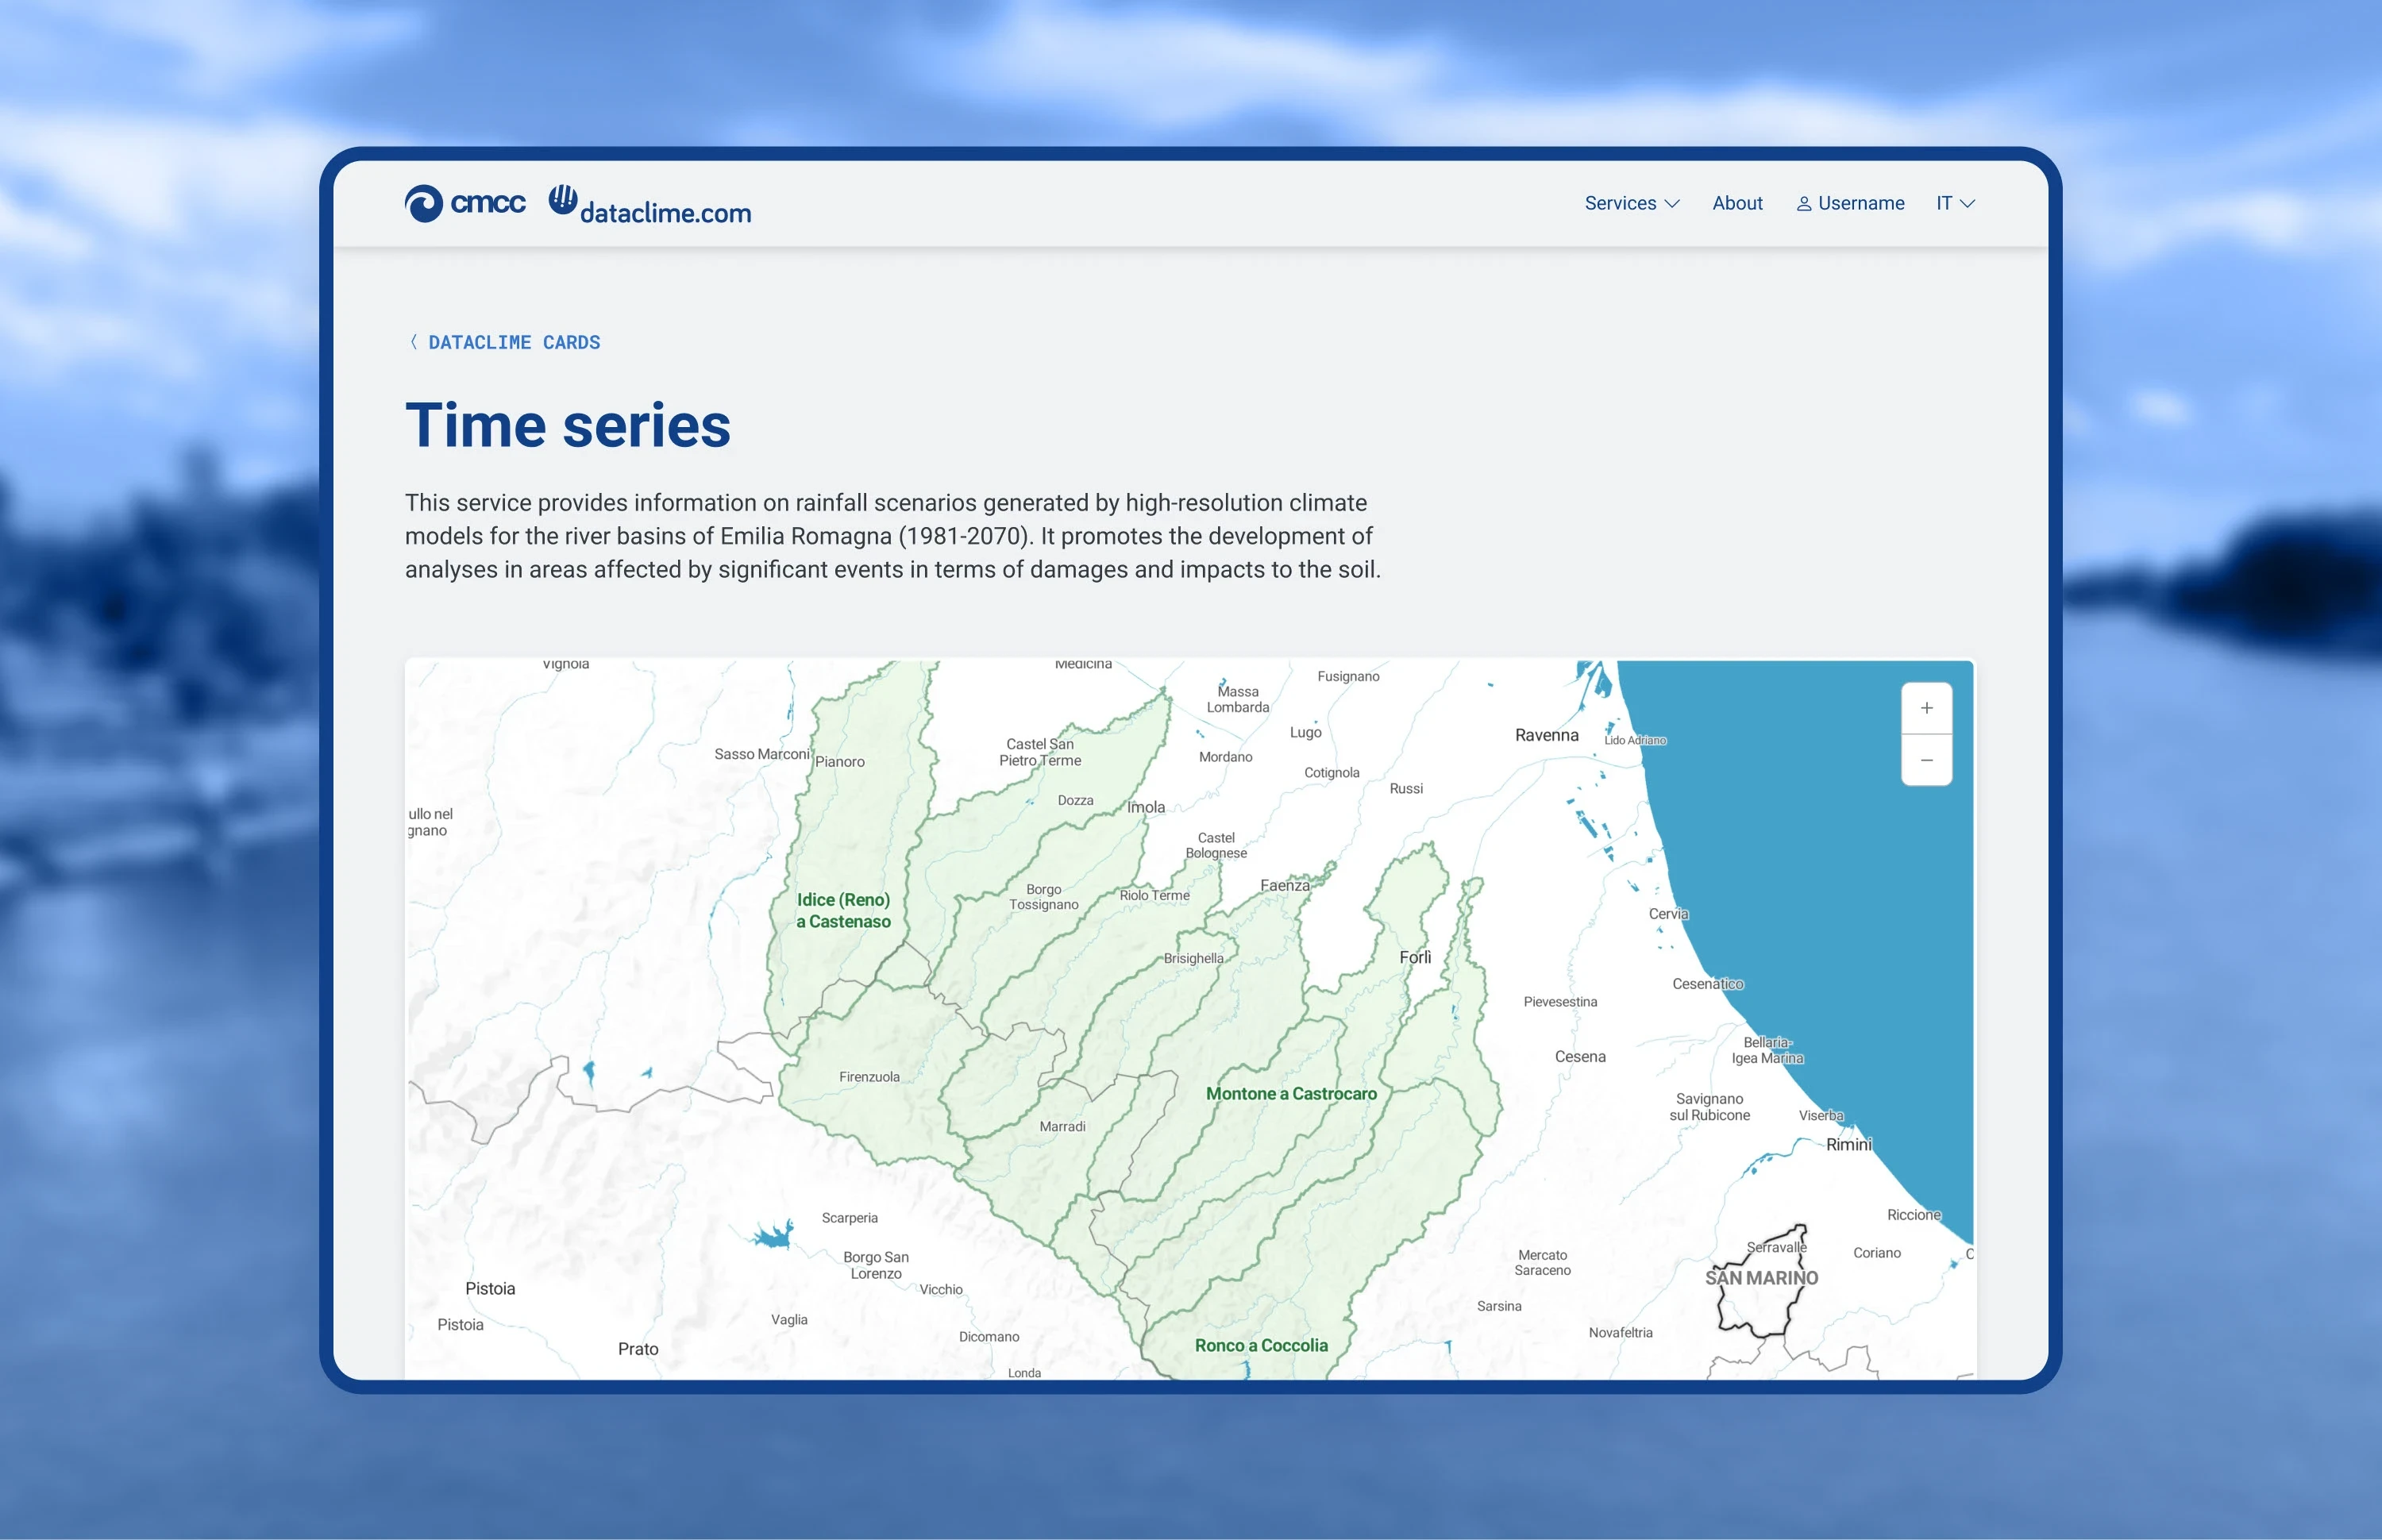
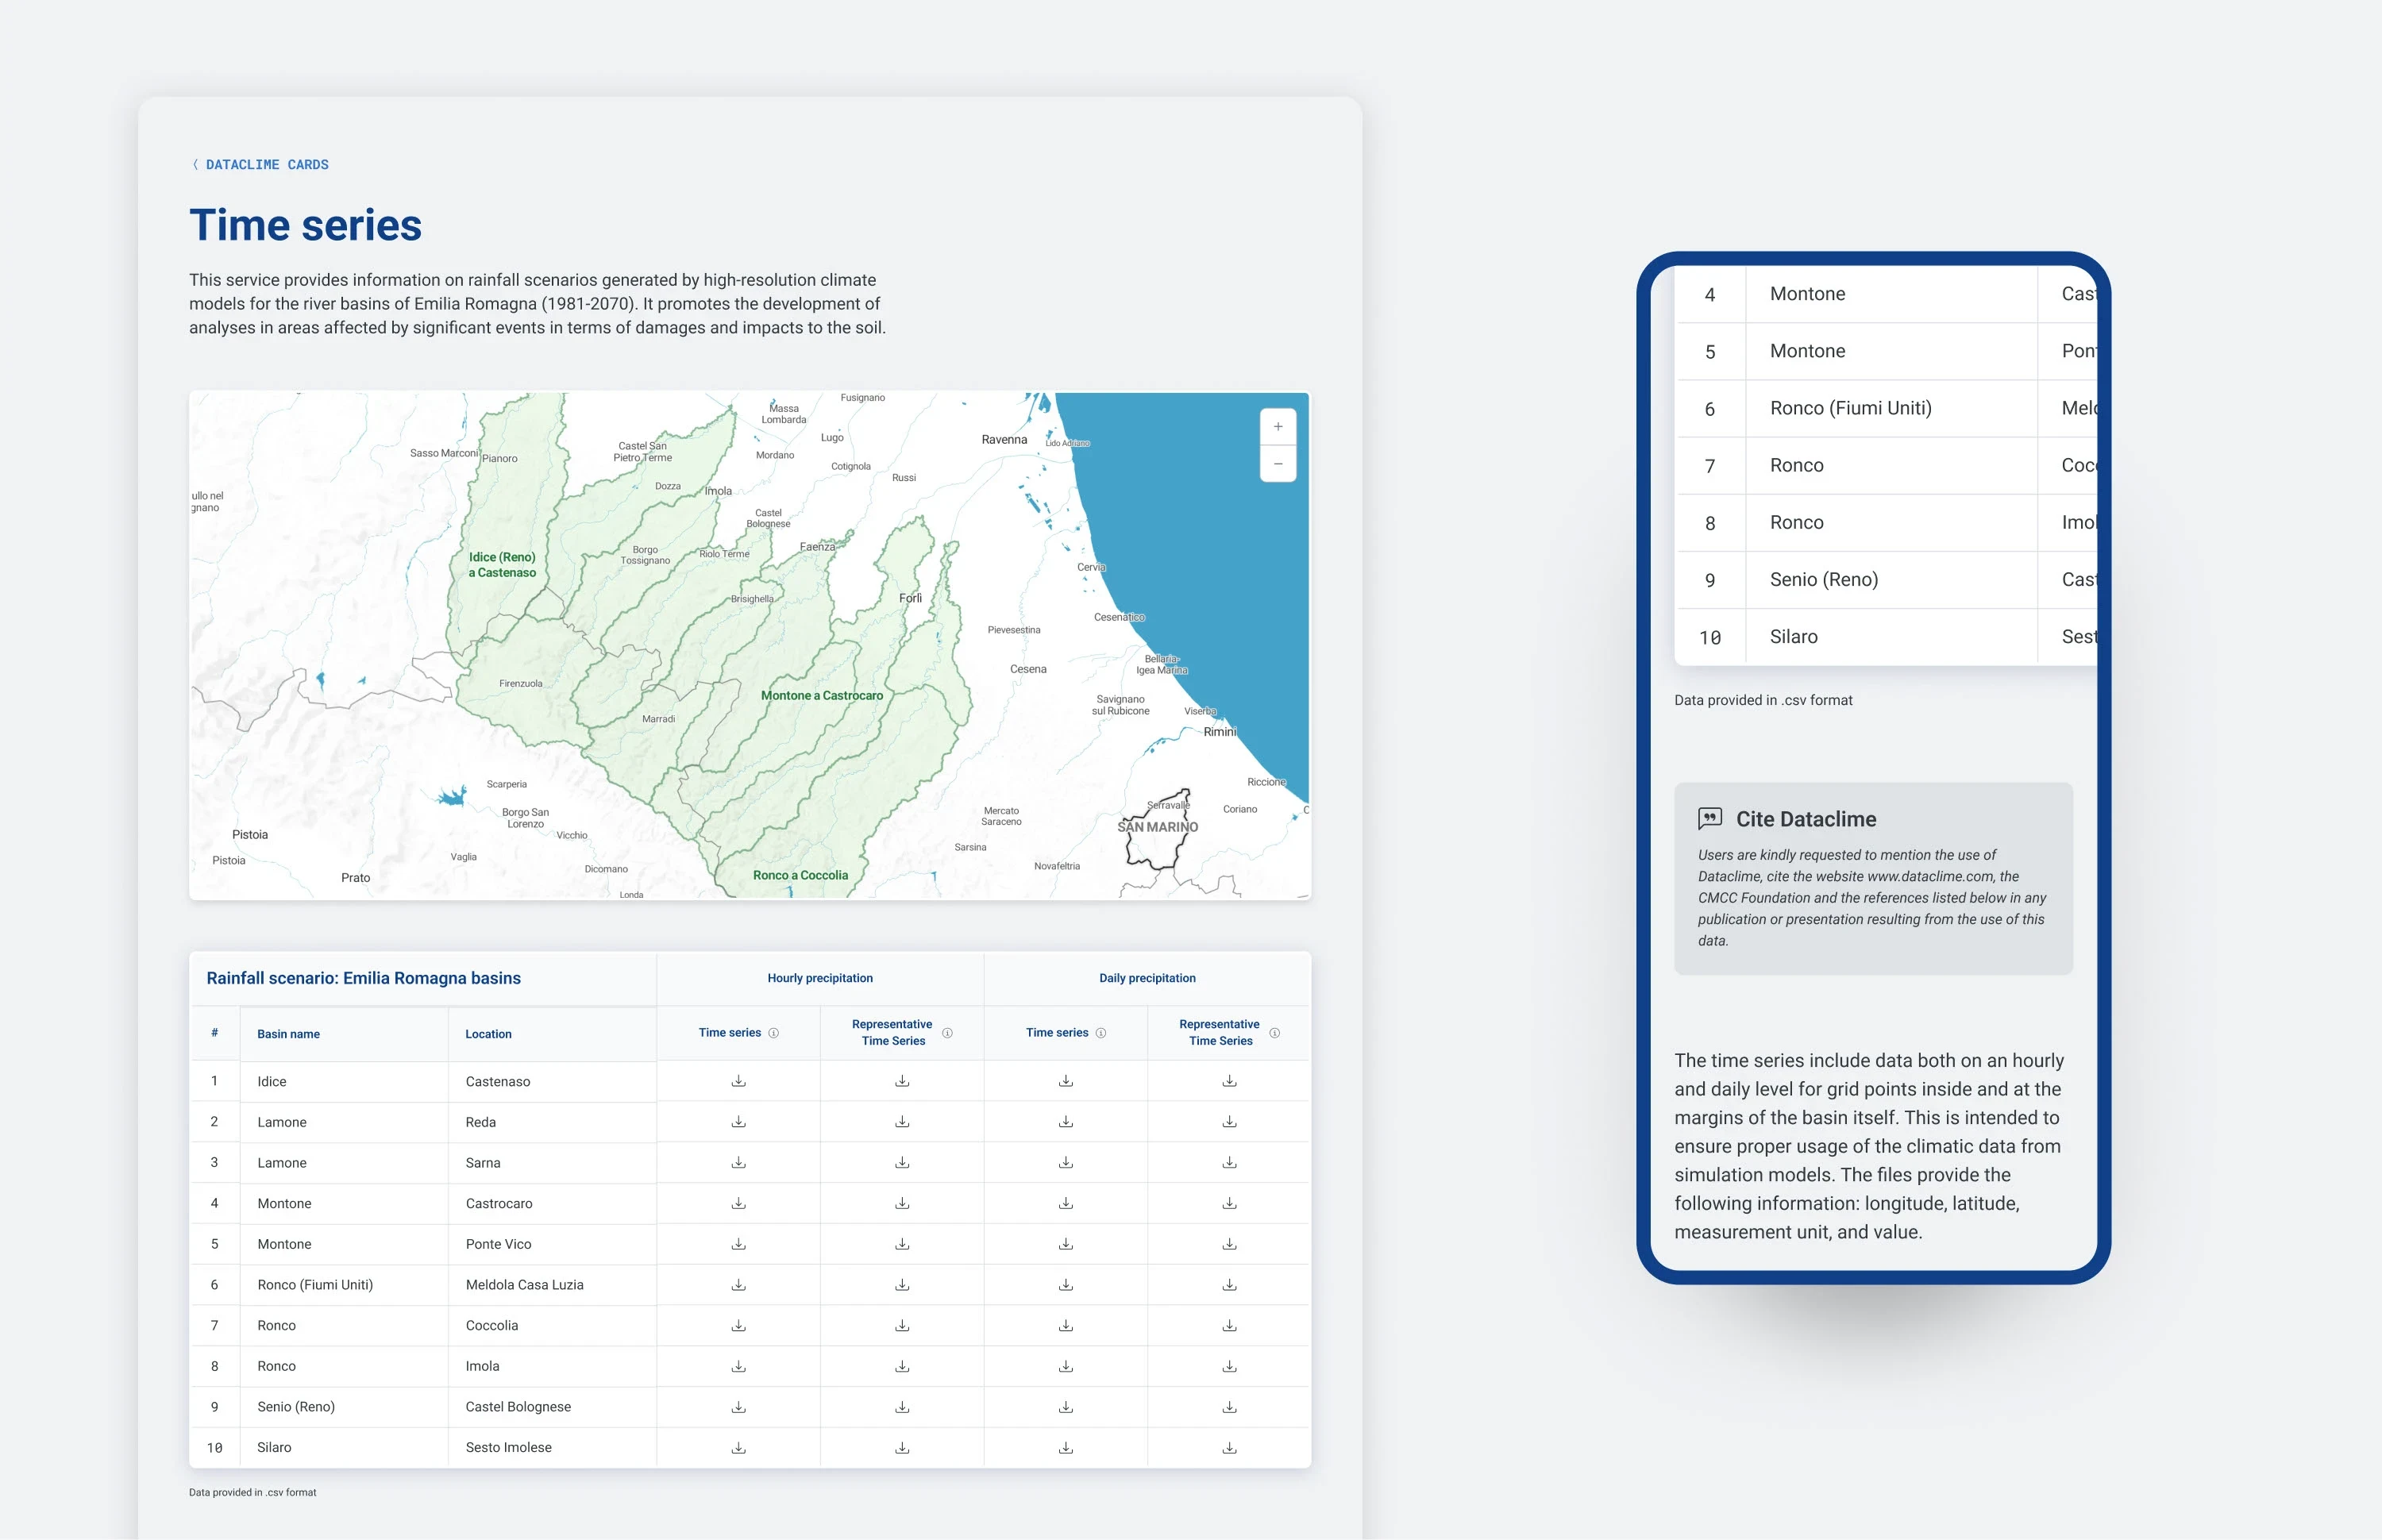
Time series service
The Time Series service delivers rainfall scenario information for the river basins of Emilia-Romagna, covering the period from 1981 to 2070. Leveraging high-resolution climate models, it enables in-depth analysis of areas impacted by significant weather events and soil damage. The data are generated using simulation models at both hourly and daily resolutions.
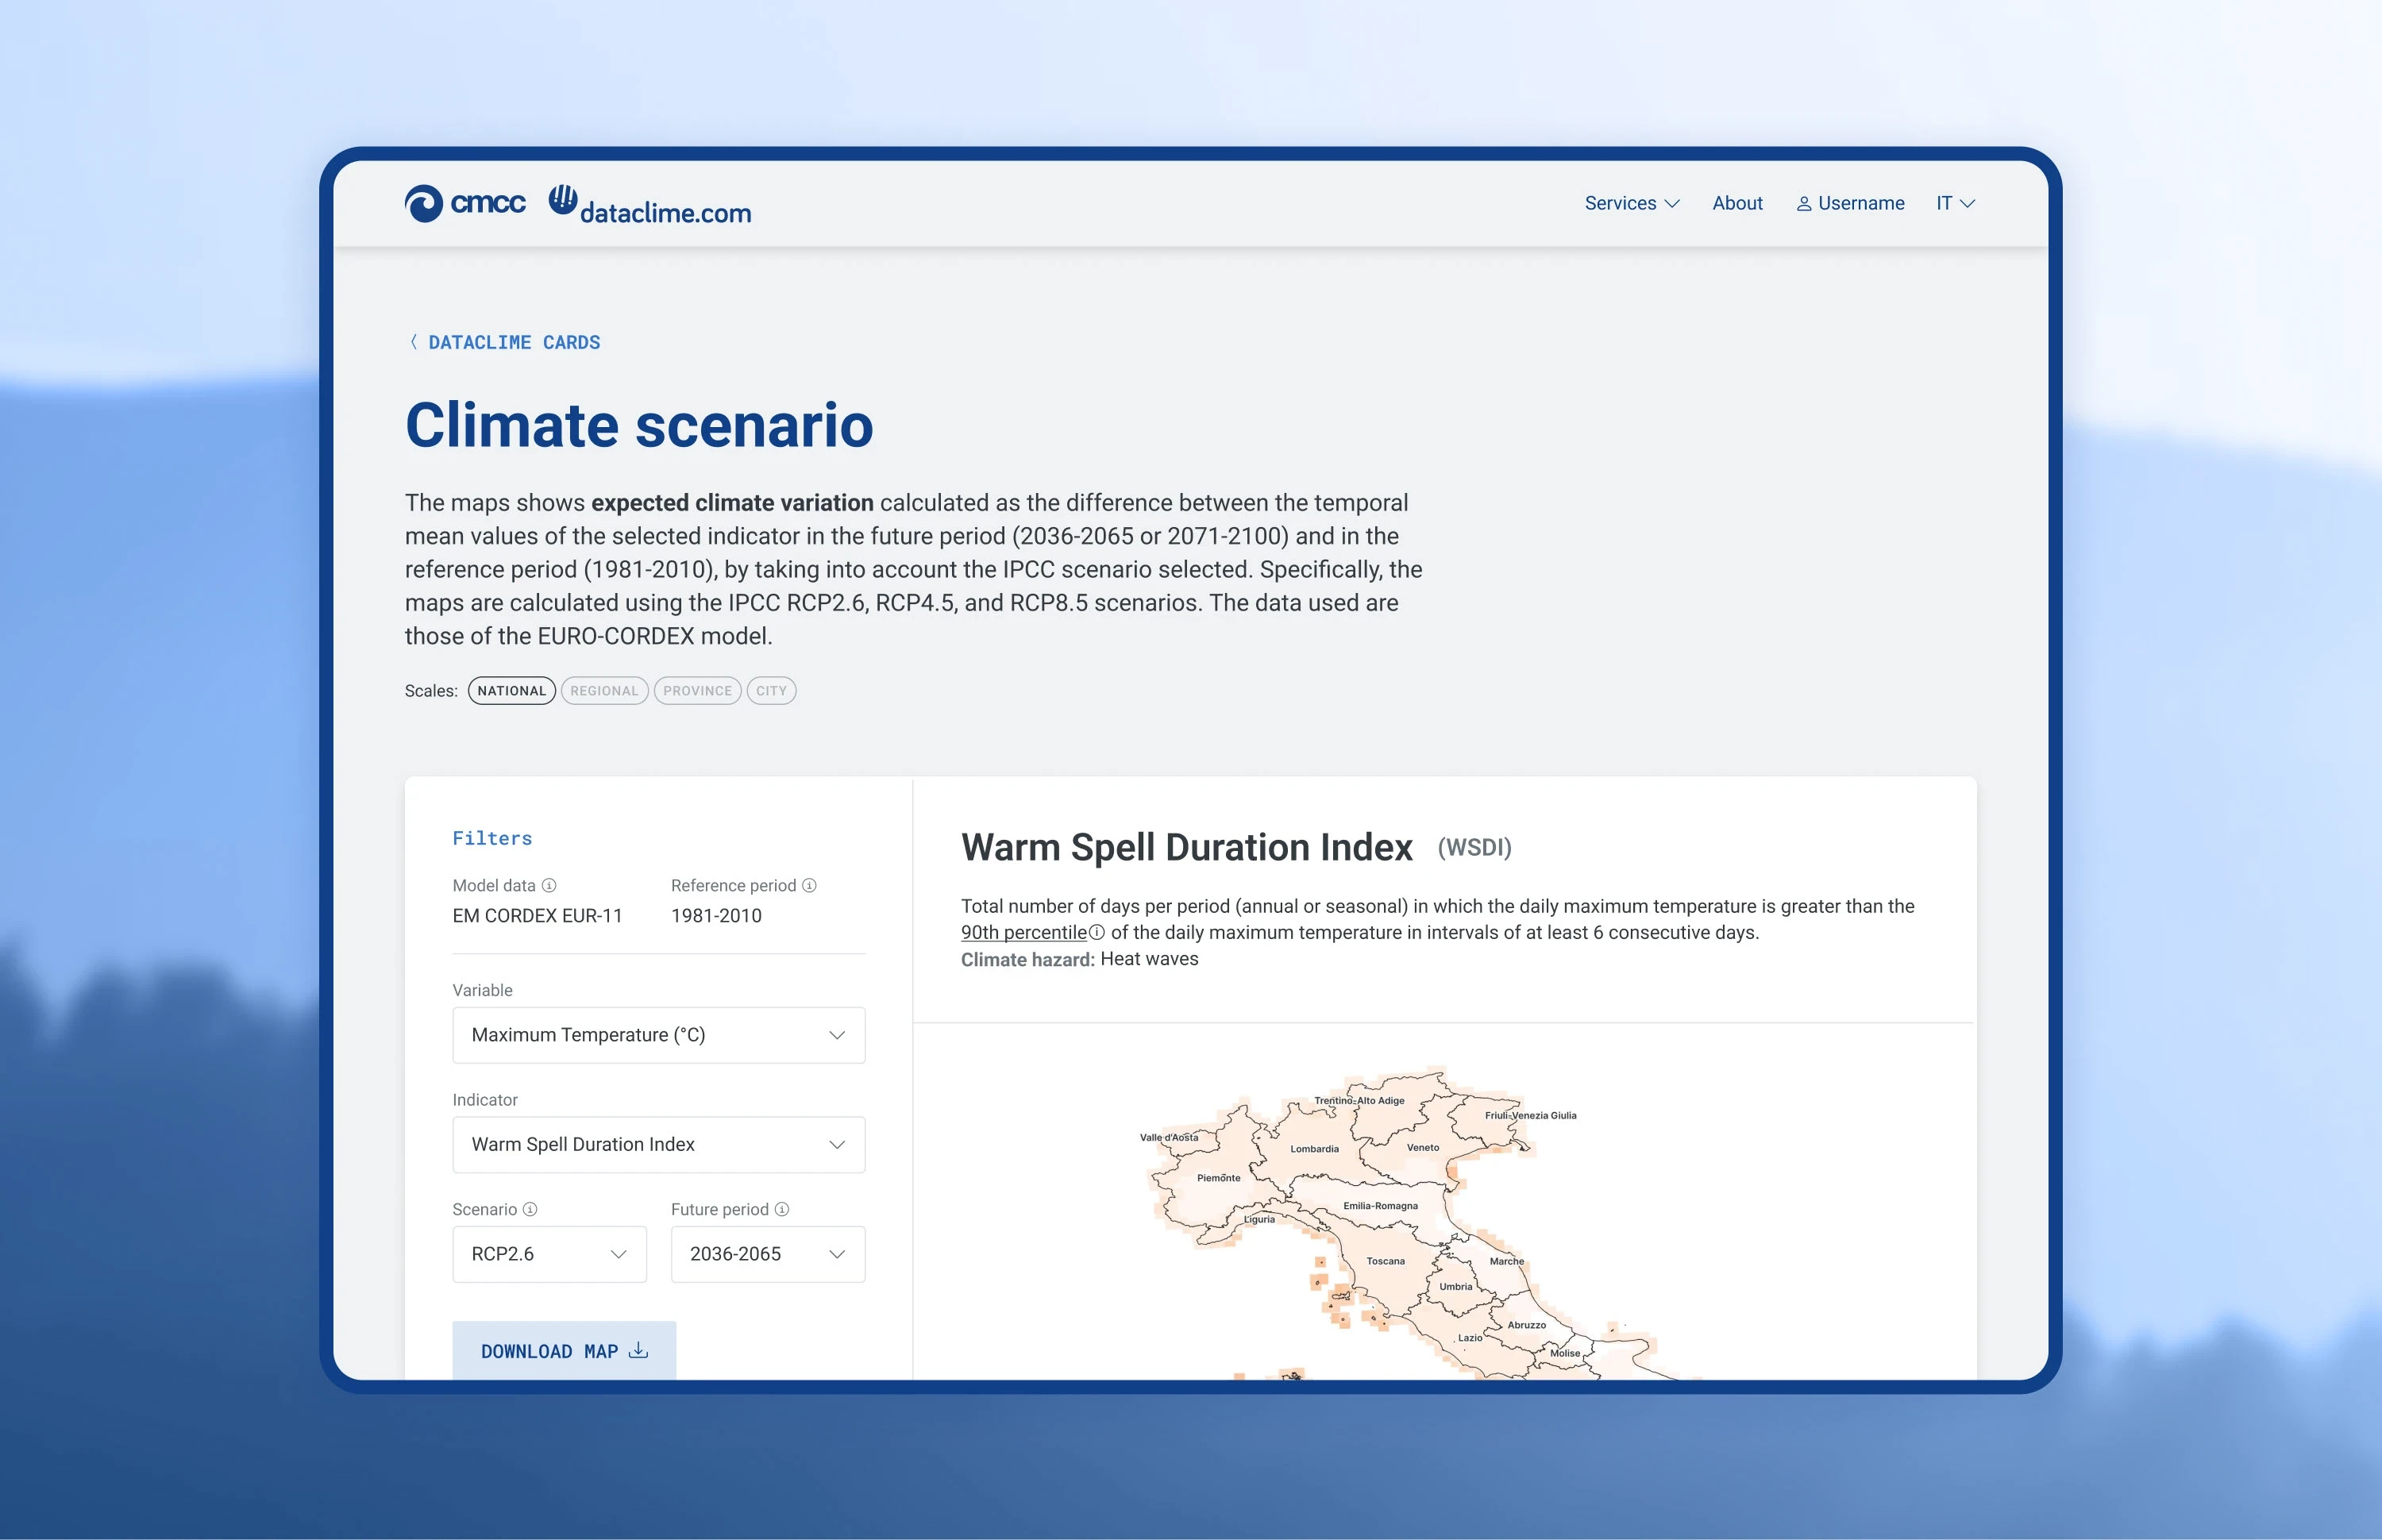
Climat scenario tool
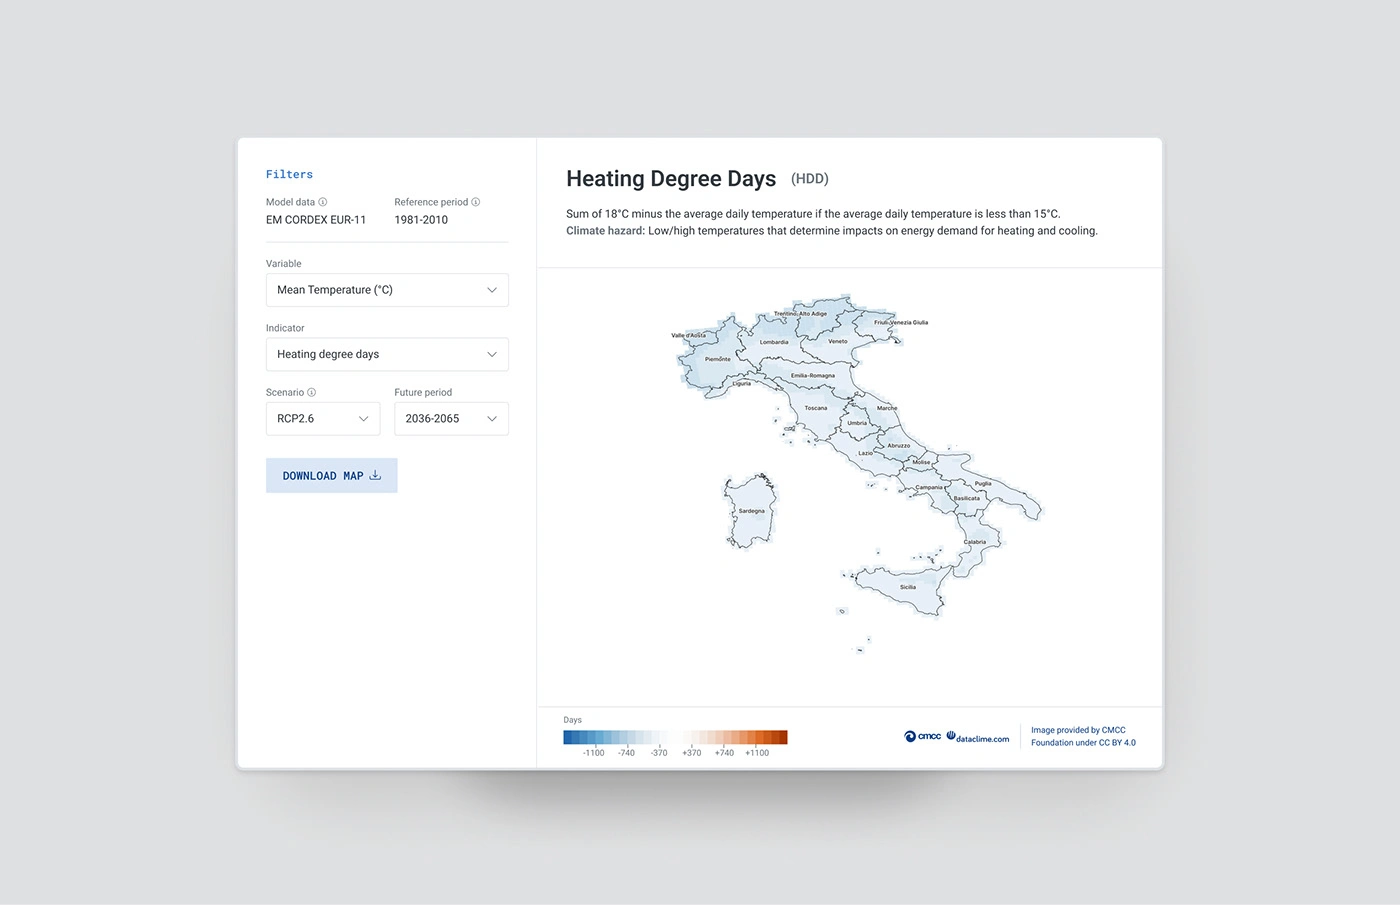
The Climate Scenario tool offers comprehensive visualization of Italy's climate future through detailed maps based on a wide range of climate indicators. Users can explore projected changes in temperature, intense precipitation, heatwaves, etc. The tool calculates climate variations by comparing the temporal mean values between two time periods: a future projection (2036-2065) and a historical reference period (1981-2010). These projections are available under different IPCC scenarios, allowing users to understand potential climate impacts based on various emissions pathways.
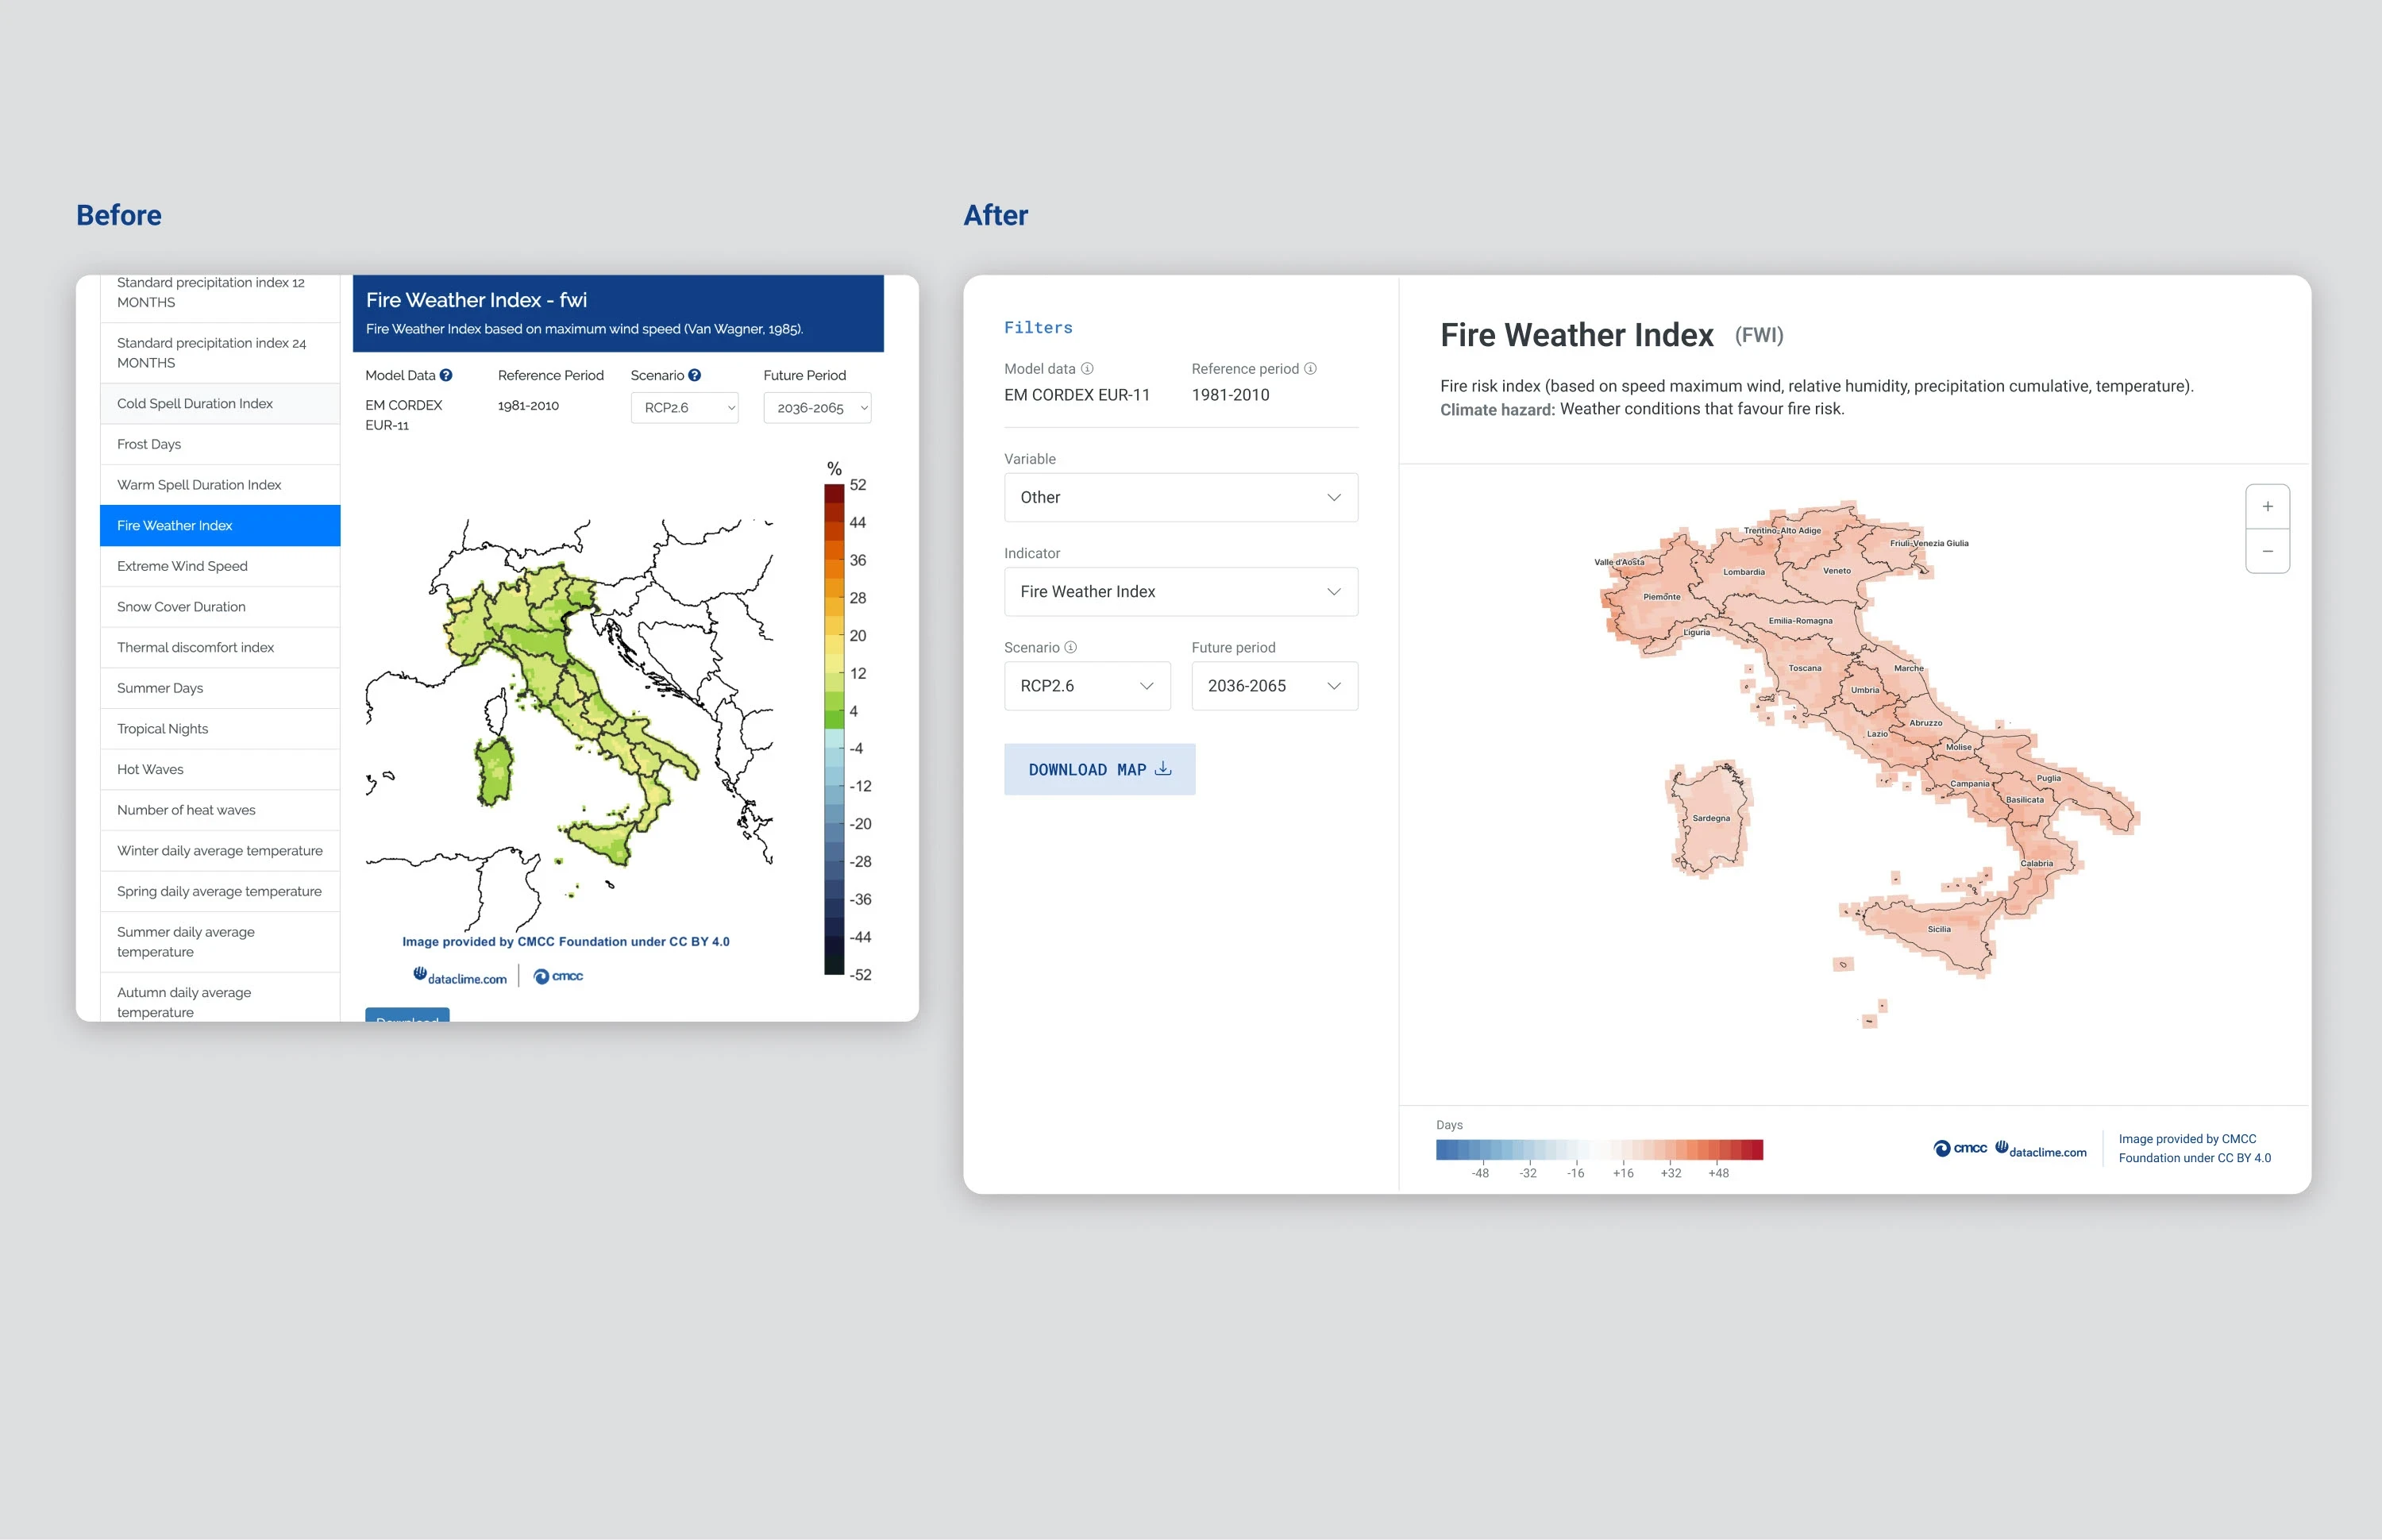
Before and after the redesign
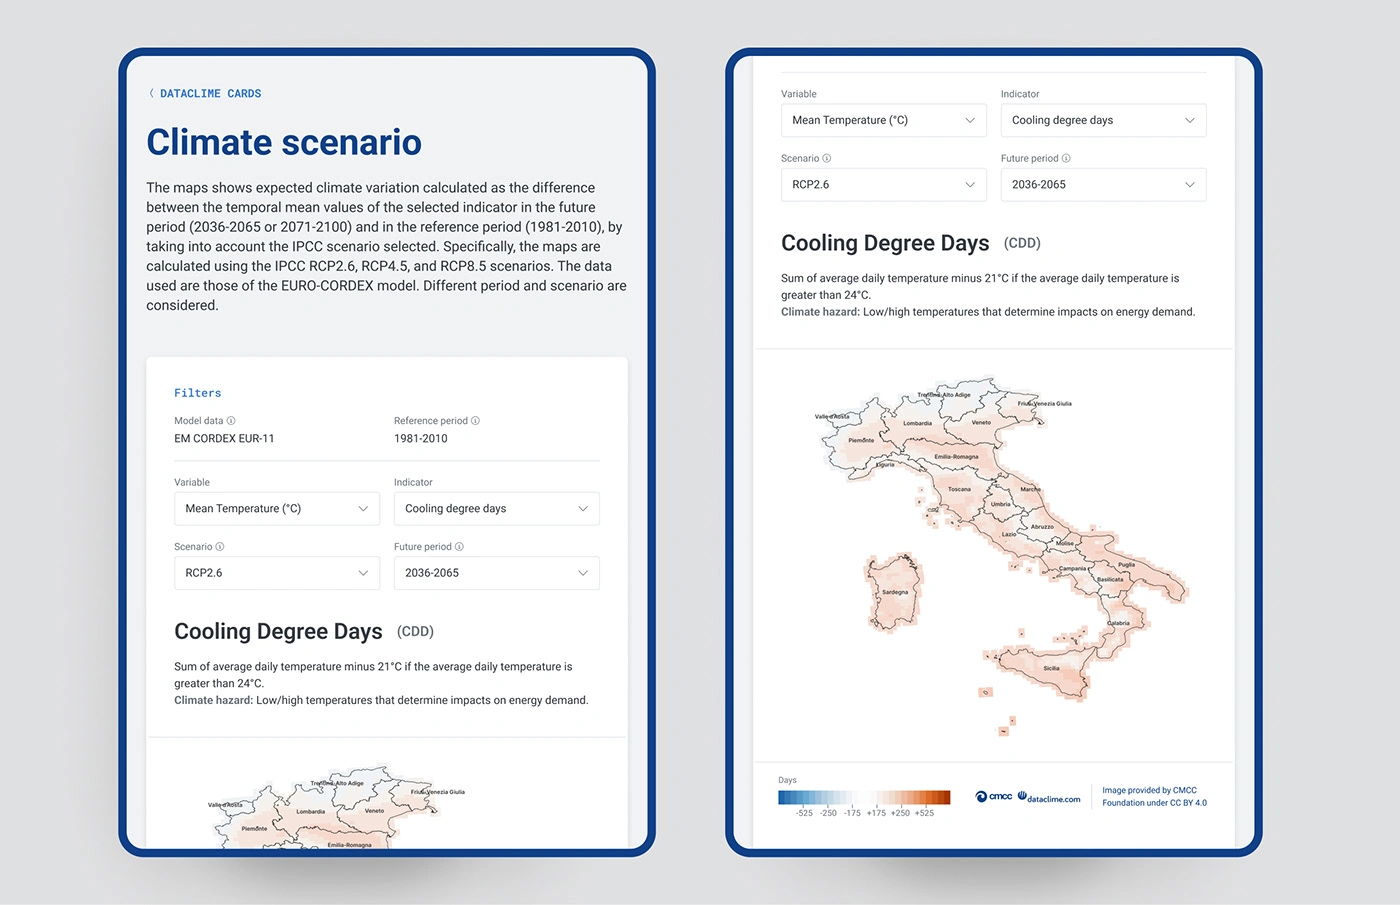
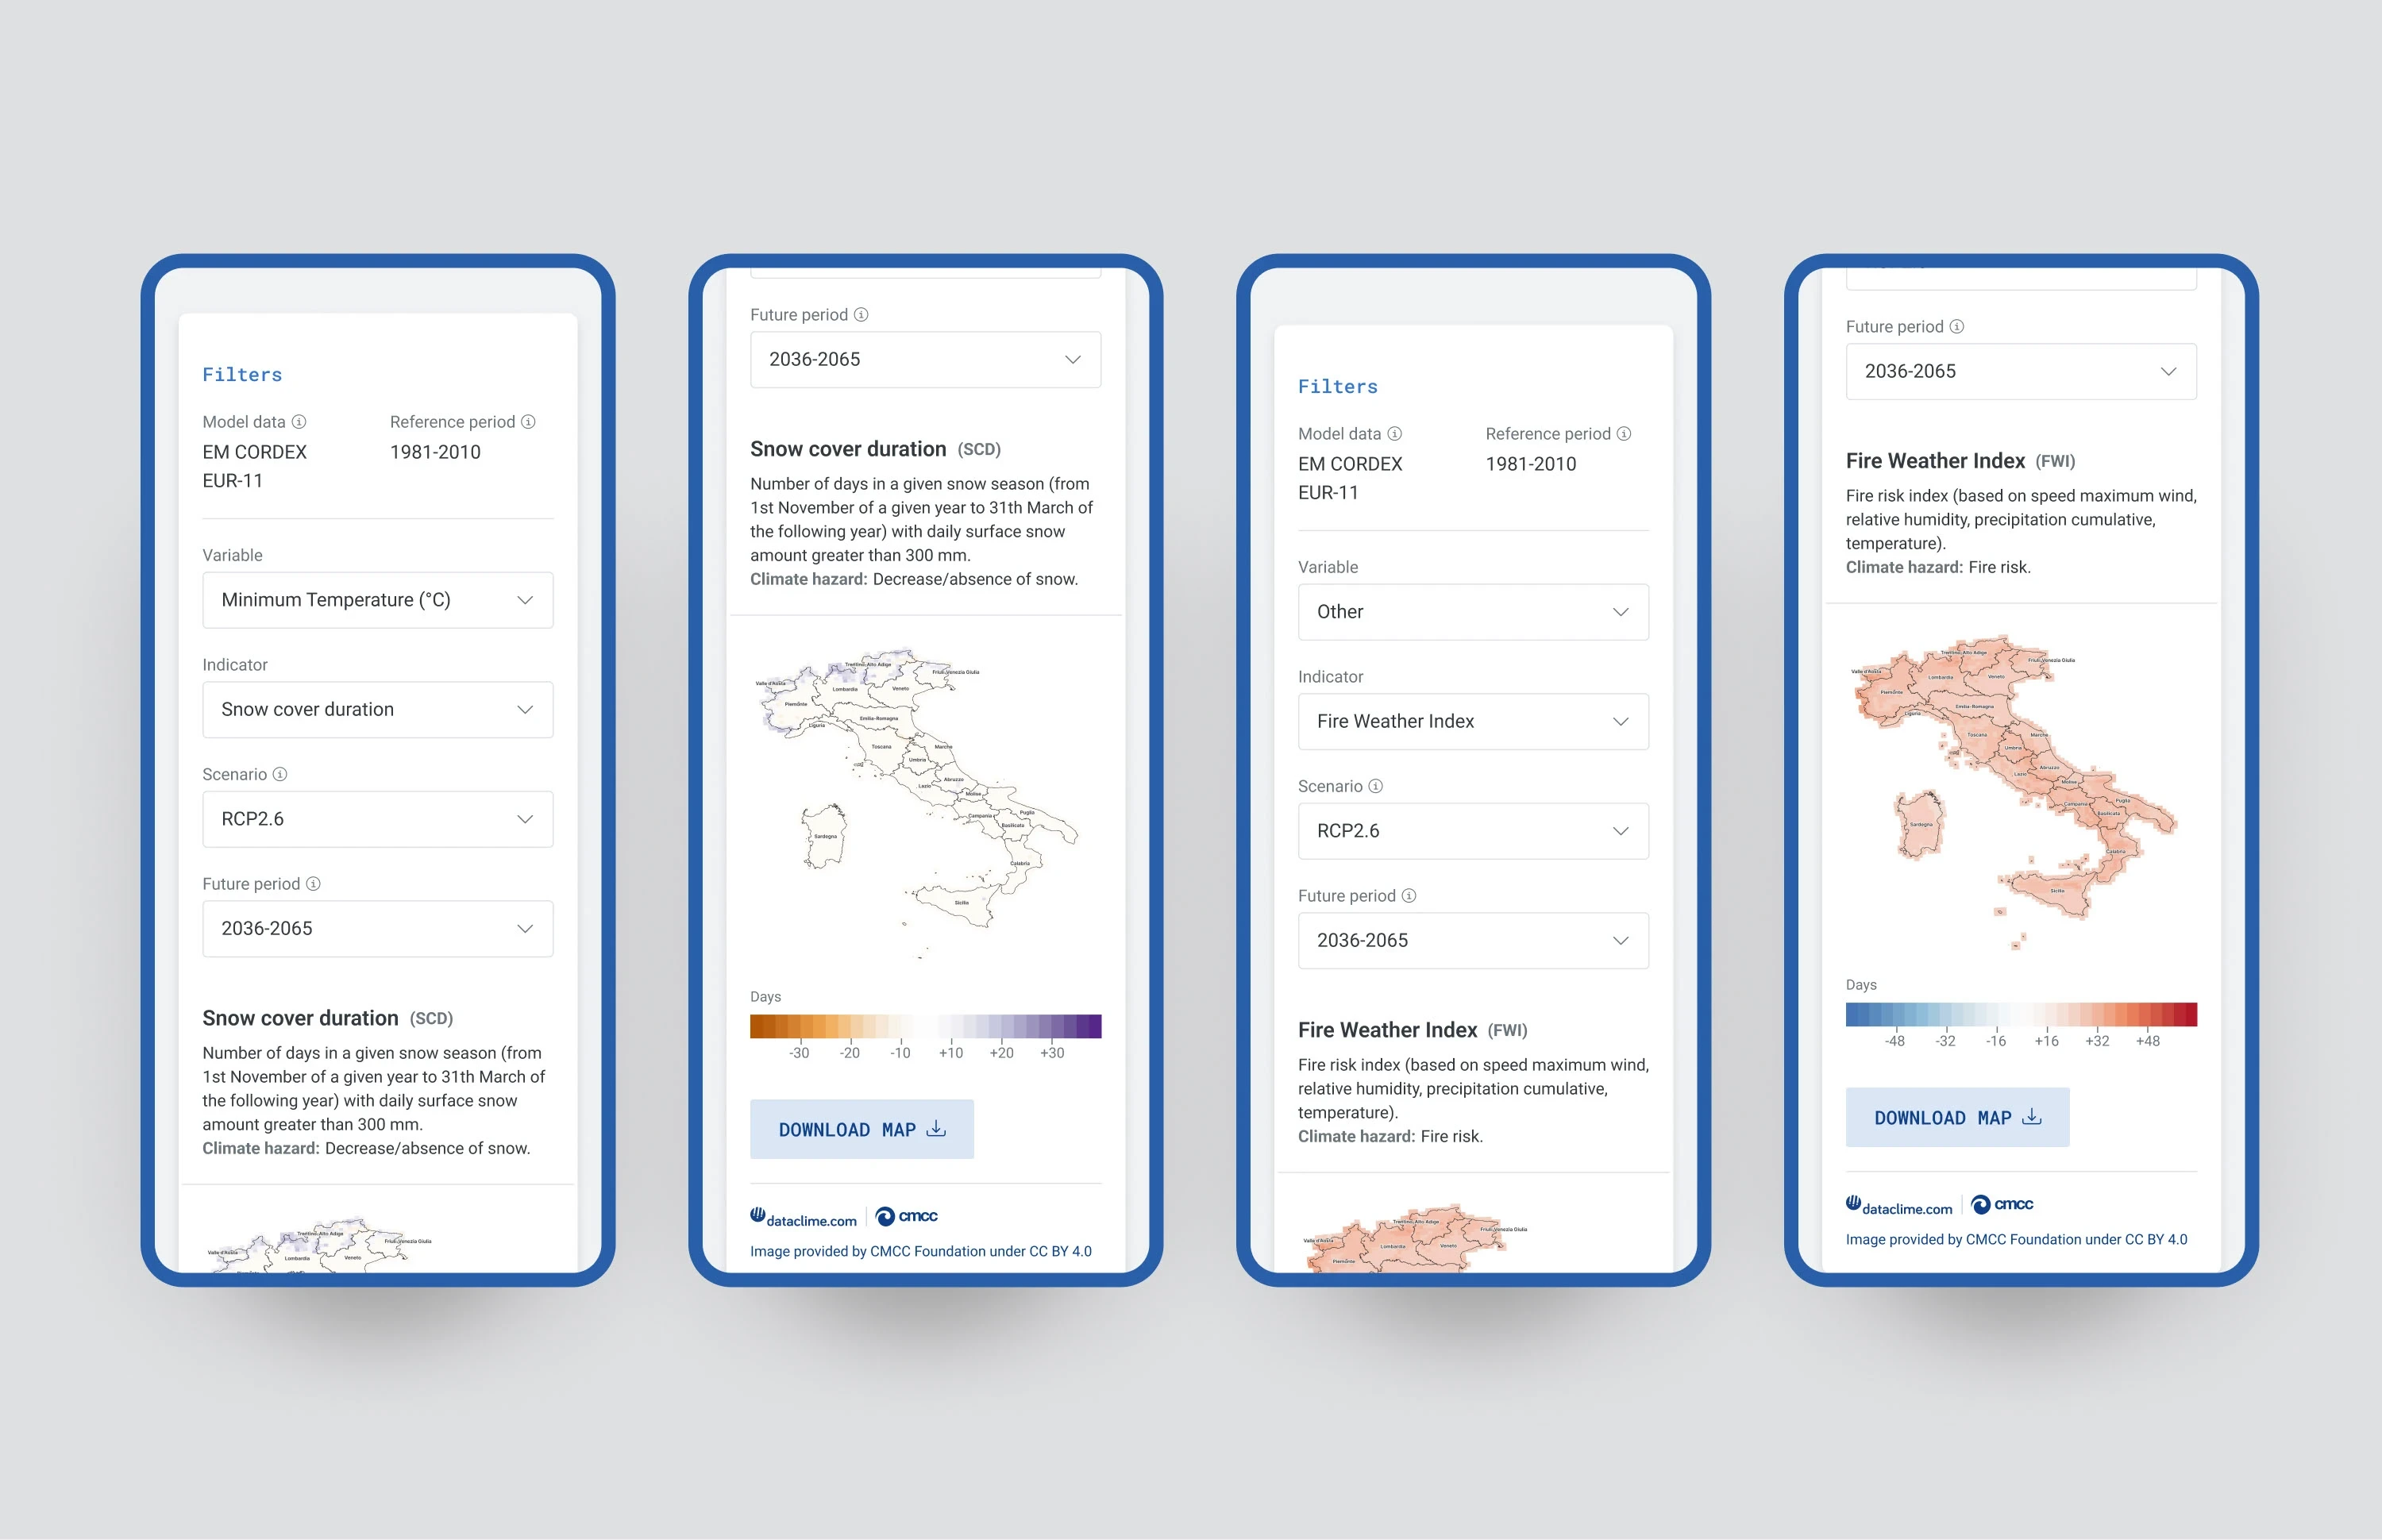
Mobile pages
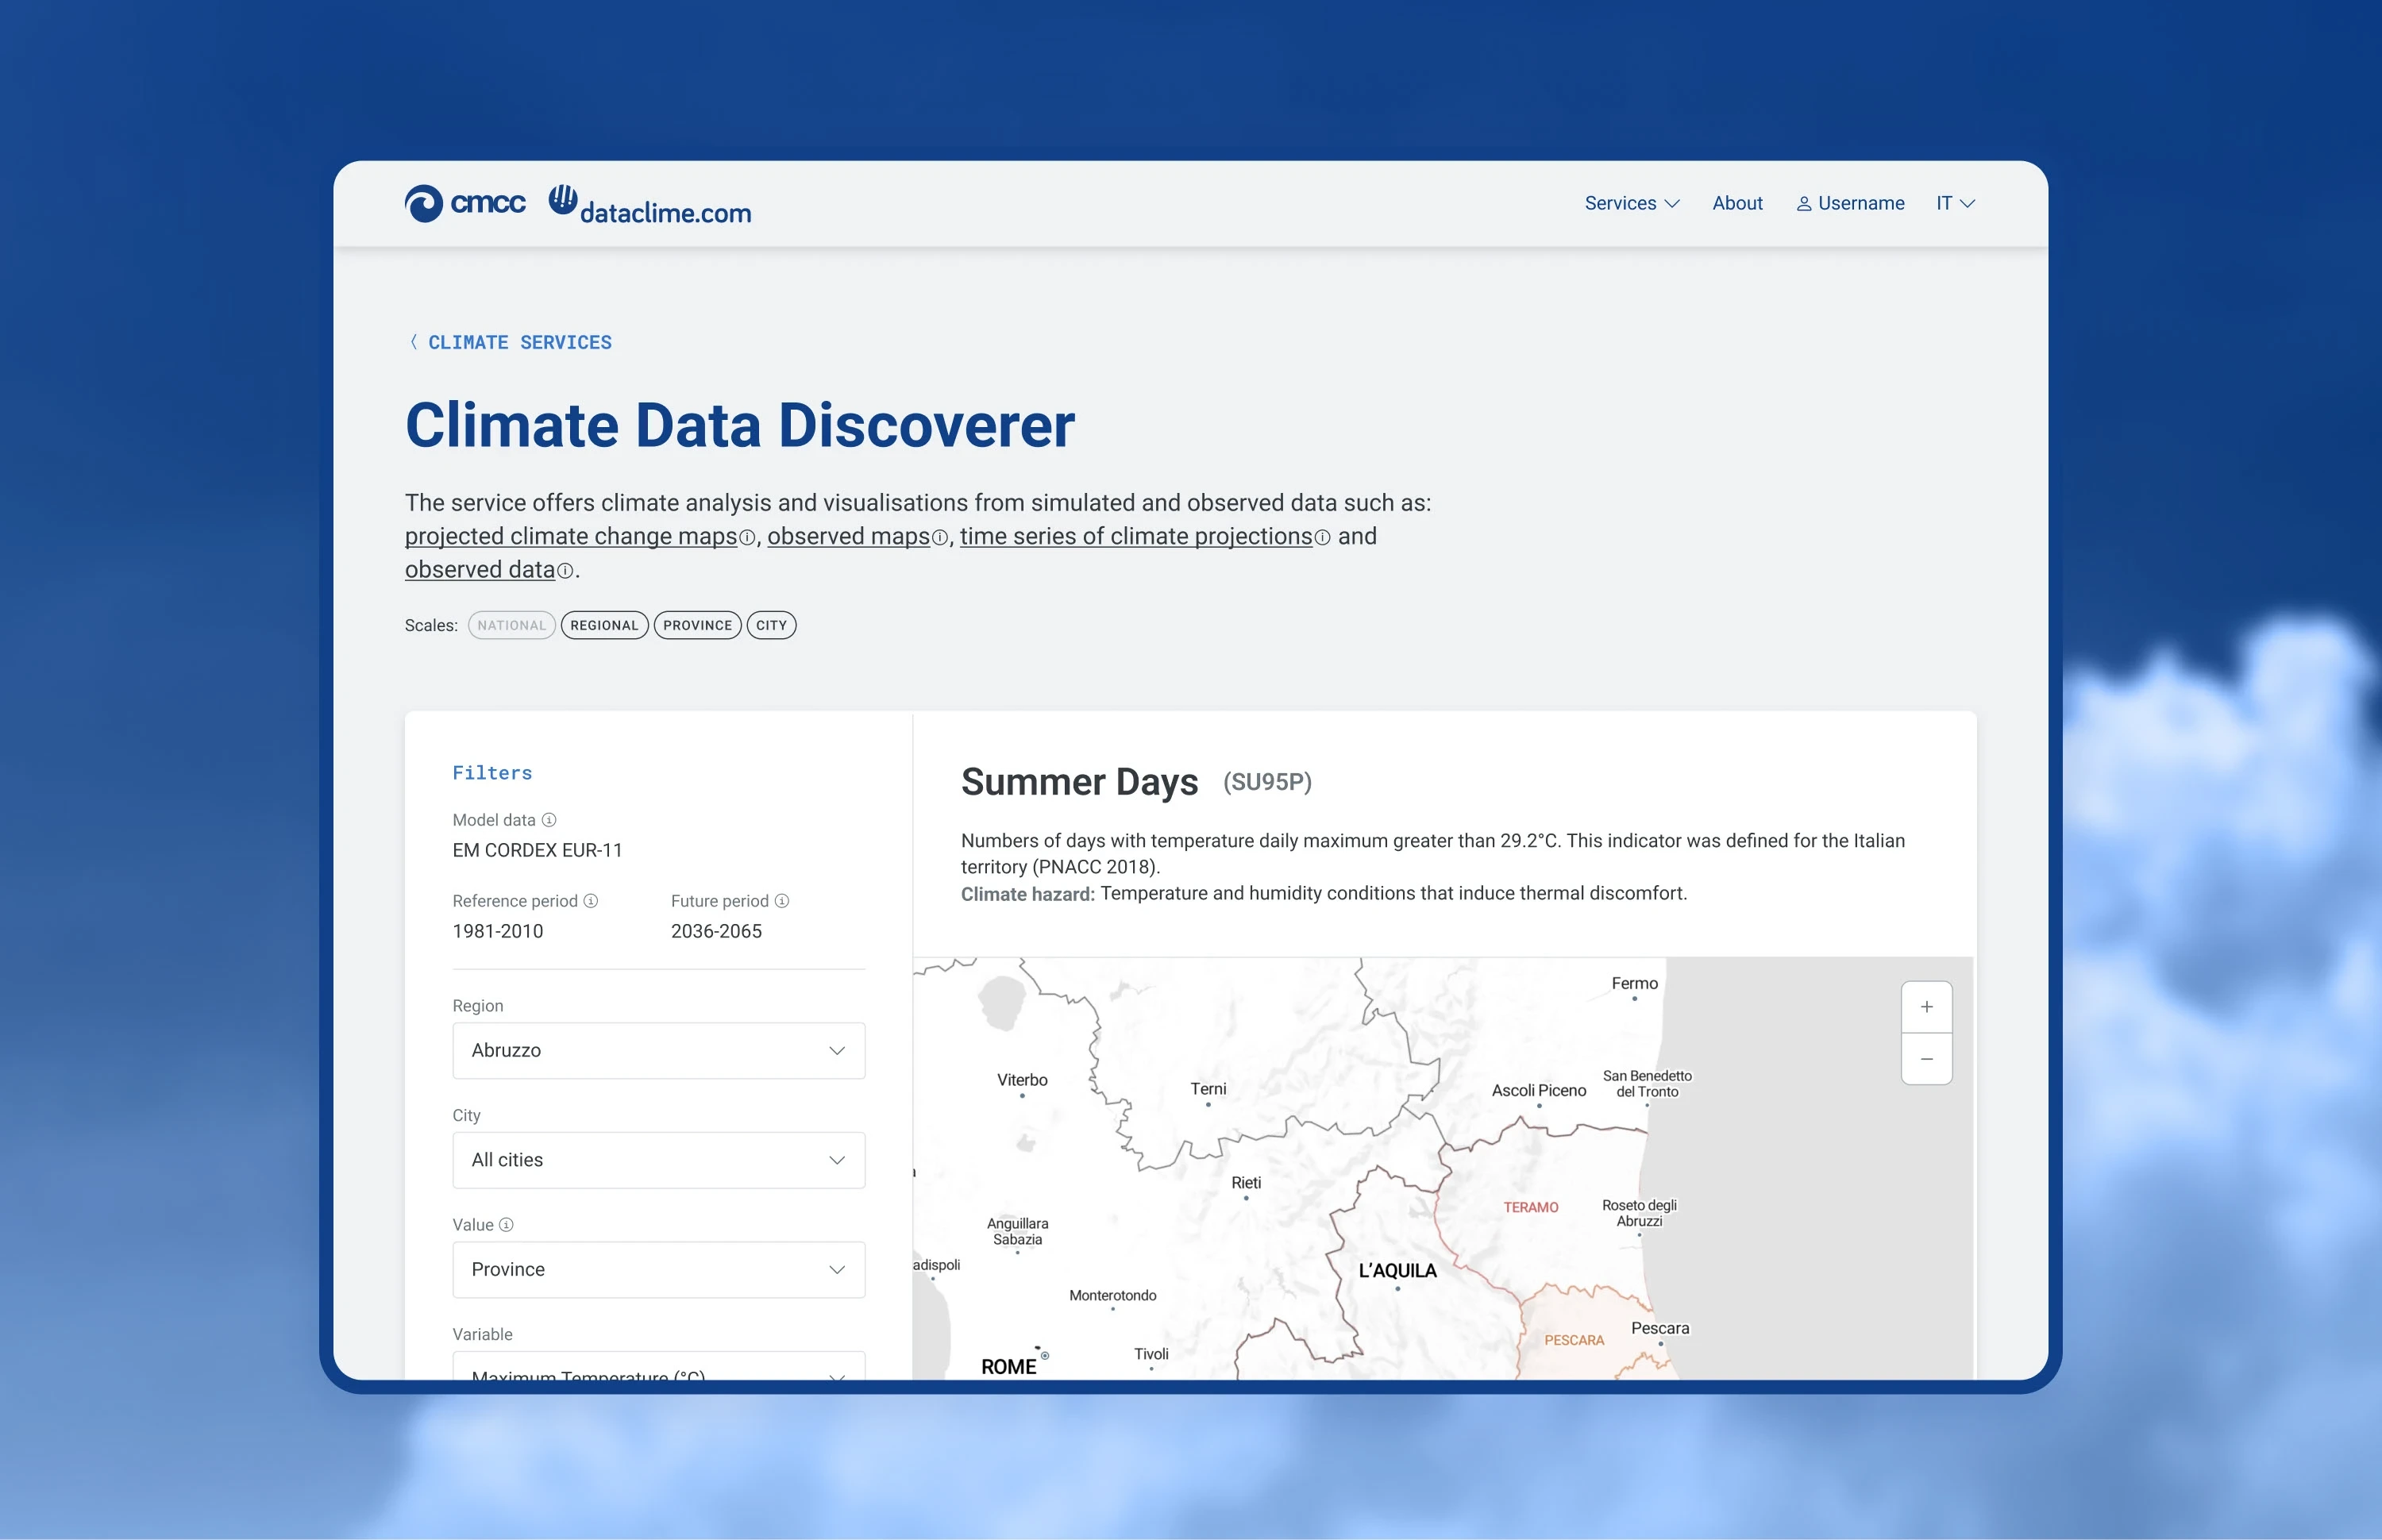
Climate Data Discoverer
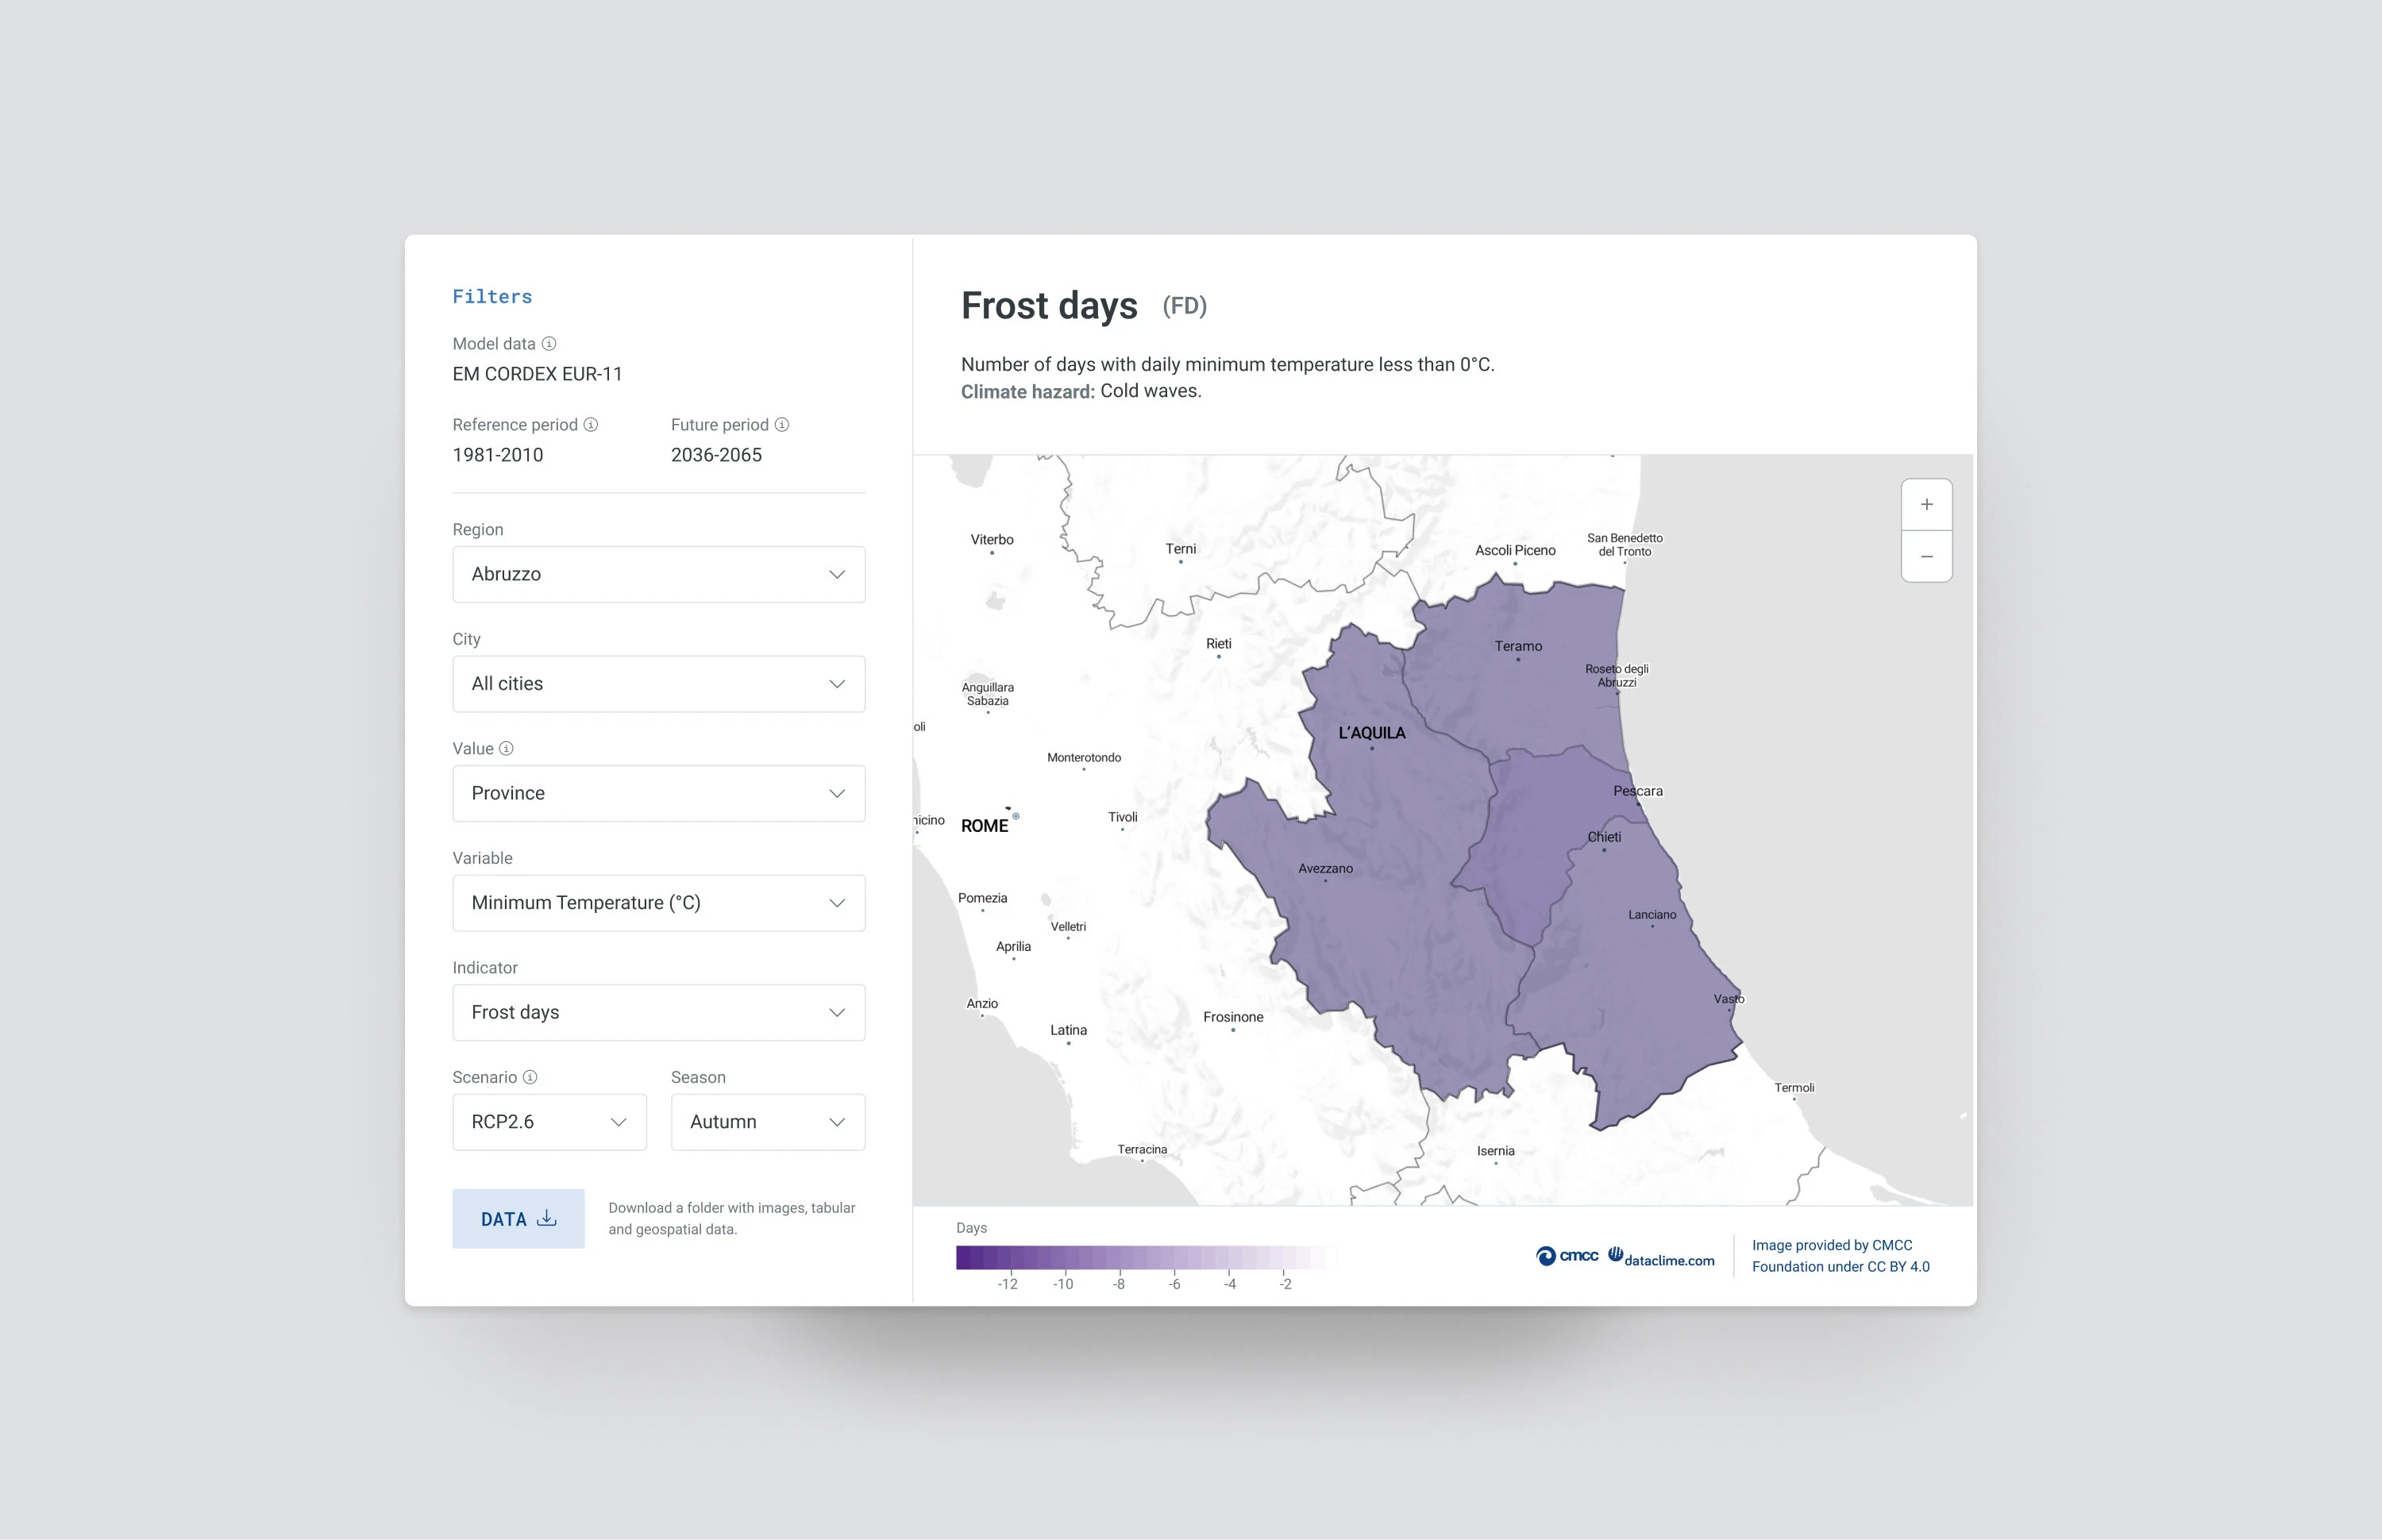
The Climate Data Discoverer tool provides interactive maps and time series visualizations of projected climate change for Italian administrative areas, including both regions and provinces. Users can select climate variables and indicators—such as temperature, precipitation, and extreme events—as well as choose between different RCP scenarios and seasons to tailor their analysis.
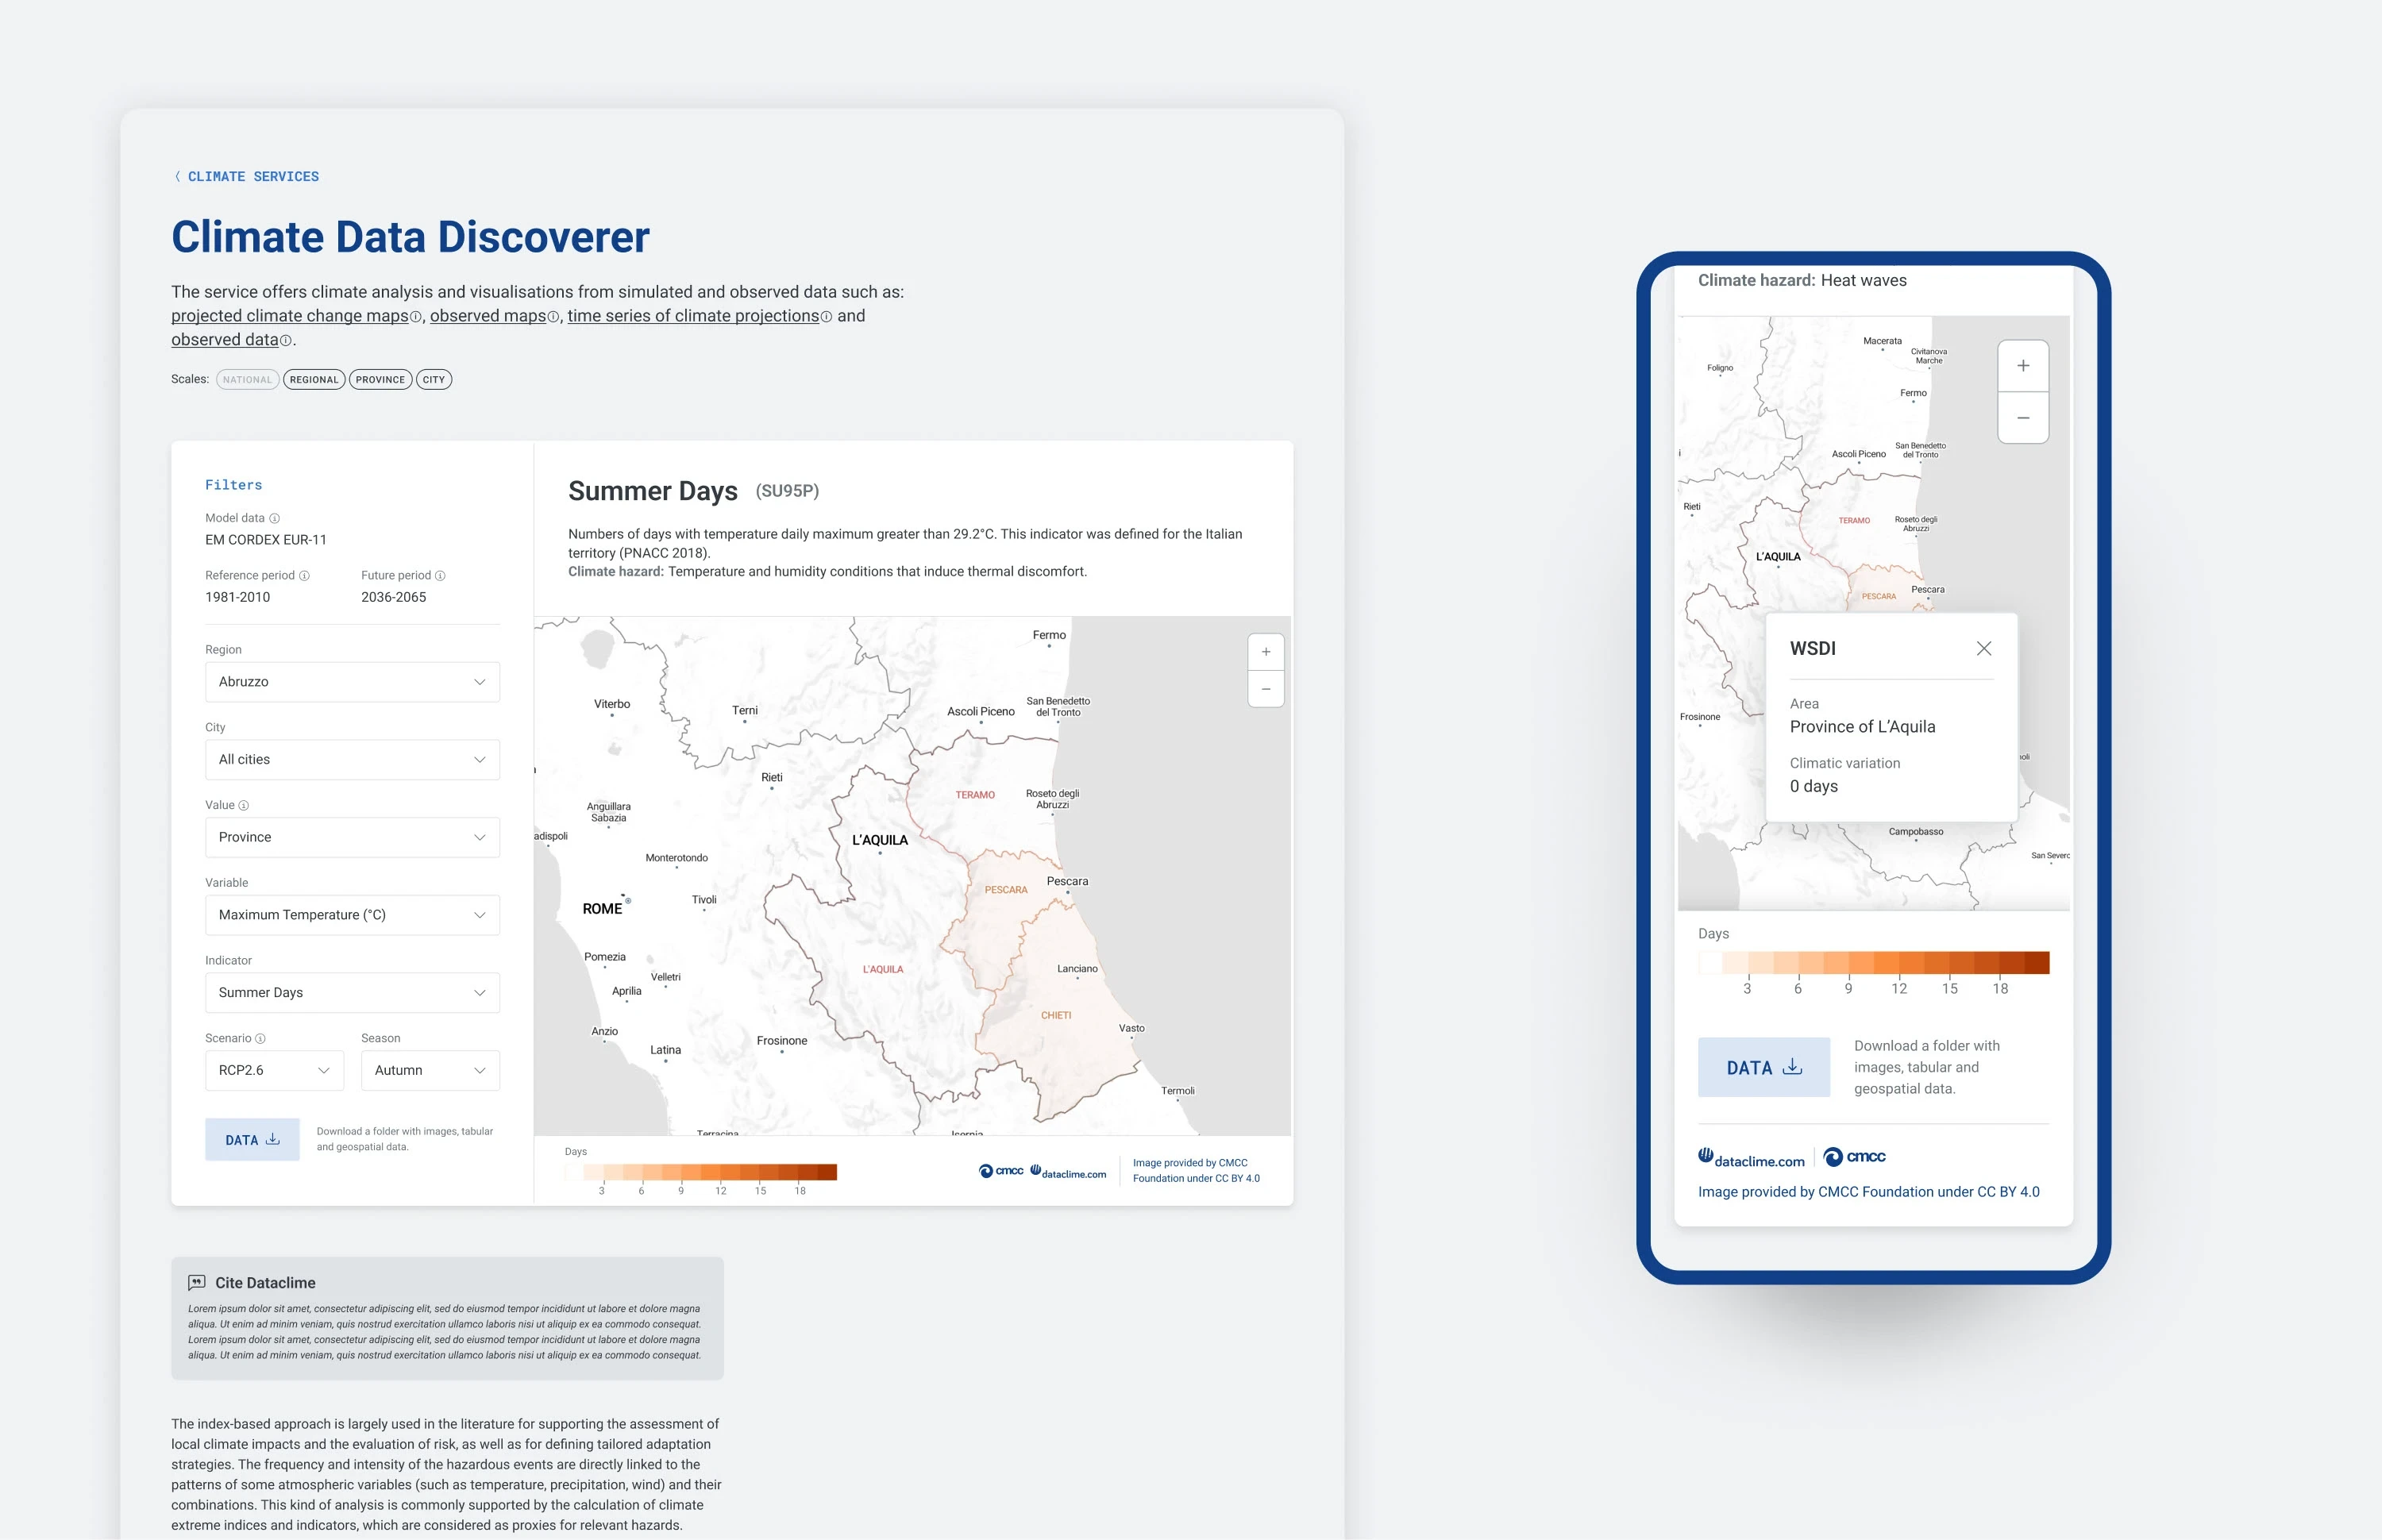
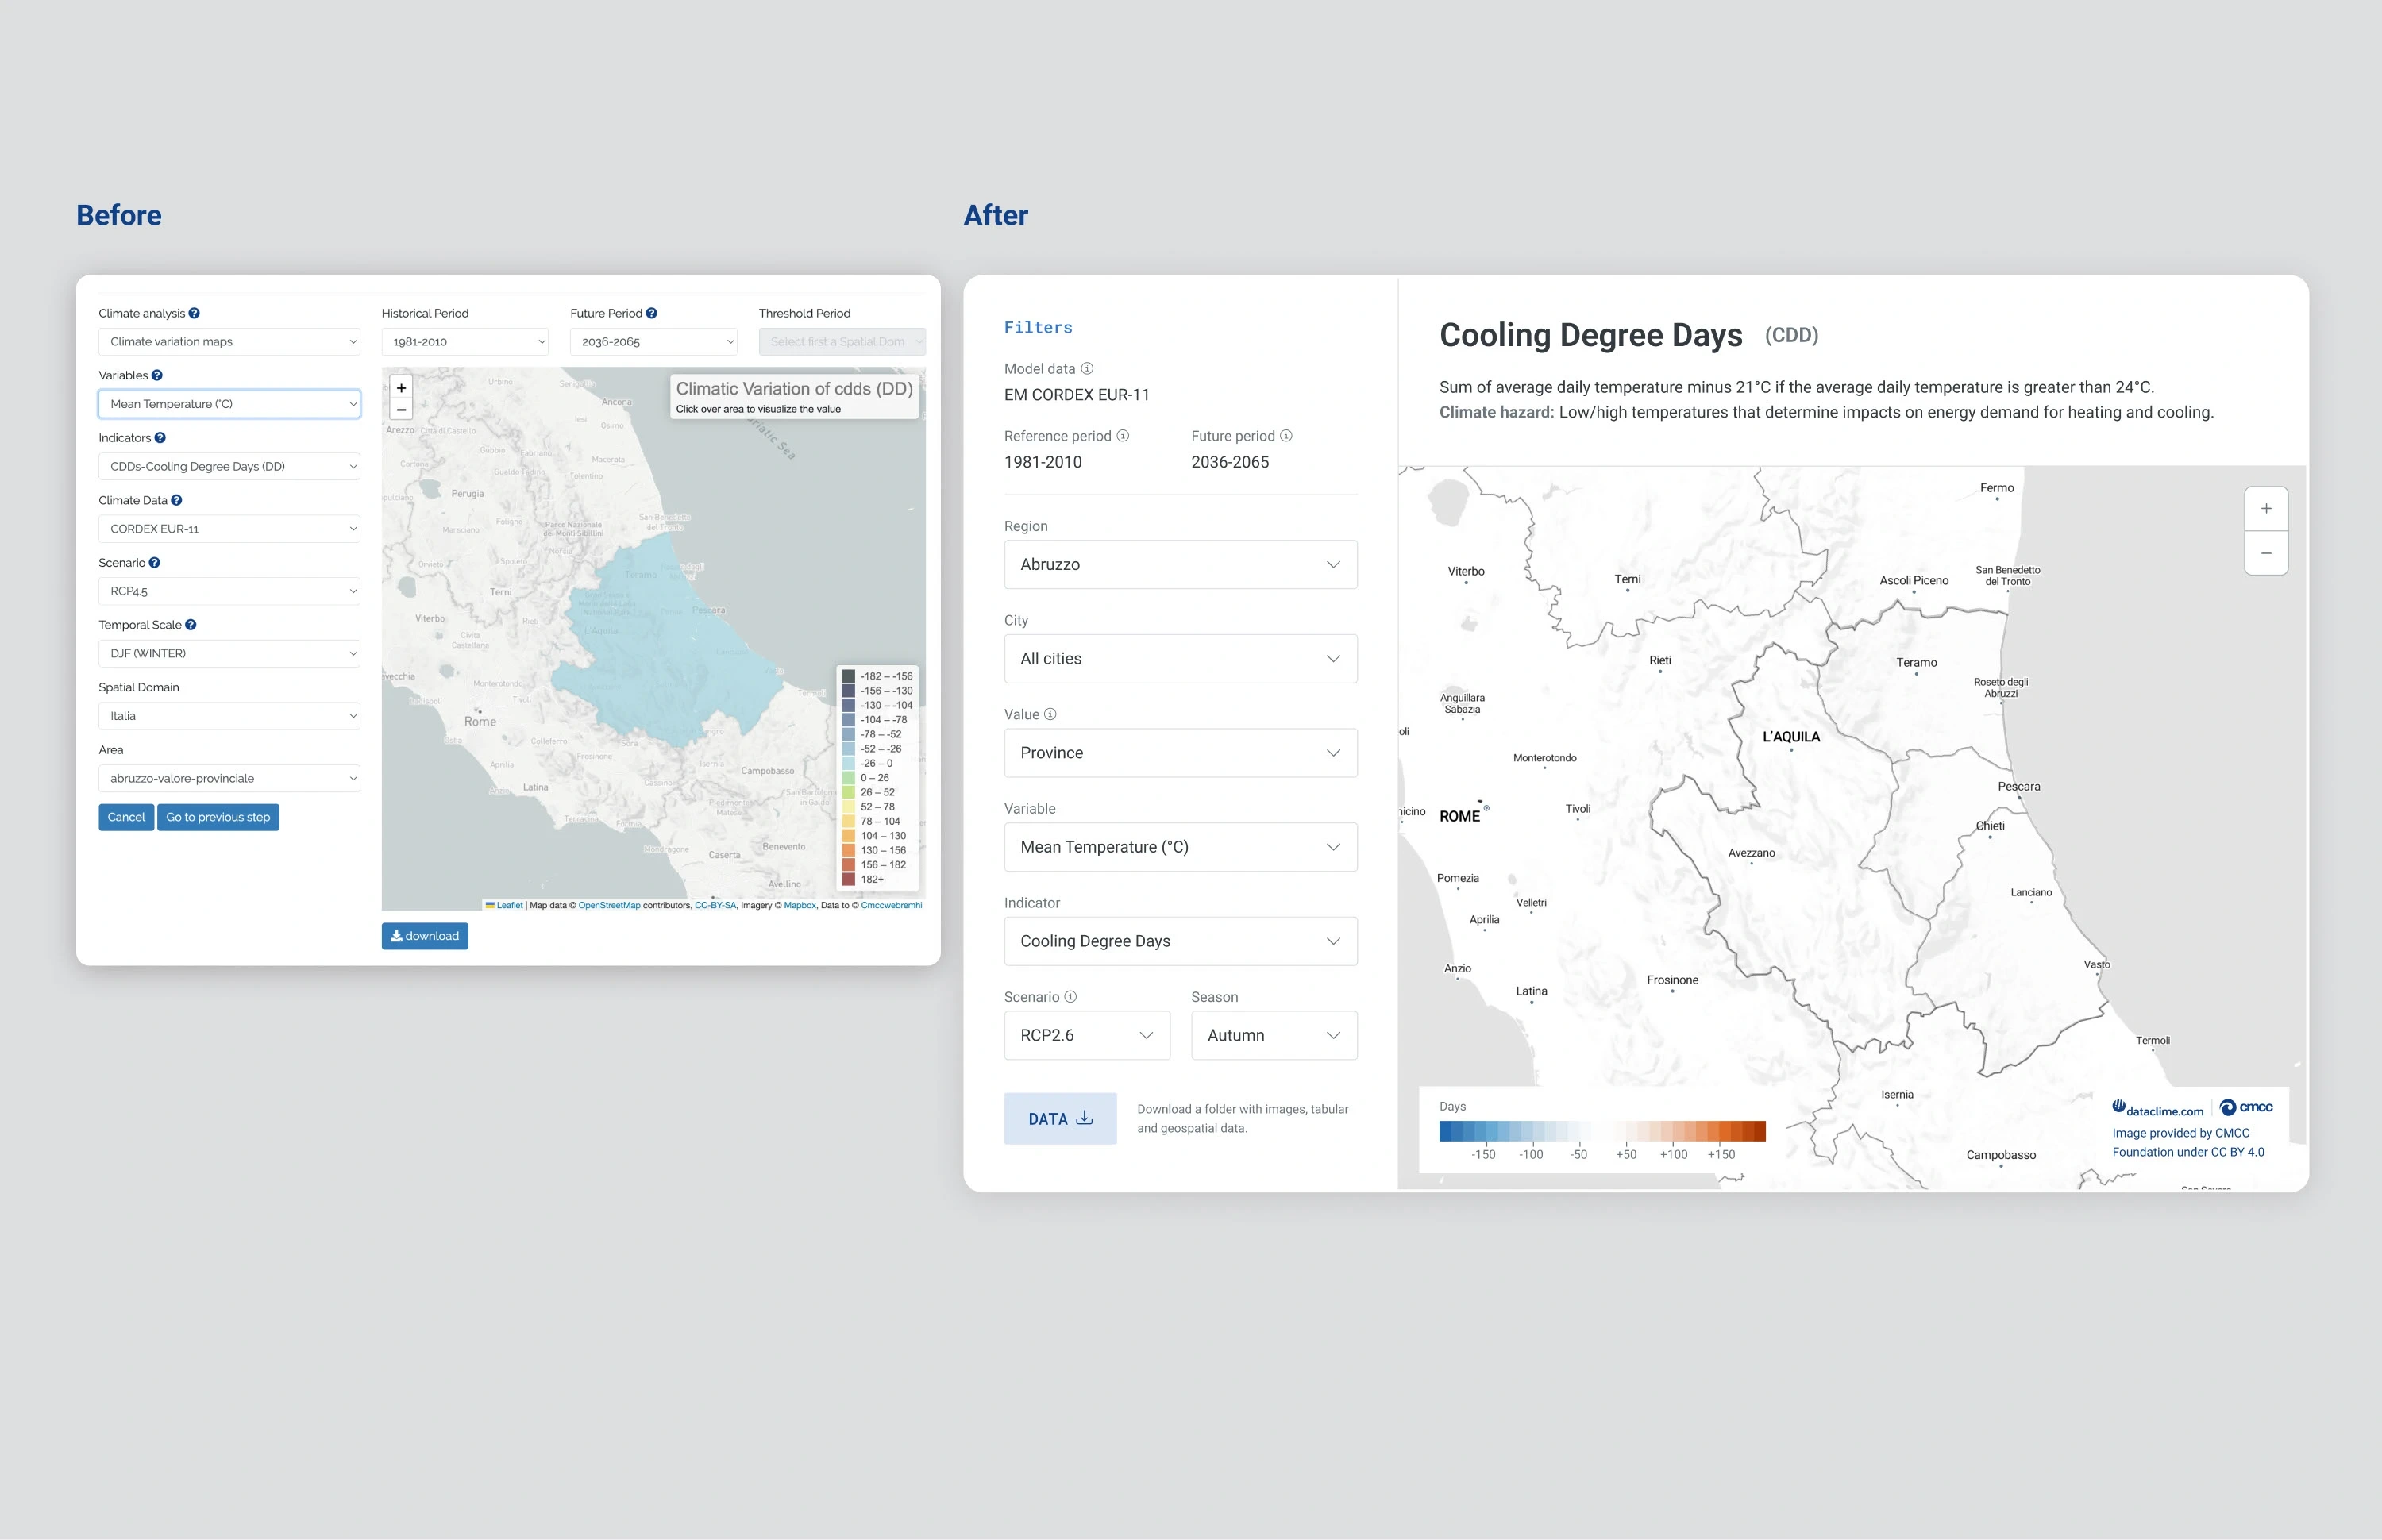
Before and after the redesign
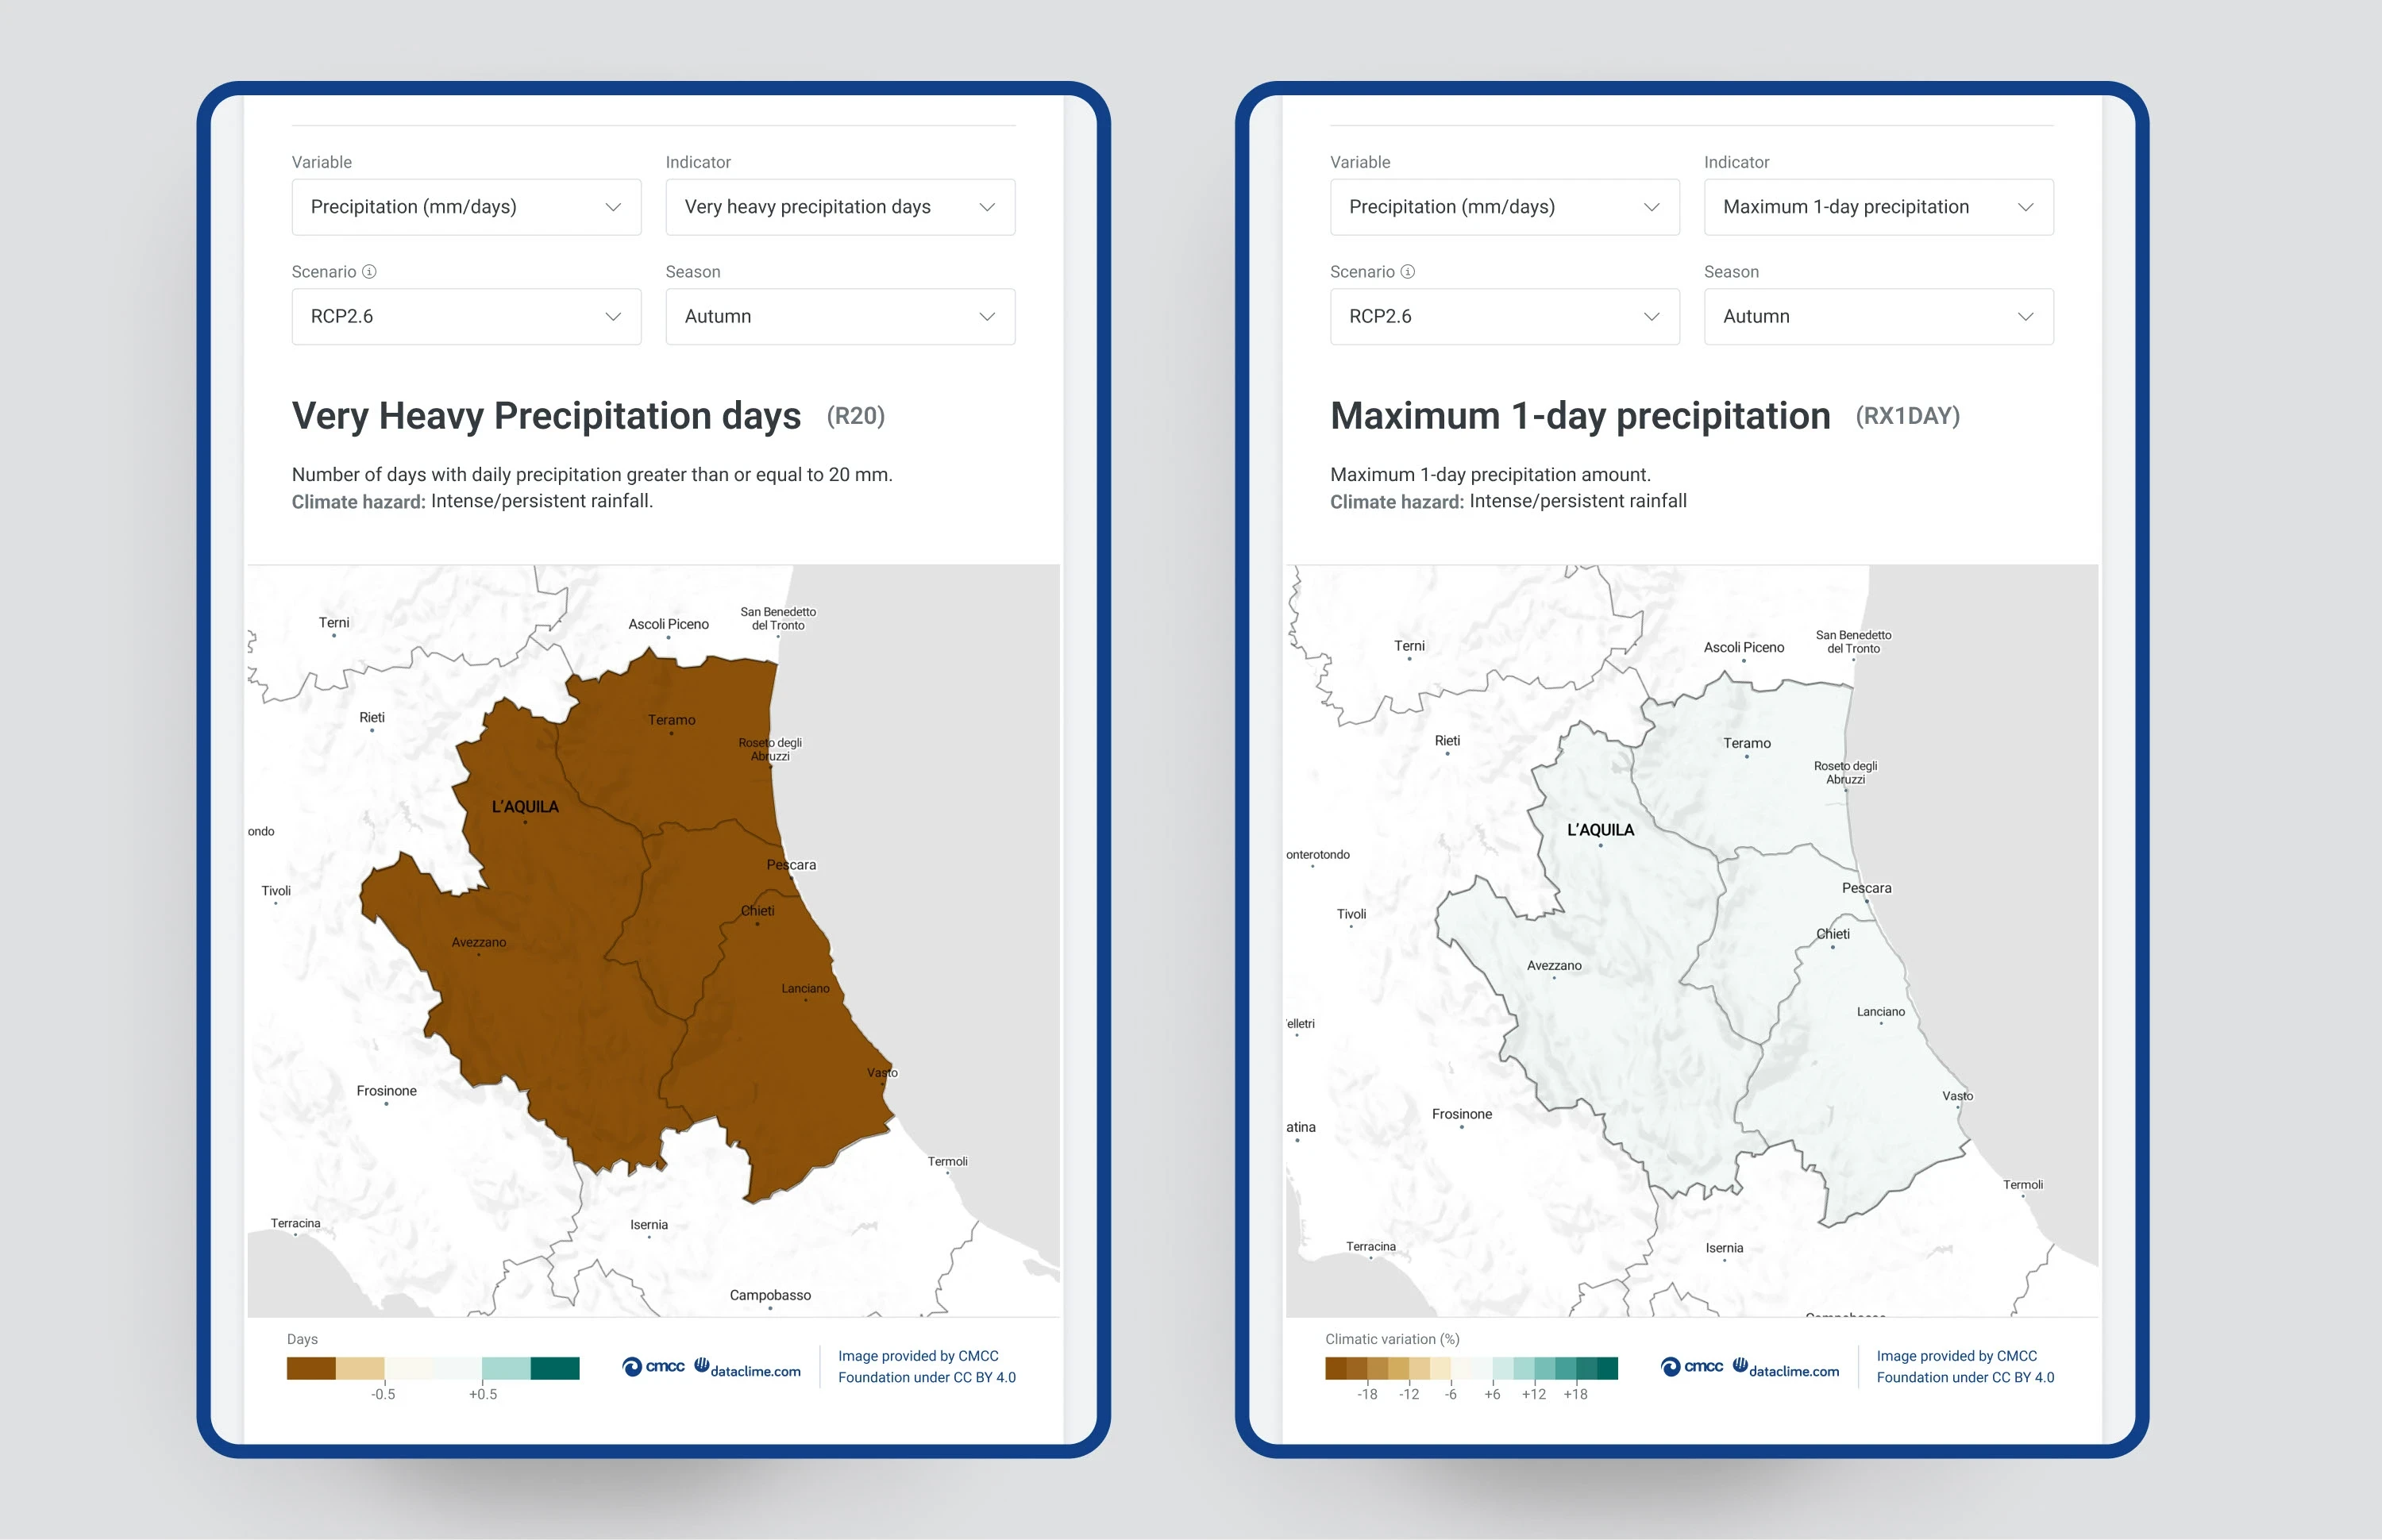
Tablet pages
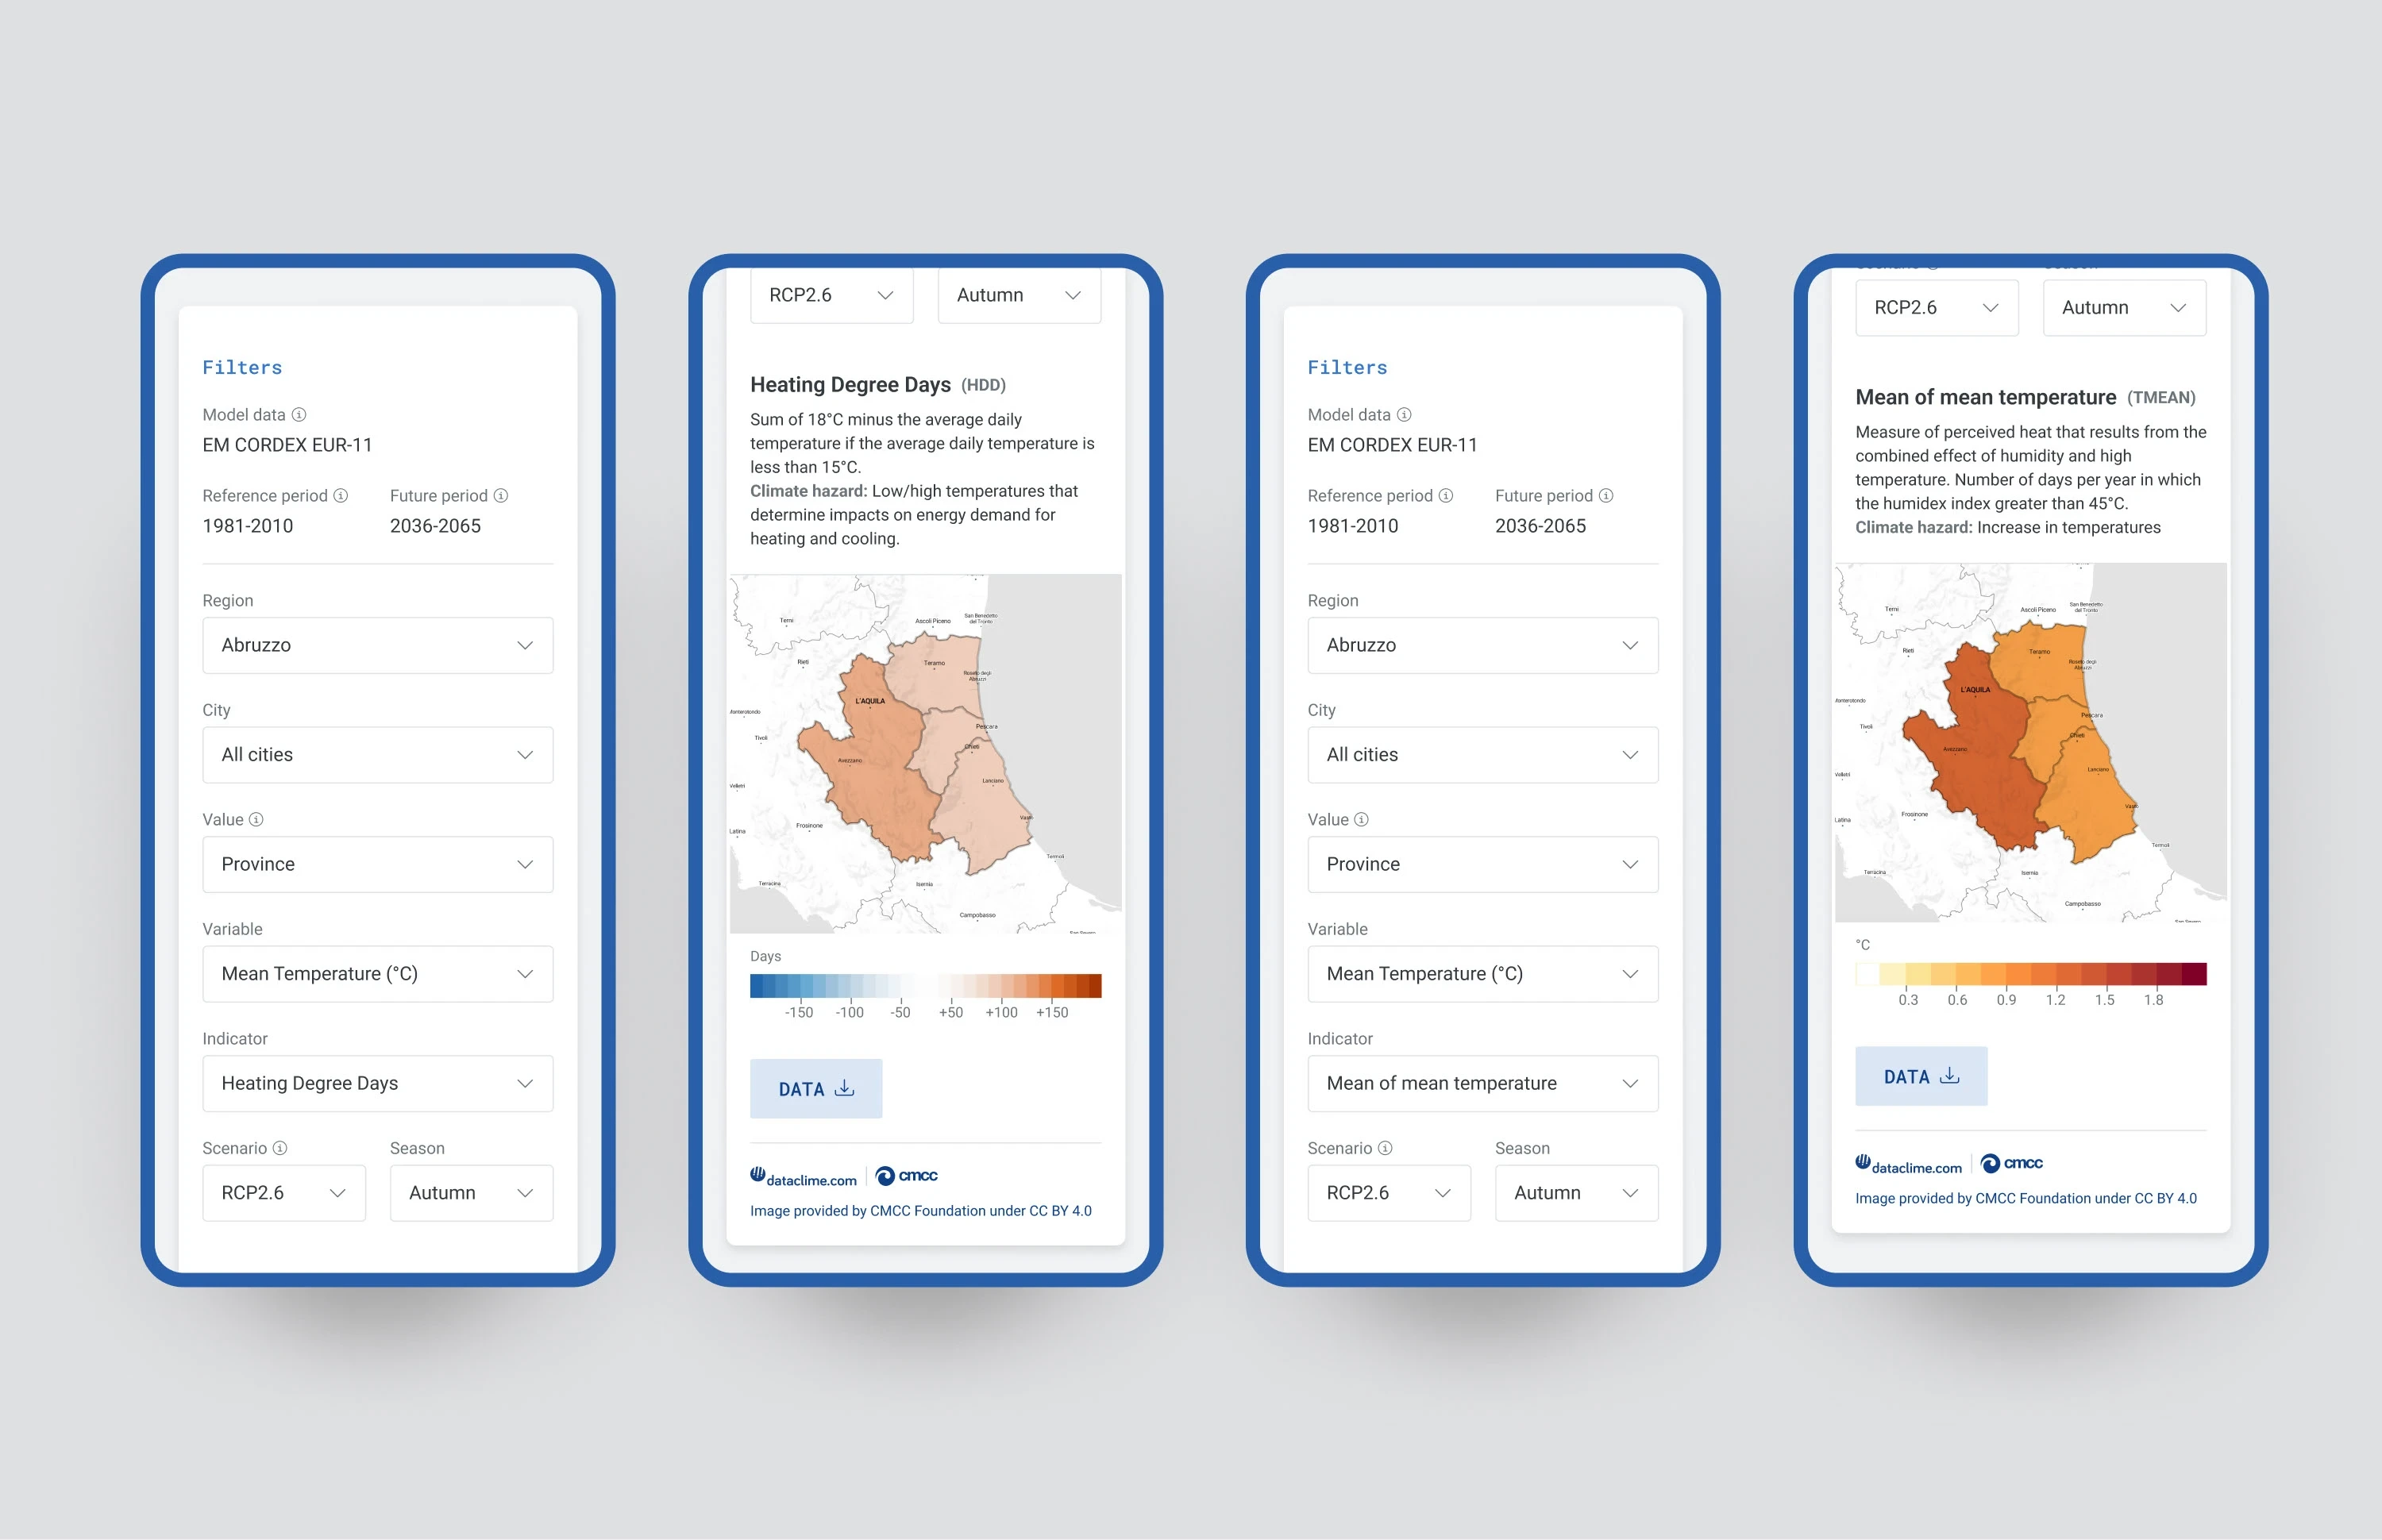
Mobile pages
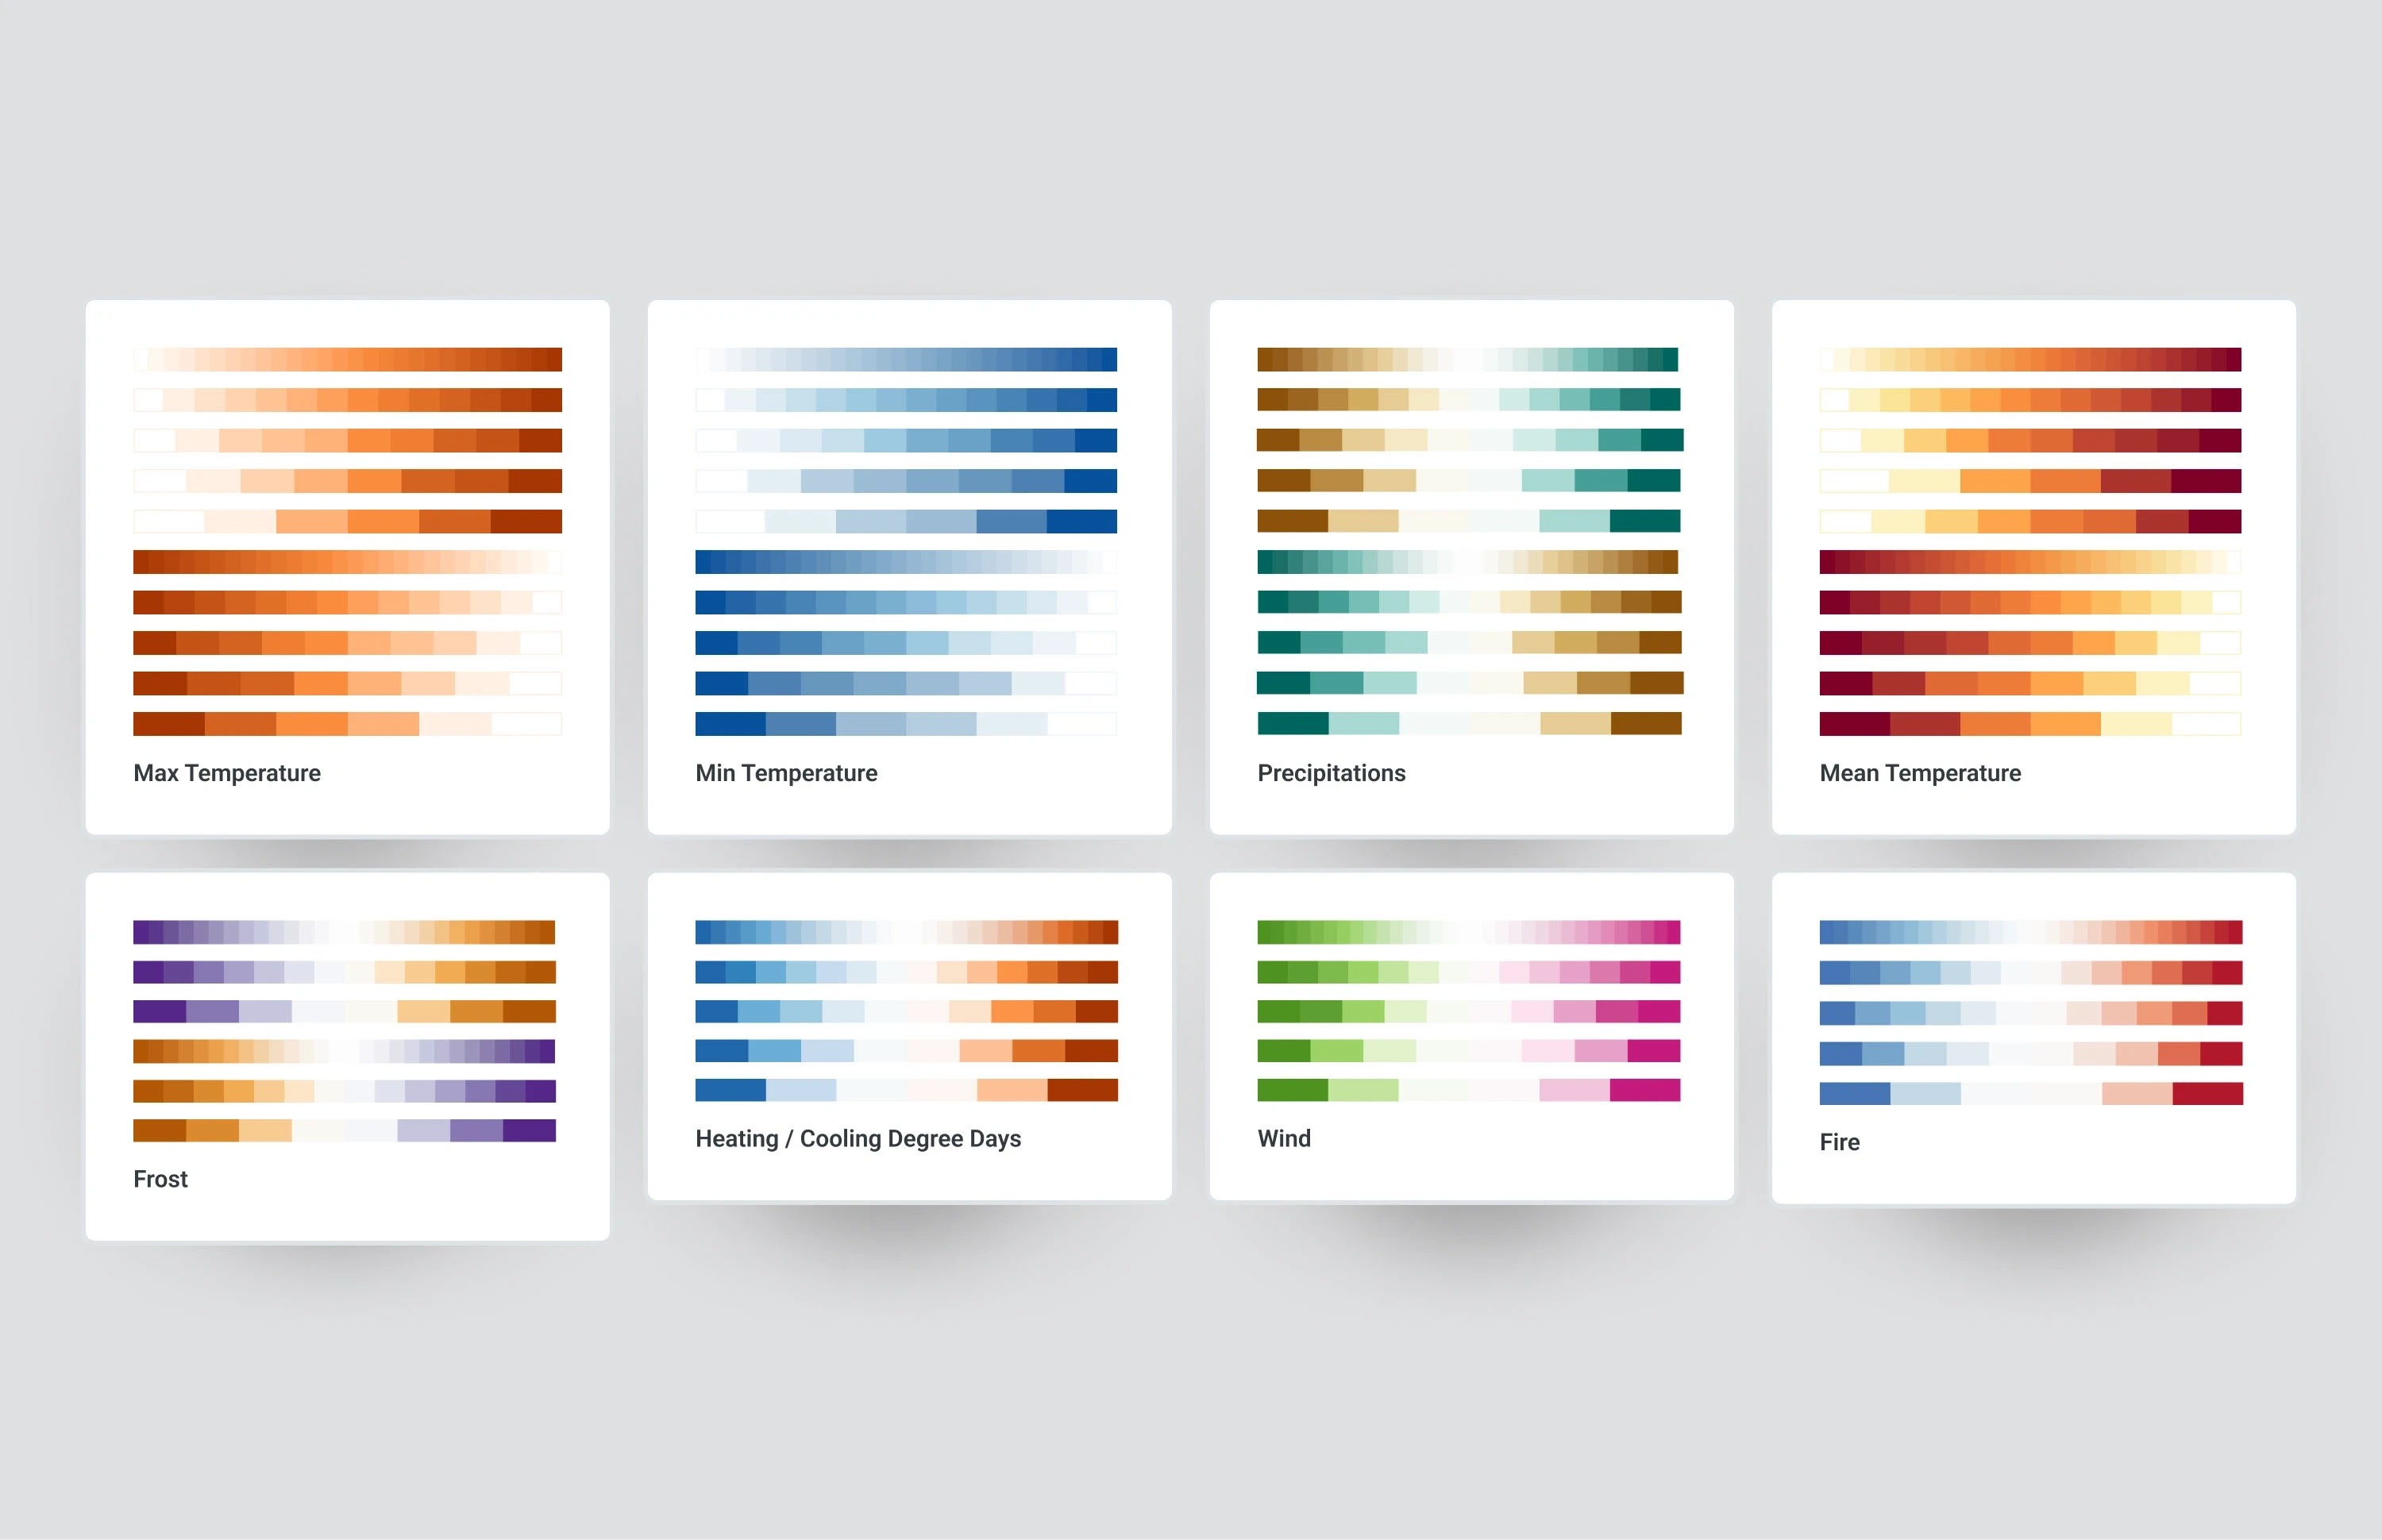
Color bars
The new color bars are designed to scale up to 28 shades, supporting both linear and divergent color schemes. Each palette is crafted to meet accessibility standards, ensuring sufficient contrast and clarity for users with visual impairments.
Client
CMCC Foundation
UX/UI Design, Maps, User testing
Cinzia Bongino
Development
Frontend by Upclose Studio.
Back-end, data analysis, and tool updates handled by the CMCC team.
Year
2024
3 likes · 52 views · Jan 28, 2026
Redesign of an advanced climate data platform for better user experience, map visualization, and services.
Timeline
Jan 1, 2024 - Dec 31, 2024
Tags


Collaborators
