Transit Density
📈 Walter Jenkins
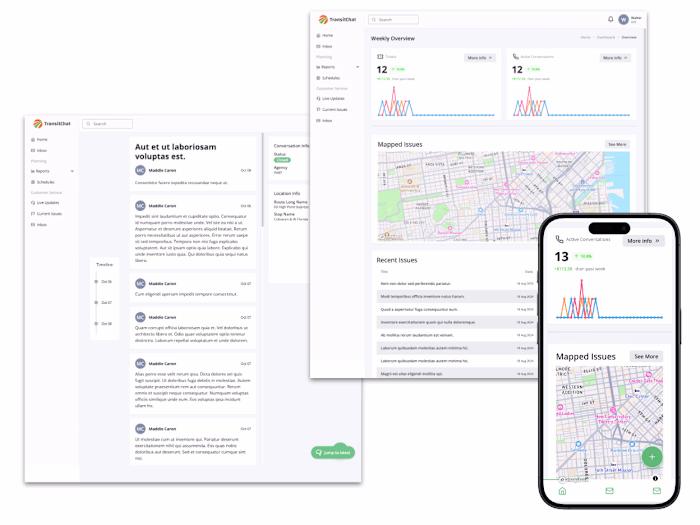
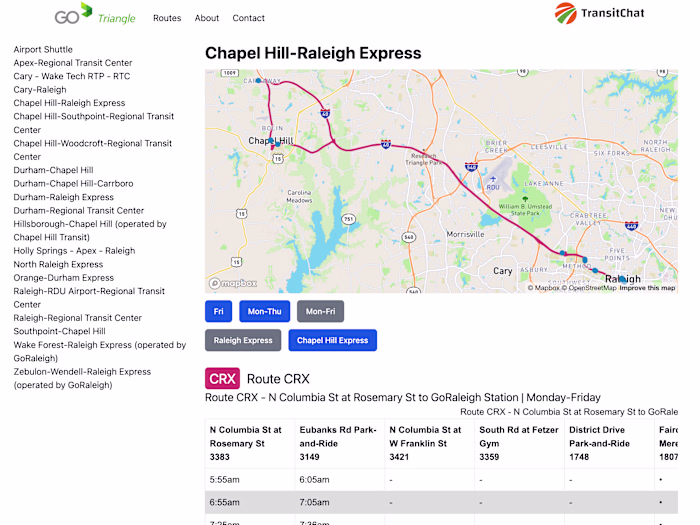
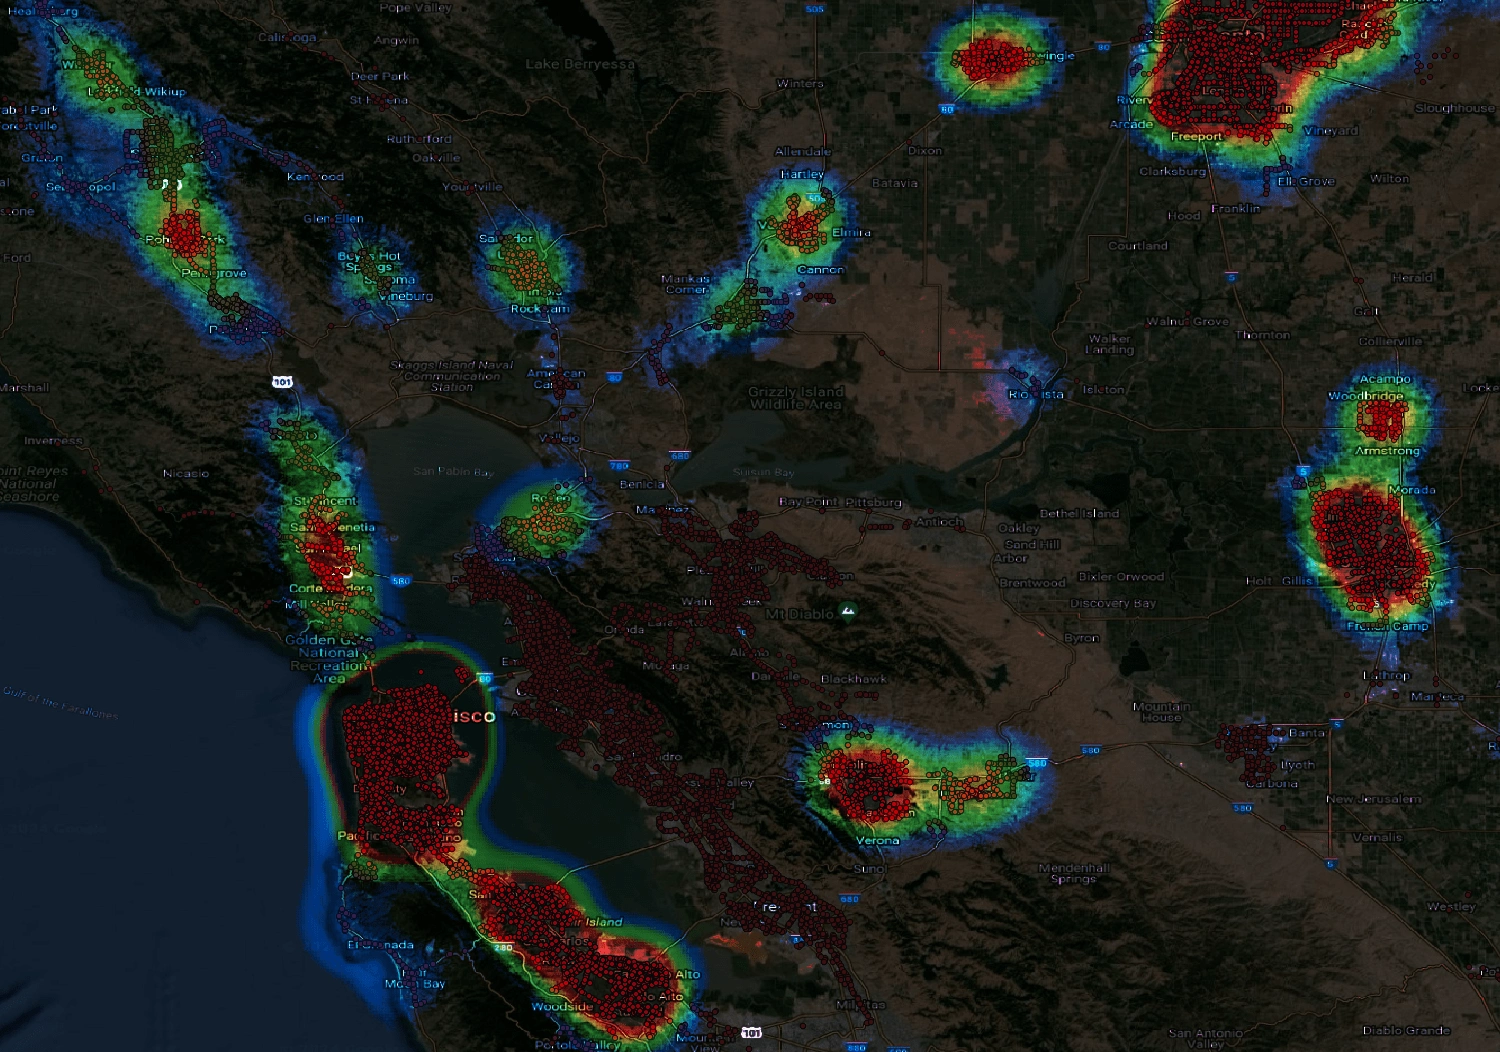
I developed a way to calculate out multiple transit agency transit feeds into a simple to visualize transit heatmap of the the State of California in 3 minutes automating an analysis that would have taken days done manually. This analysis would allow anyone with a list of transit feeds to develop an analysis that looks at how many times a group of transit agencies stop at a particular location over the course of a day and show how often transit is accessible there. This video shows off how simple it was for me to run this analysis and visualize this data using QGIS. The end result of this created a GeoJson file that could be displayed in any mapping application like Mapbox, Leaflet or ArcGIS.
Demo
Source Code
Demo
Code
Like this project
Posted Sep 13, 2024
An automated analysis for mapping out the Transit Density for the State of California went from days to 3 minutes
Likes
0
Views
15