
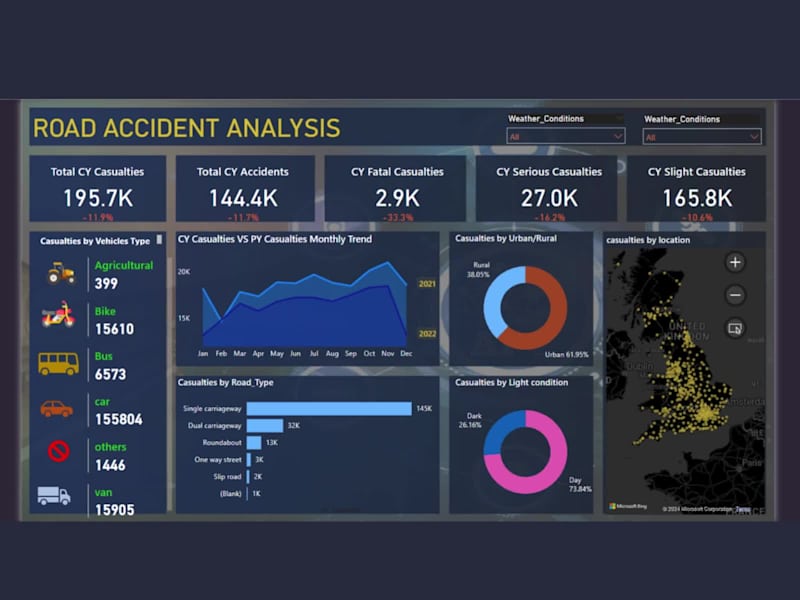
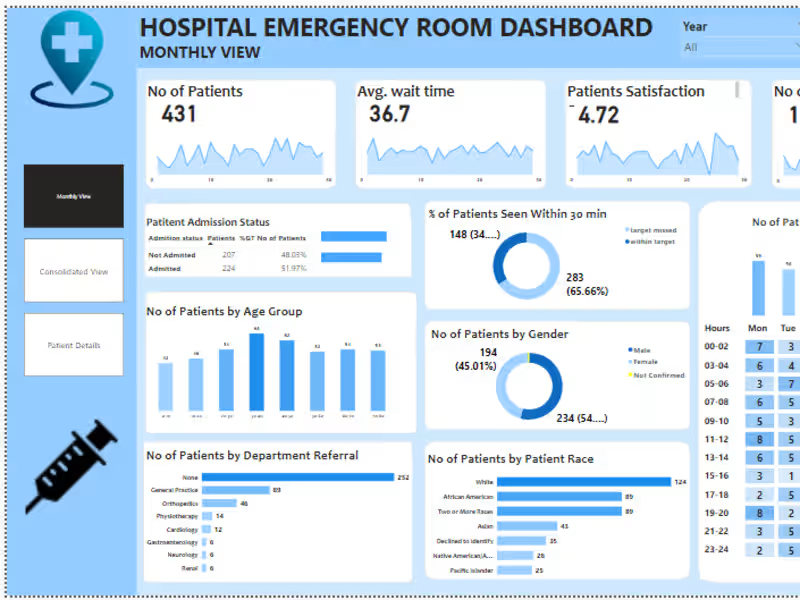
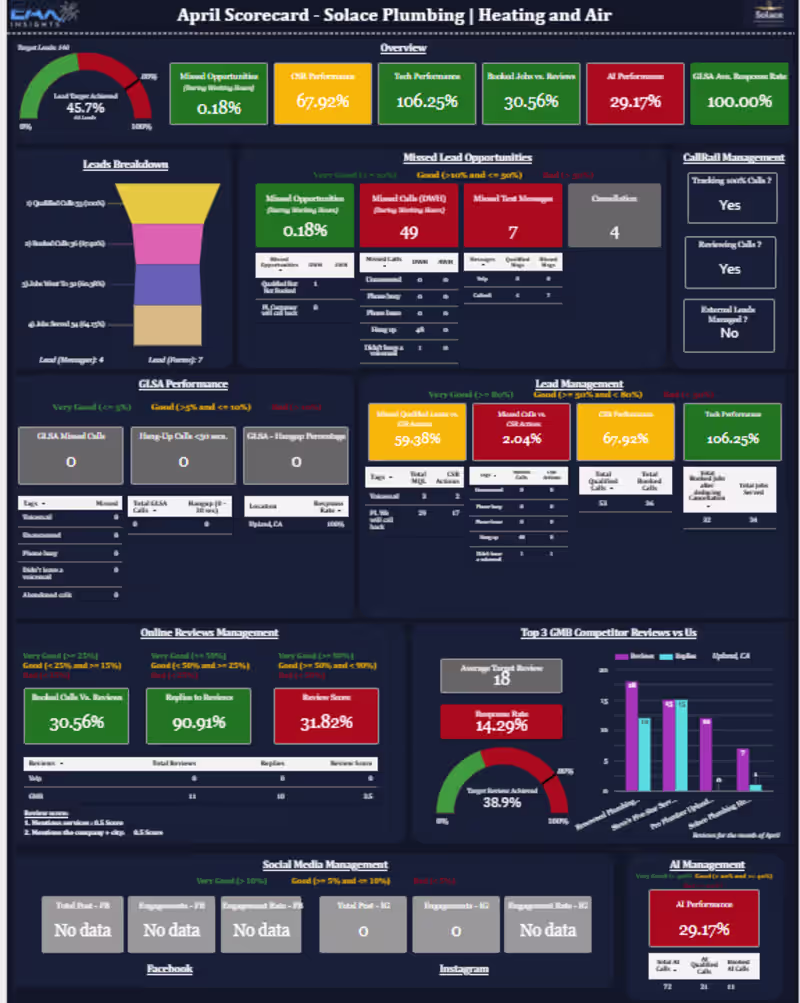
Data visualization engineer, Data Analyst, BI Expert


Business Intelligence Specialist | Power BI & Excel Expert


Digital Content Consultant and Strategist for Growing Brands
Digital Content Consultant and Strategist for Growing Brands

View more →

Social Media, SEO & Compelling Storytelling for Real Results
Social Media, SEO & Compelling Storytelling for Real Results


Chartered Accountant | Tax Expert 💸 | Data Analyst 📊
Chartered Accountant | Tax Expert 💸 | Data Analyst 📊


View more →

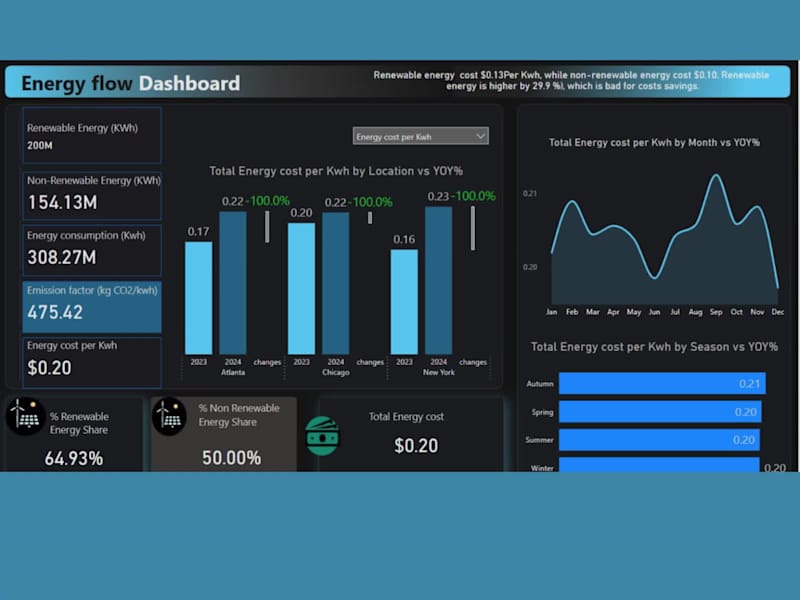
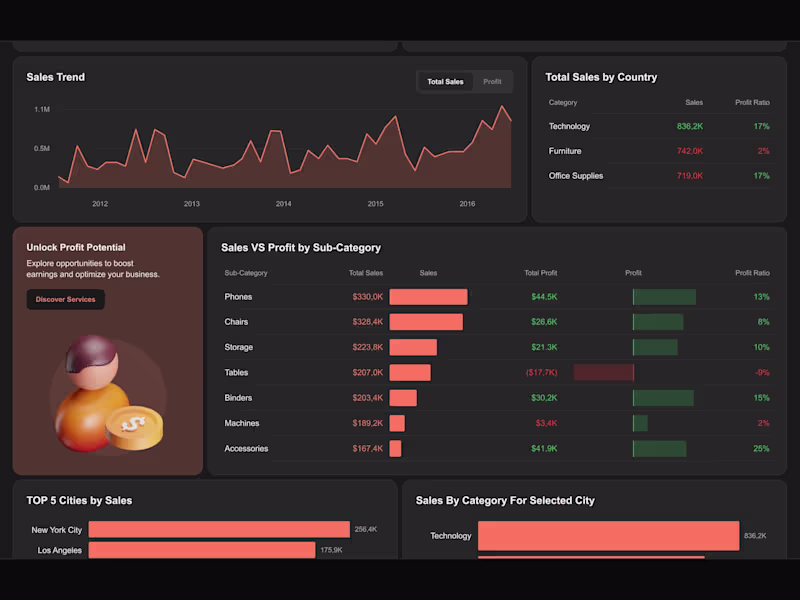
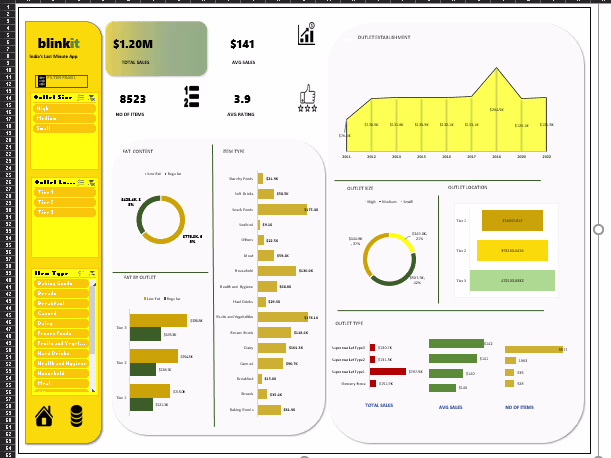
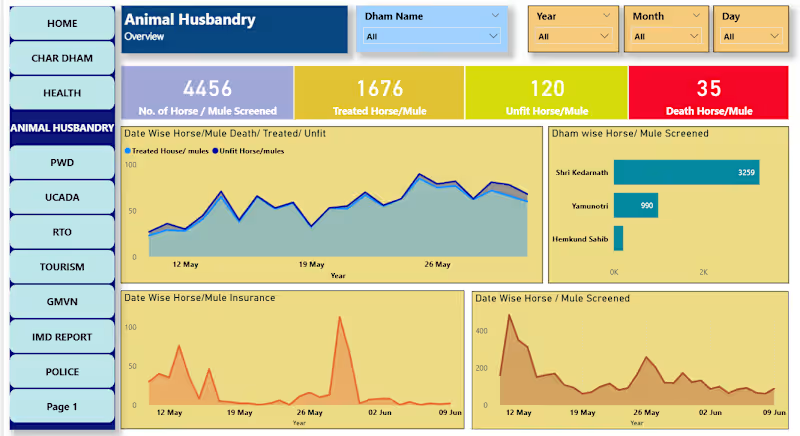
Data Analysis & Visualization Expert
Data Analysis & Visualization Expert

View more →
Researcher, Scientifically restless.
Researcher, Scientifically restless.


View more →

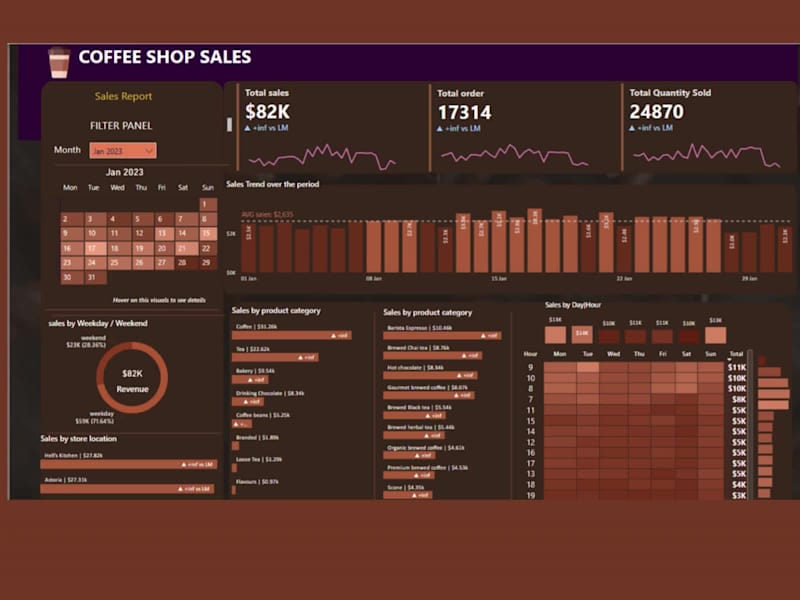
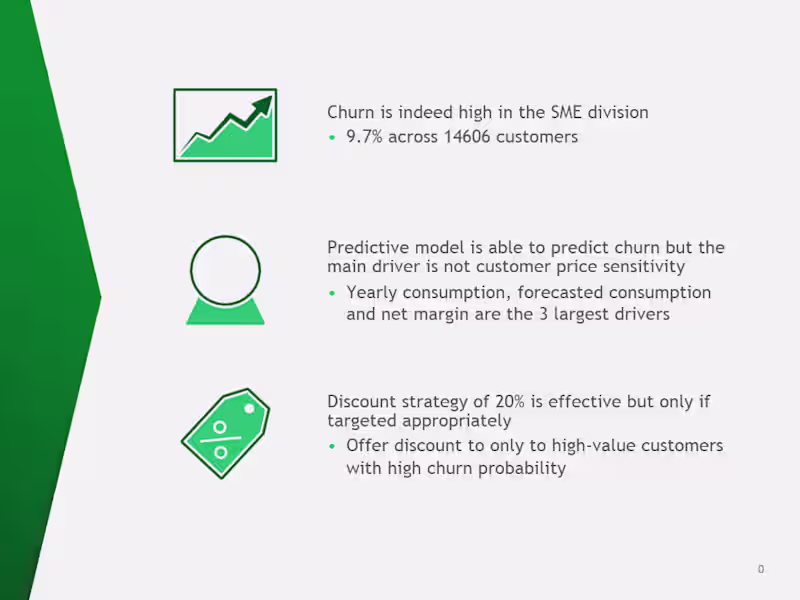
Creative in data storytelling, ML models & insights
Creative in data storytelling, ML models & insights
View more →