Char Dham Yatra Data Analysis Dashboard
Muskan
Char Dham Yatra Freelance Project, Remote (Dec 2024 - Mar 2025)
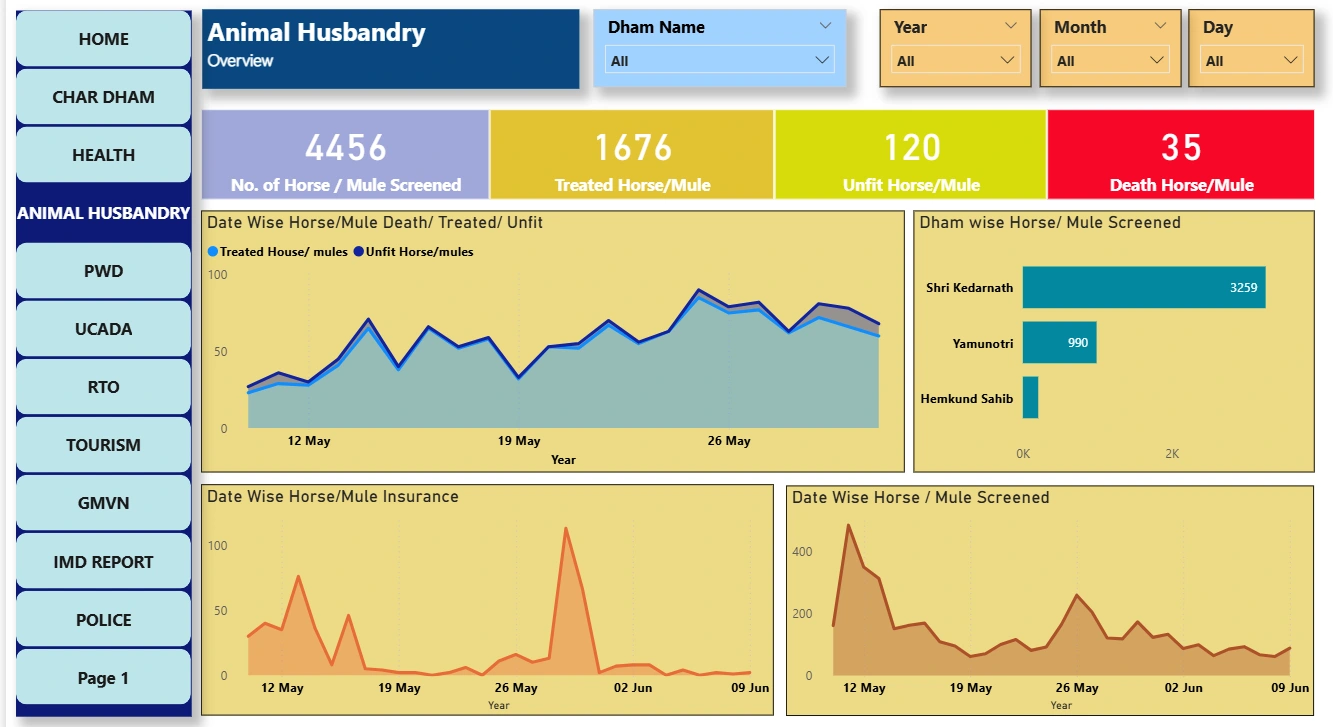
1) Designed and developed an interactive Power BI dashboard to visualize pilgrim data, including total bookings, demographic distribution, and location-wise traffic.
2) Utilized Excel and Power BI for data cleaning, transformation, and analysis, enabling dynamic insights through slicers and filters by site, state, and time period.
3) Delivered actionable insights on peak travel trends and top source regions, supporting informed stakeholder decisions and improving operational planning.
Like this project
Posted May 13, 2025
Designed and developed an interactive Power BI dashboard for Char Dham Yatra data analysis.
Likes
0
Views
4
Timeline
Dec 1, 2024 - Mar 31, 2025