I build AI-powered data apps and dashboards
Data Specialist for Clean, Organized & Smart Reports
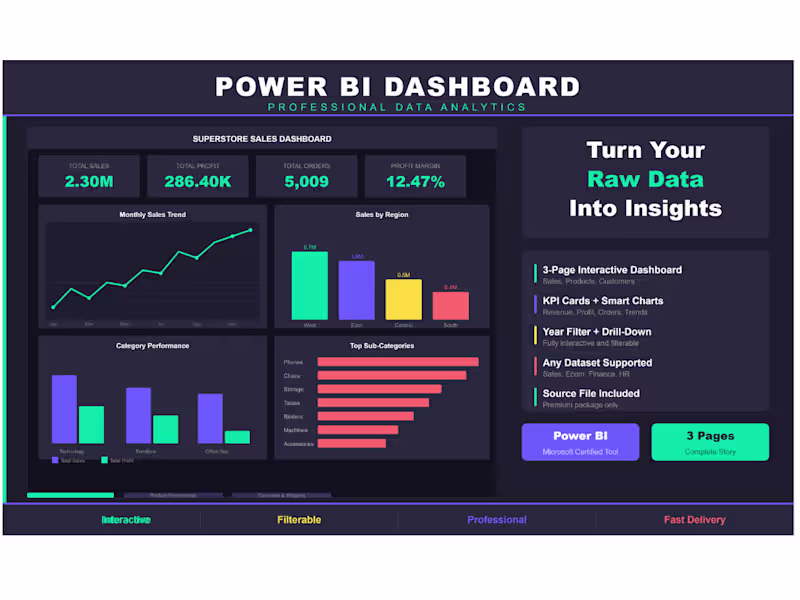
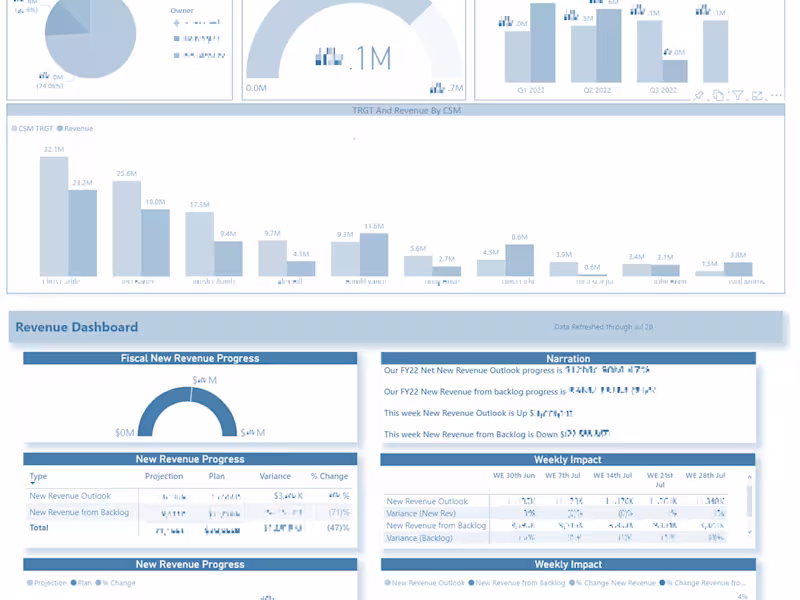
"From Data Chaos to Business Clarity."
"From Data Chaos to Business Clarity."
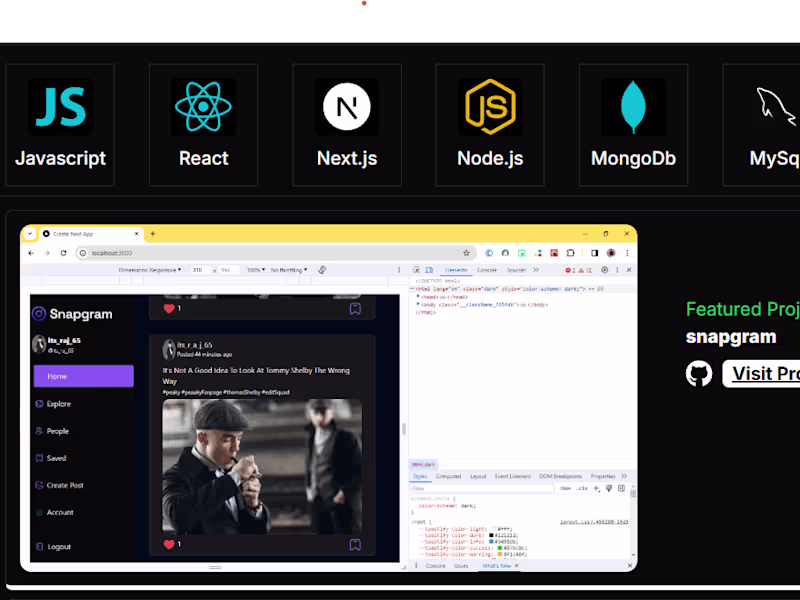
Next.js Full Stack Developer | Data Analyst
Next.js Full Stack Developer | Data Analyst


View more →
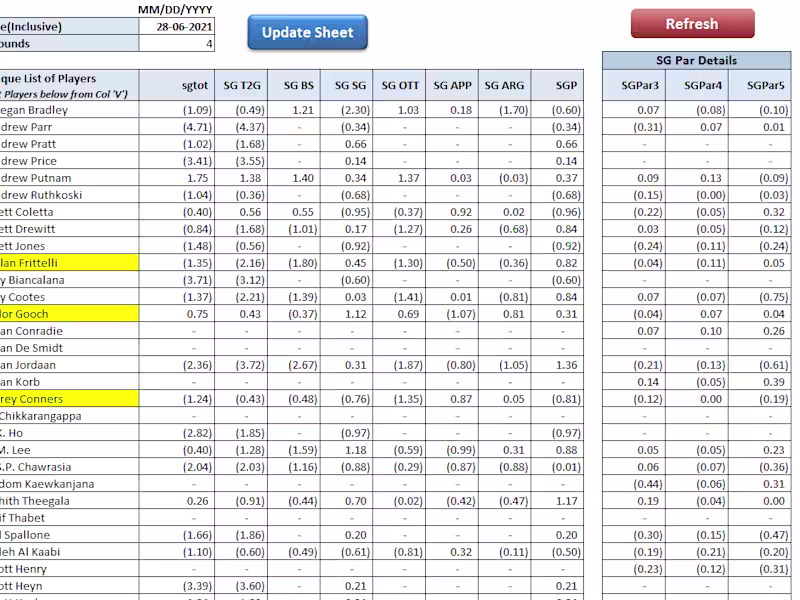
An Excel Expert - Specializing in Data Analysis
An Excel Expert - Specializing in Data Analysis


View more →
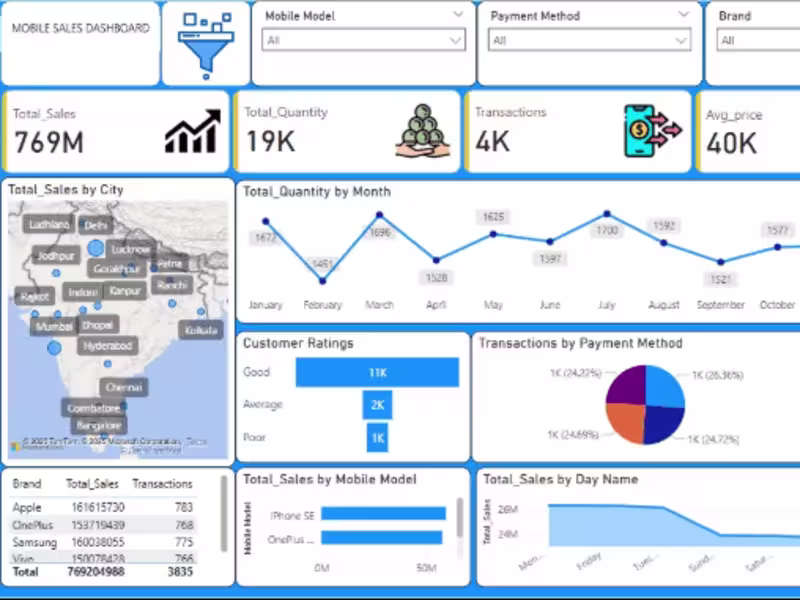
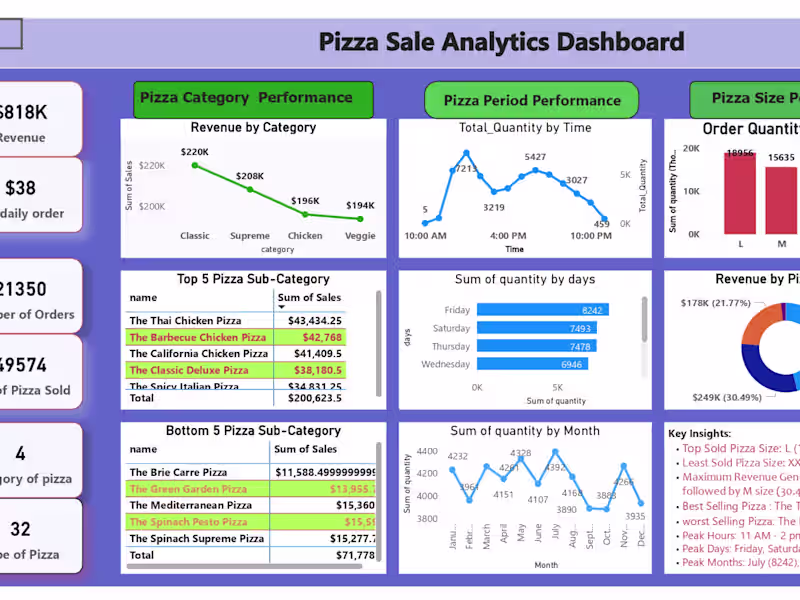
Data Analytics & Visualization Expert 🎯
Data Analytics & Visualization Expert 🎯
Executive Business Partner specializing in Executive support
New to Contra
Executive Business Partner specializing in Executive support
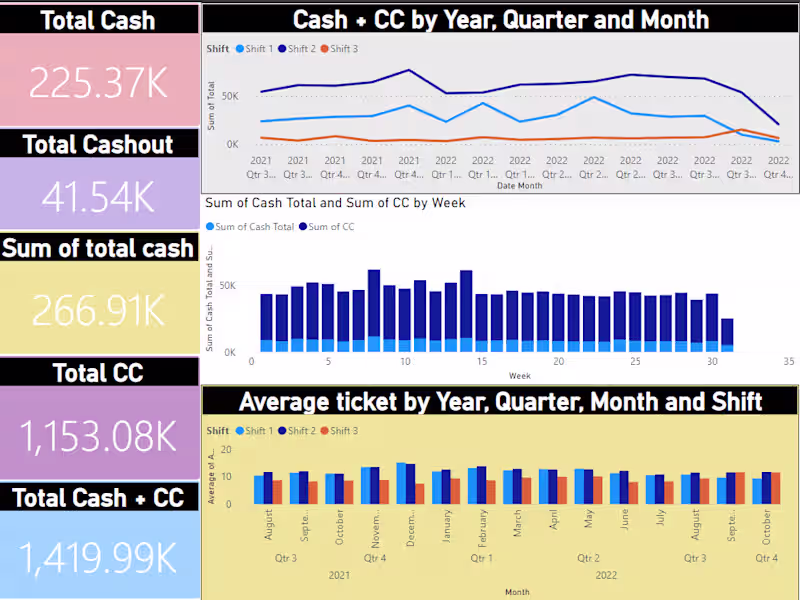
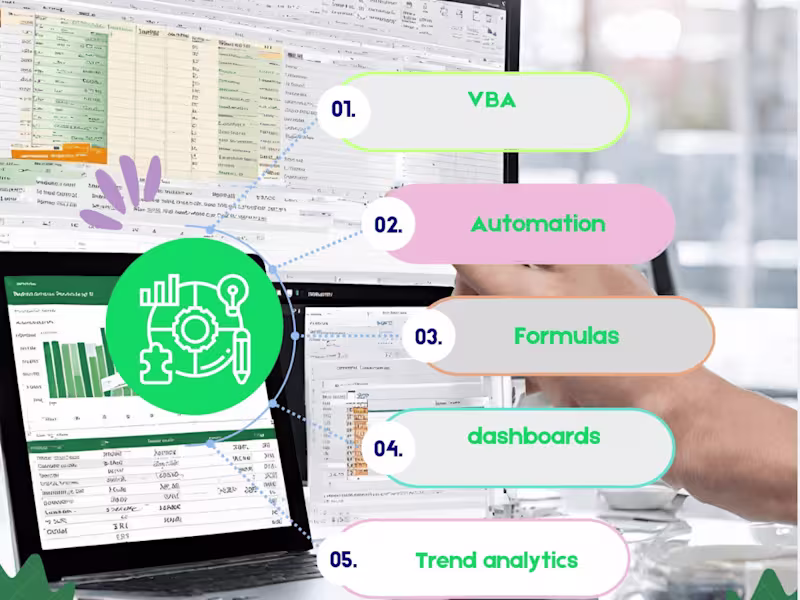
Data Science/Analysis, Excel, Python, Power Bi, Scikit learn
Data Science/Analysis, Excel, Python, Power Bi, Scikit learn