Sales, Customer & Marketing Analytics Dashboard Project
Abu Aasif Ansari
📊 Case Study: Sales, Customer & Marketing Analytics Dashboard
🔍 Problem
Businesses often struggle because sales data, customer behavior, and marketing performance live in separate systems.
This makes it difficult to answer simple but critical questions:
Where is revenue coming from?
Who are our best customers?
Is marketing spend actually profitable?
The goal was to bring Sales, Customers, and Marketing insights into one reliable system.
🛠️ Solution
I designed and built a 3-page Power BI analytics system that connects cleaned and structured datasets into a single source of truth.
The solution includes:
A structured data model
Cleaned and standardized datasets
Business-focused KPIs
Clear, decision-ready dashboards
📄 Dashboard Breakdown
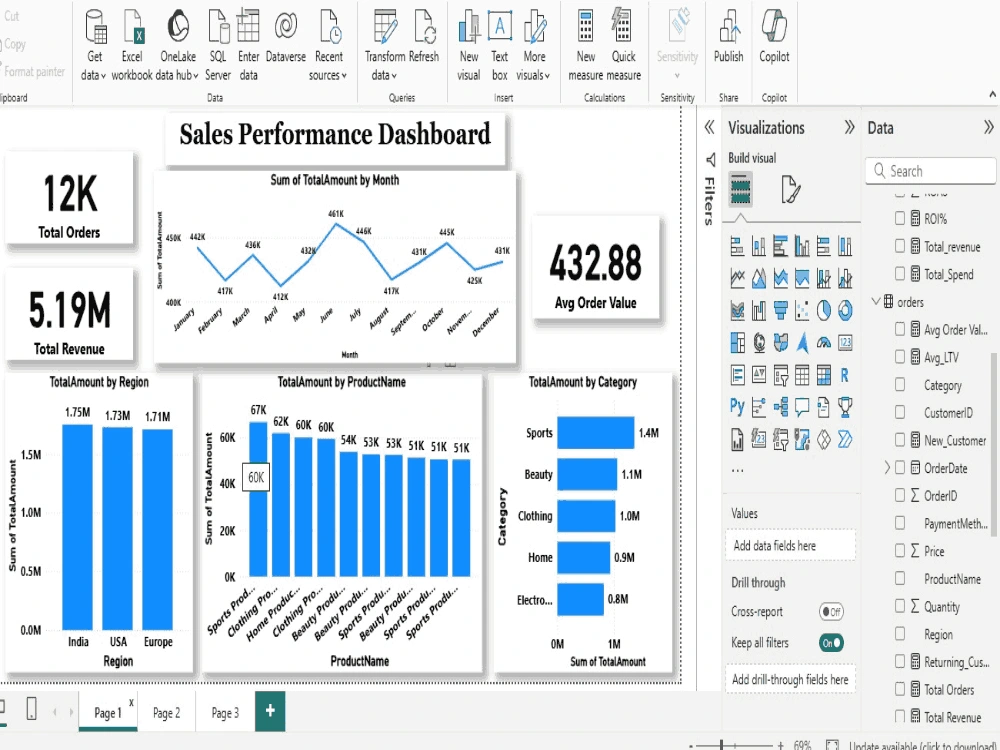
1️⃣ Sales Overview
Focused on understanding revenue drivers:
Monthly sales trends
Top-performing products and categories
Total Sales, Orders, and Average Order Value
Region-wise revenue contribution
Payment method analysis
👉 Helped identify growth areas and underperforming segments.
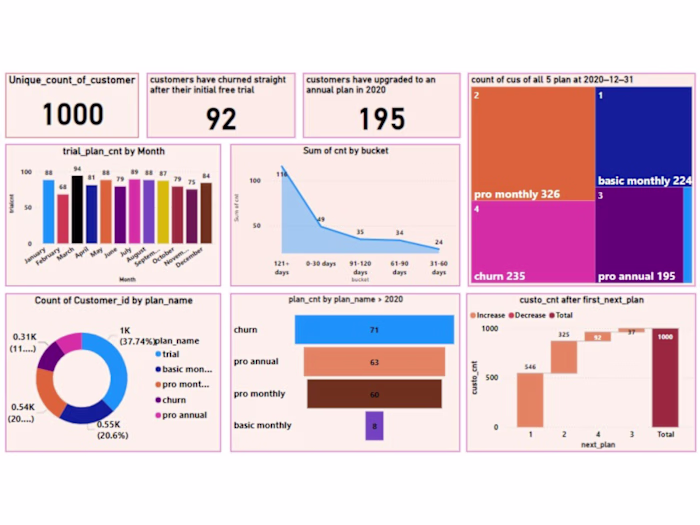
2️⃣ Customer Insights
Analyzed customer behavior and retention:
Total customers
New vs Returning customers
Customer Lifetime Value (LTV) by region
Repeat purchase behavior using DAX-based measures
👉 Provided clarity on customer loyalty and long-term value.
3️⃣ Marketing Performance
Measured ROI across marketing channels:
Paid Ads
Social Media
Referral
Influencer / UGC
Email
Offline campaigns
👉 Highlighted high-ROI channels and areas of wasted spend.
🧰 Tools & Technologies
Power BI – Data modeling & visualization
SQL – Data preparation and joins
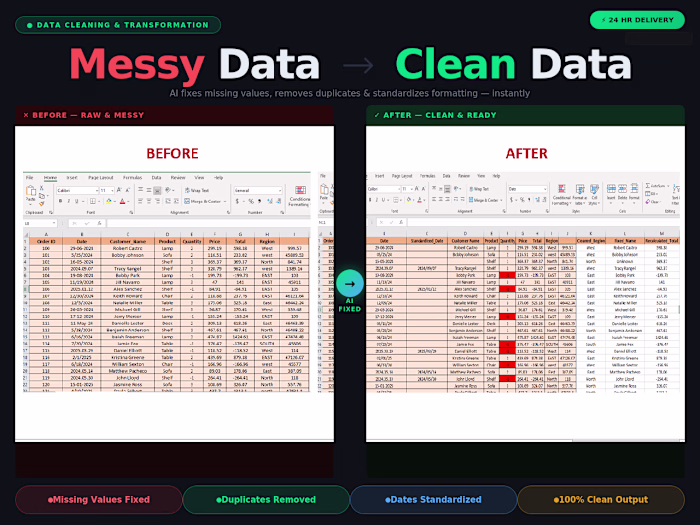
Python – Data cleaning & preprocessing
DAX – Business logic and measures
CSV datasets – Source data
💡 Key Takeaways
This project reinforced that dashboards are not just visuals — they are decision-making tools.
When sales, customer, and marketing data are analyzed together, businesses gain clarity faster and act smarter.
🚀 Outcome
Unified analytics system
Clean and scalable data pipeline
Actionable insights for sales, retention, and marketing strategy
🤝 How This Helps Clients
If you're dealing with:
Inconsistent data
Disconnected reports
Unclear marketing ROI
Dashboards that don’t reflect reality
I help clean, structure, and transform raw data into reliable analytics systems.
#Data Analytics
#Power BI
#Business Intelligence
Like this project
Posted Jan 10, 2026
Designed a Power BI dashboard unifying sales, customer, and marketing data.
Likes
1
Views
8