


What experience should we seek in a Matplotlib expert?
Clients should look for a freelancer with a strong background in creating visualizations using Matplotlib. This includes experience in crafting detailed charts, graphs, and animated plots. They should also have a history of successful data visualization projects.
What skills are important for a Matplotlib freelancer?
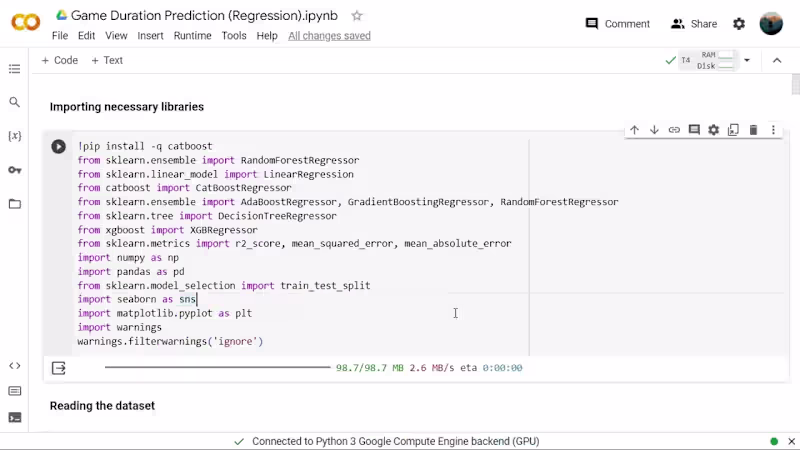
Look for a freelancer who is proficient in Python and understands data analysis principles. They should possess technical skills in Matplotlib and be able to communicate data-driven insights effectively. Additionally, skills in other visualization libraries can be a bonus.
How can a Matplotlib expert contribute to our project?
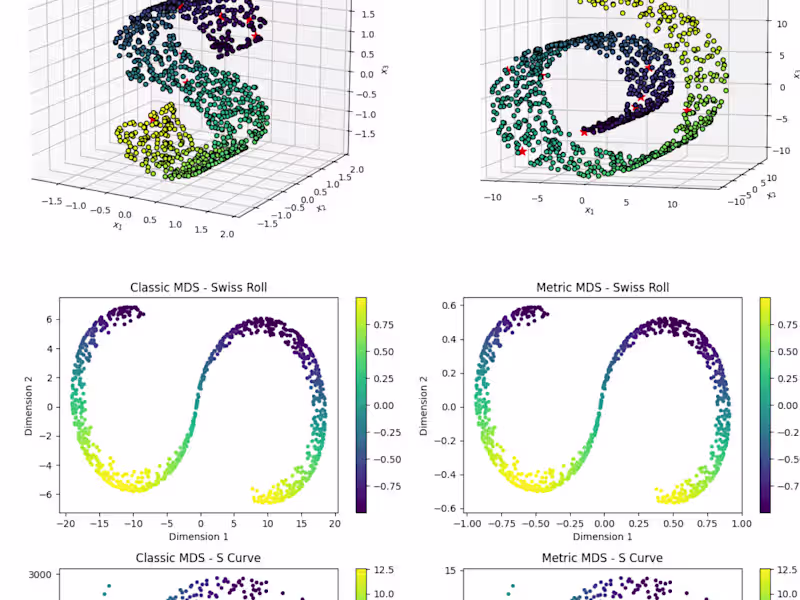
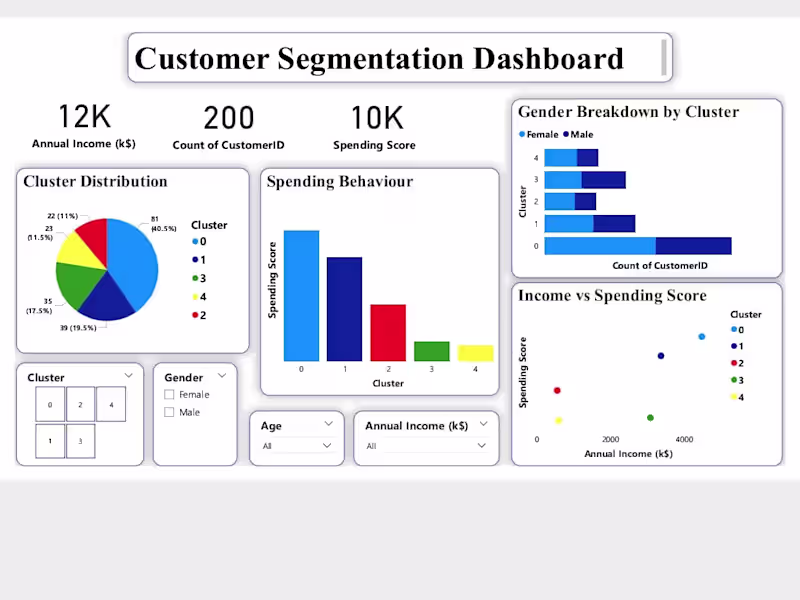
A Matplotlib expert can create clear and compelling visuals to represent your data. They help in making complex data easy to understand using graphs and charts. This visibility can aid in decision-making and provide insights into trends and patterns.
What type of projects can benefit from Matplotlib?
Any project needing data analysis and visualization can benefit from Matplotlib. This includes research, reporting, and presenting data insights. Visual representation helps in communicating findings clearly and effectively.
How should we define project deliverables with a Matplotlib freelancer?
Explicitly outline the type of data visualizations needed. Specify whether you need static charts, interactive plots, or both. Clearly communicate the project's goals and how visualizations will be used.
How important is collaboration in hiring a Matplotlib expert?
Collaboration ensures your needs are understood and met throughout the project. Regular discussions and feedback help in refining deliverables. A collaborative approach leads to better alignment and successful project outcomes.
What tools might complement Matplotlib in a project?
Other tools like Pandas for data manipulation and NumPy for numerical data can complement Matplotlib. They help in preparing and organizing data before visualization. Seeking a freelancer familiar with these tools can enhance the project's outcome.
How do we ensure high-quality visualization output?
Set clear expectations about the quality and style of visualizations. Request samples of past work and discuss the level of detail you need. Regular check-ins and reviews during the project can ensure quality is maintained.
What can enhance the effectiveness of Matplotlib visualizations?
Using color and design effectively makes visualizations stand out. Ensure the expert understands the importance of readability and accuracy. The goal is to make data easily digestible for your target audience.
Who is Contra for?
Contra is designed for both freelancers (referred to as "independents") and clients. Freelancers can showcase their work, connect with clients, and manage projects commission-free. Clients can discover and hire top freelance talent for their projects.
What is the vision of Contra?
Contra aims to revolutionize the world of work by providing an all-in-one platform that empowers freelancers and clients to connect and collaborate seamlessly, eliminating traditional barriers and commission fees.