AI Automation & Business Systems Expert | Make.com, Zapier
AI Automation & Business Systems Expert | Make.com, Zapier
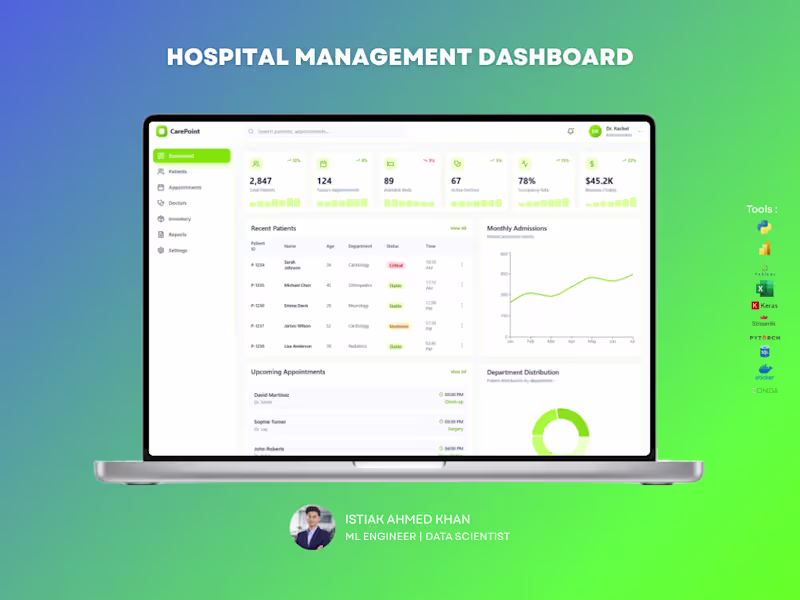
AI System Architect | Database Expert | Data Analyst
- $25k+
- Earned
- 1x
- Hired
- 5.0
- Rating
- 65
- Followers
AI System Architect | Database Expert | Data Analyst
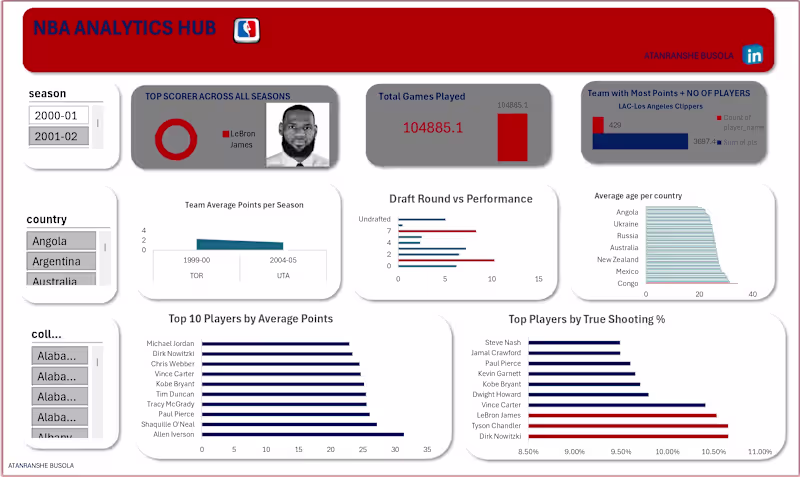
Power BI Consultant & Analyst


Power BI Data Analyst + ML AI Automation Expert
- 5.0
- Rating
- 101
- Followers
Power BI Data Analyst + ML AI Automation Expert

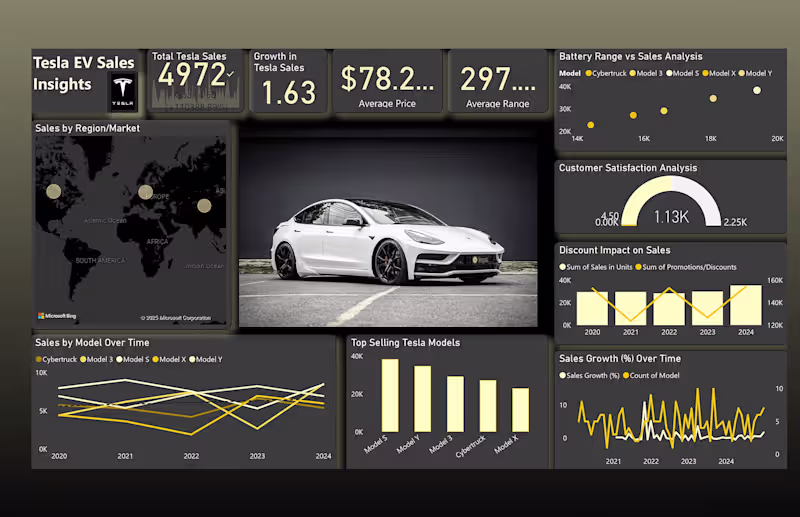
Content Strategist | Research-Backed Growth| Architect
- 1x
- Hired
- 5.0
- Rating
- 28
- Followers
Content Strategist | Research-Backed Growth| Architect
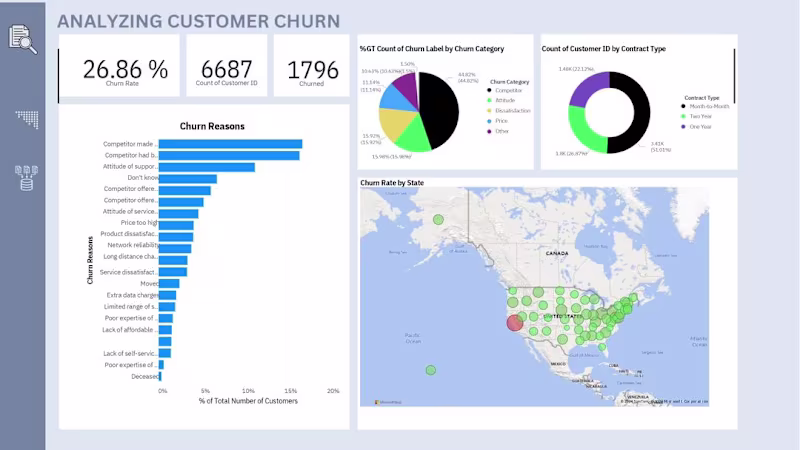

Bridging the gap between data analysis and market
- $50k+
- Earned
- 1x
- Hired
- 5.0
- Rating
- 22
- Followers
Bridging the gap between data analysis and market

Optimising businesses with data and business intelligence.
- 16
- Followers
Optimising businesses with data and business intelligence.


Data visualization expert for actionable insights
- $25k+
- Earned
- 1x
- Hired
- 26
- Followers
Data visualization expert for actionable insights

View more →