AI Developer | Automations Engineer | Data Analyst
AI Developer | Automations Engineer | Data Analyst

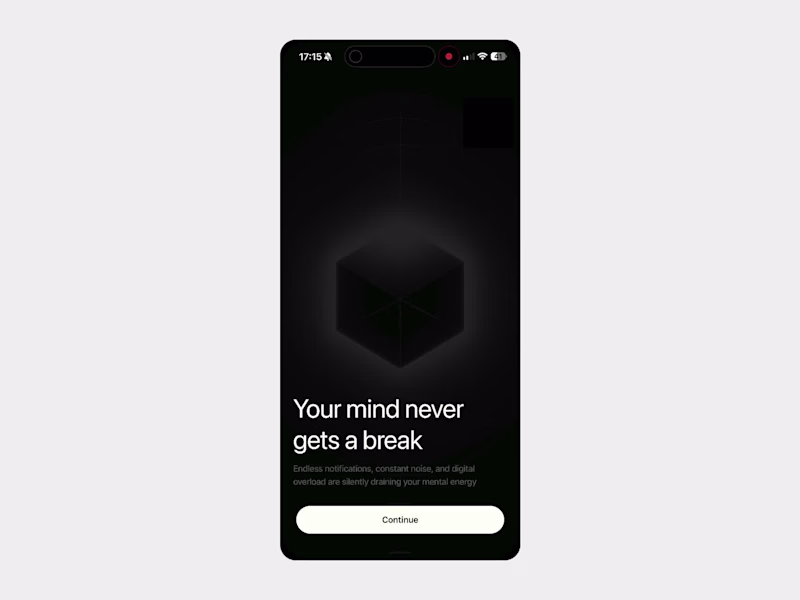
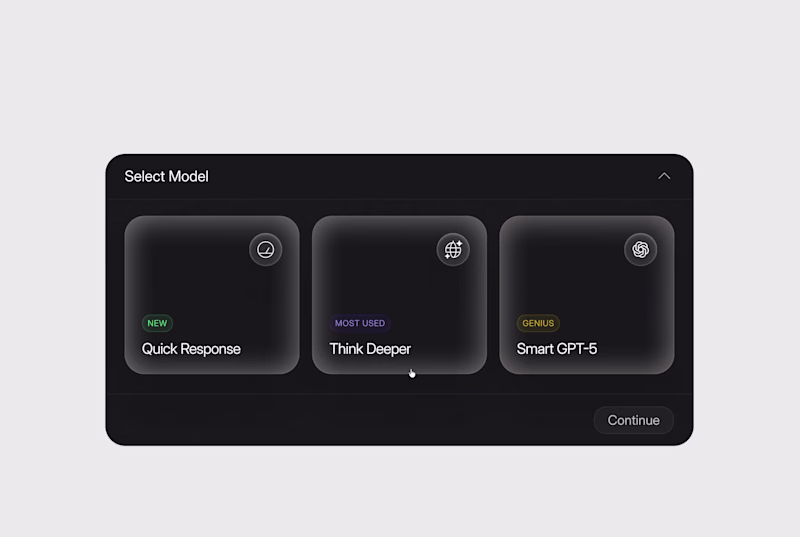
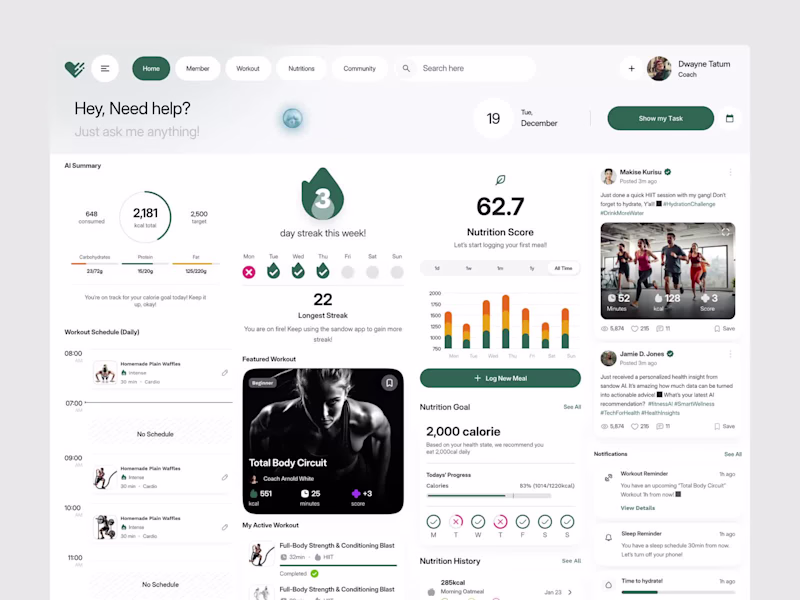
UI & Product Design Expert
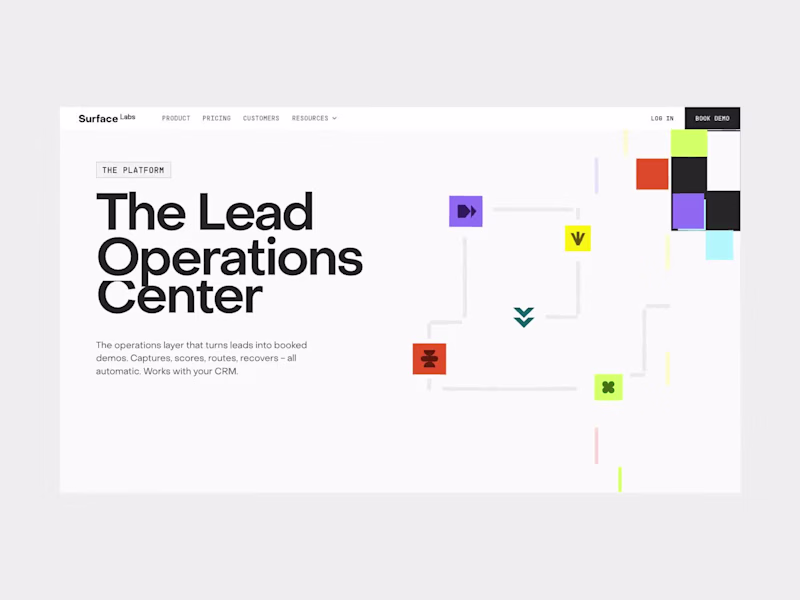
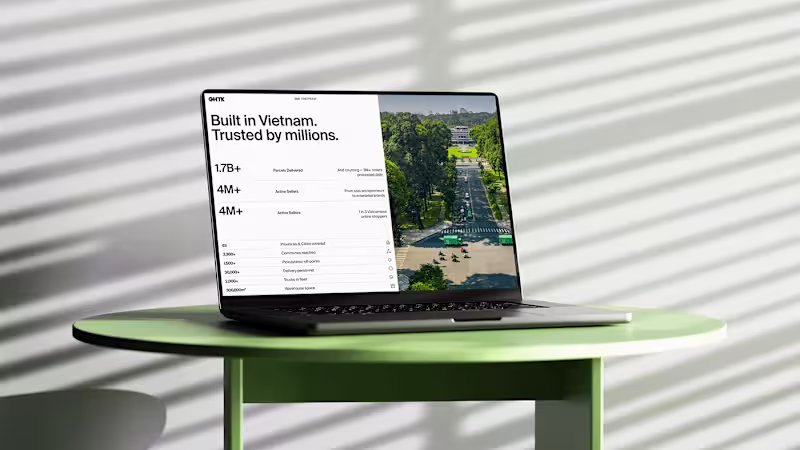
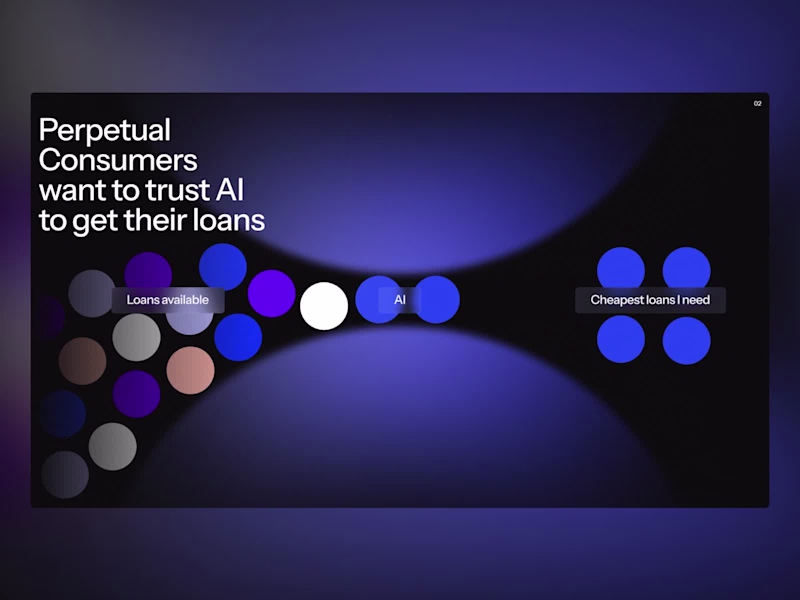
Web Design Studio | Framer, Webflow & AI Solutions
Web Design Studio | Framer, Webflow & AI Solutions
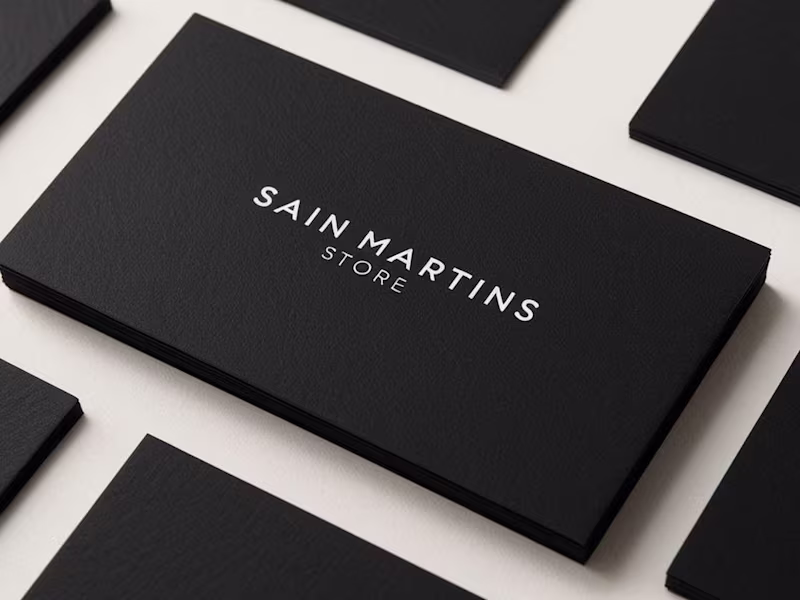
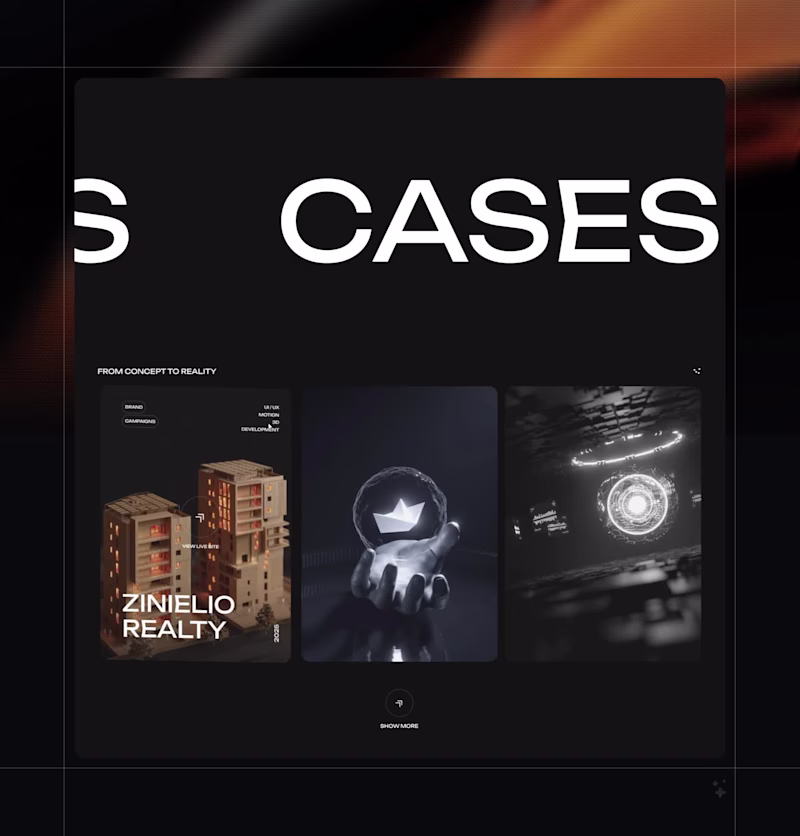
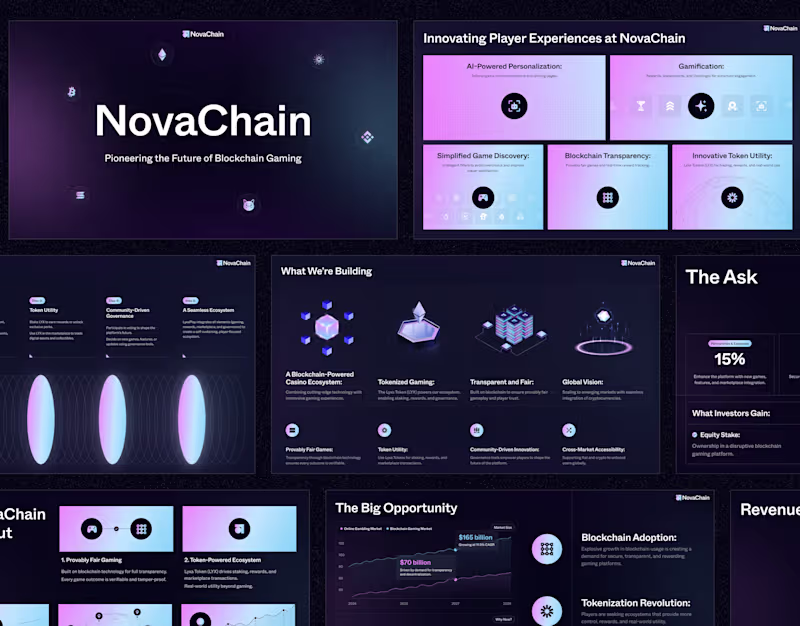
Visual & Presentation Design Studio
- $25k+
- Earned
- 5x
- Hired
- 5.0
- Rating
- 35
- Followers
Visual & Presentation Design Studio

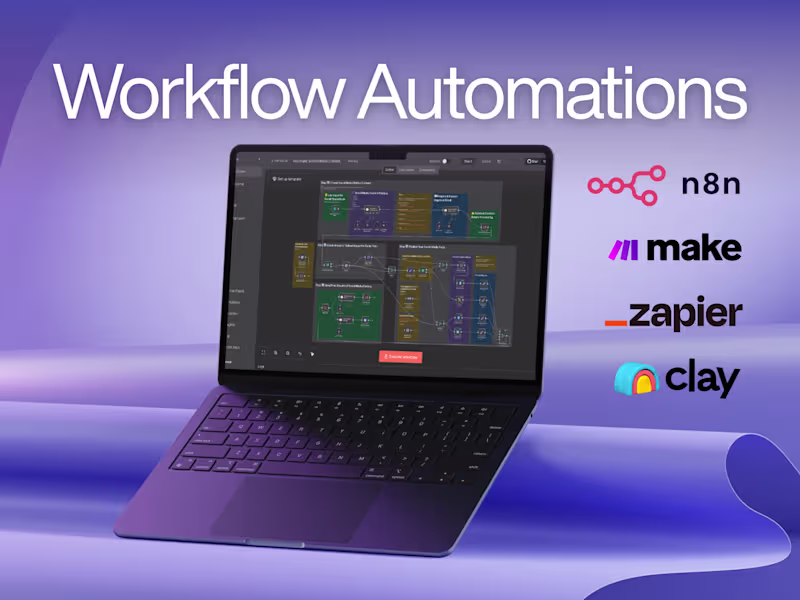
AI Automation & Business Systems Expert | Make.com, Zapier
AI Automation & Business Systems Expert | Make.com, Zapier
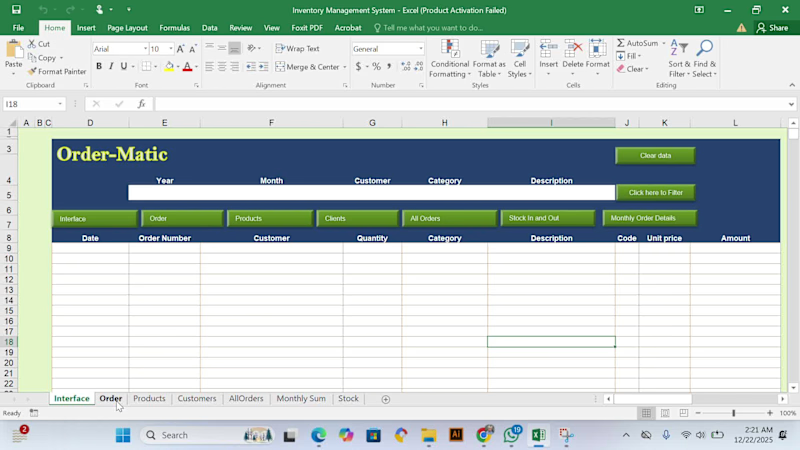


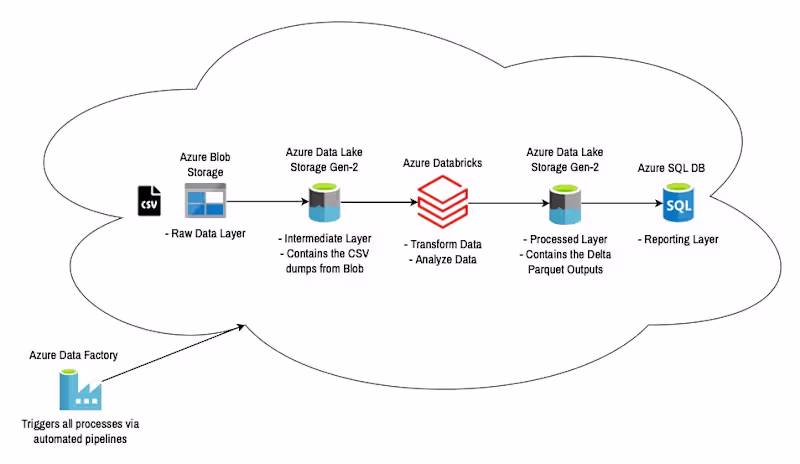
AI System Architect | Database Expert | Data Analyst
- $25k+
- Earned
- 1x
- Hired
- 5.0
- Rating
- 65
- Followers
AI System Architect | Database Expert | Data Analyst
UX-led product design & dev agency for b2b saas and AI
UX-led product design & dev agency for b2b saas and AI
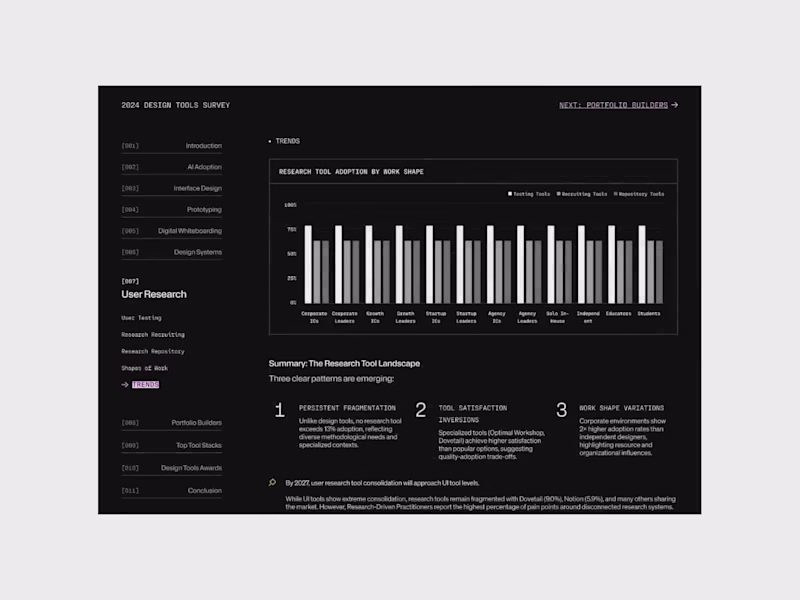
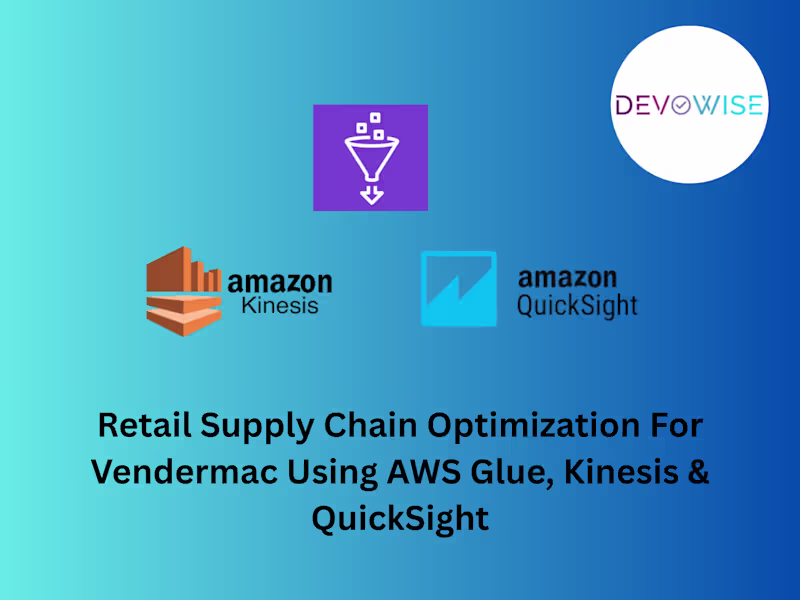
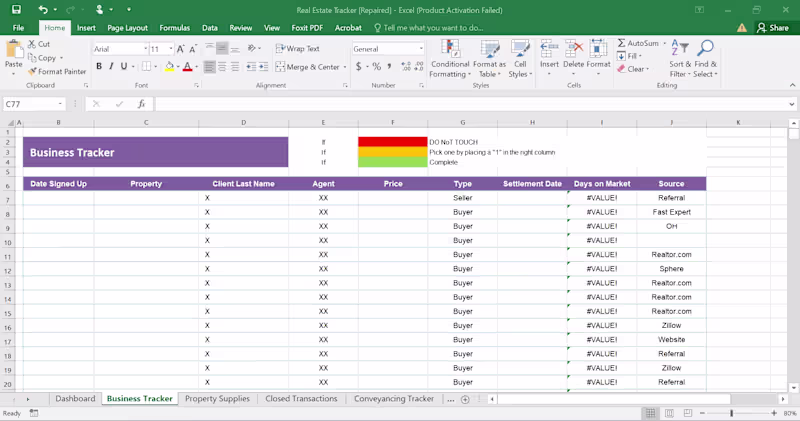
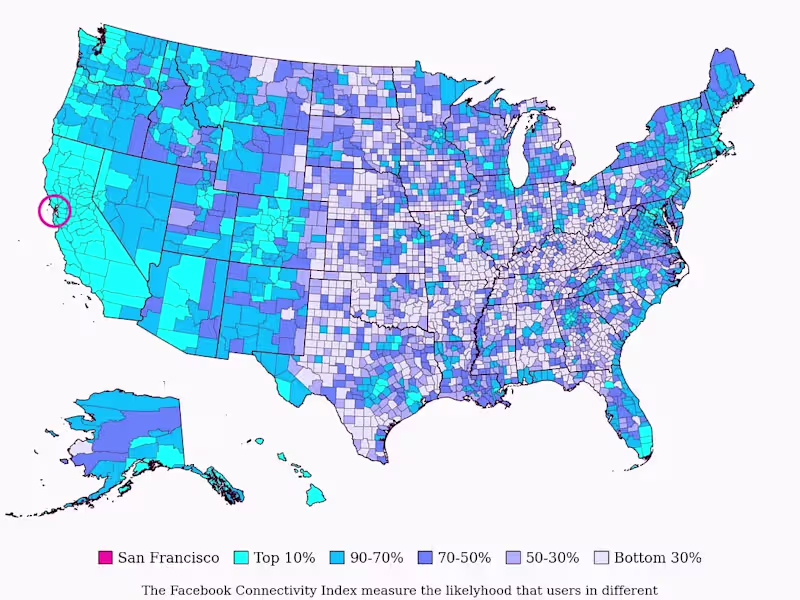
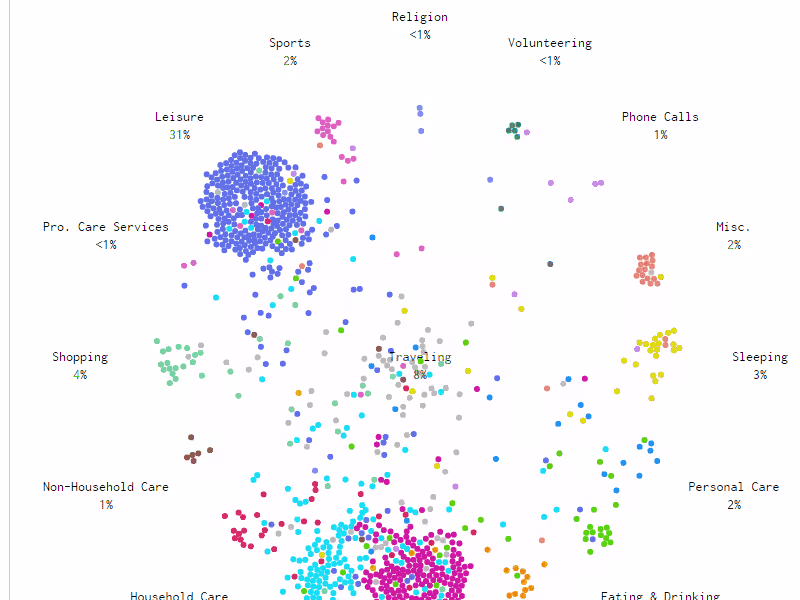
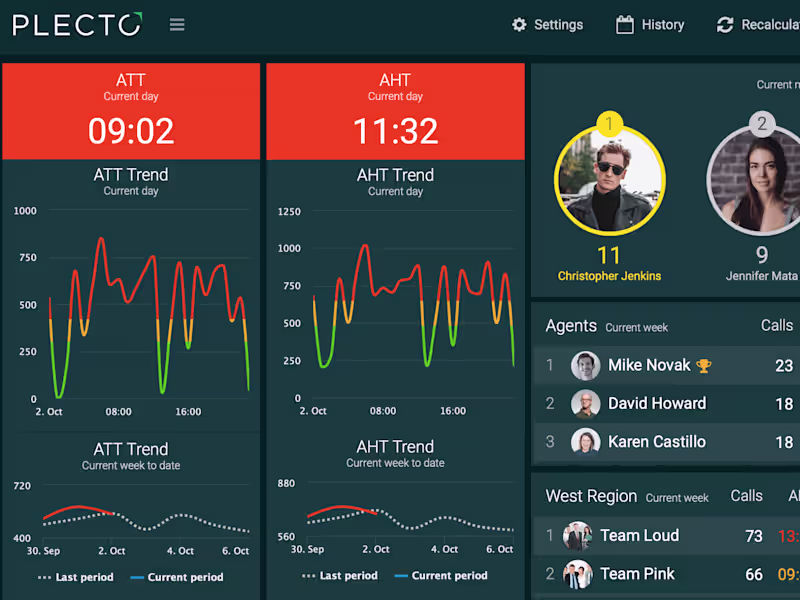
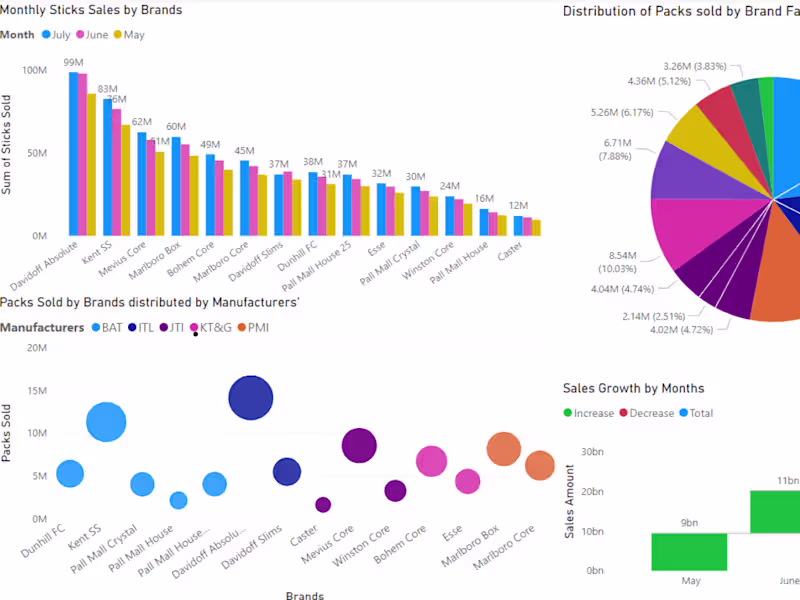
Analytics Specialist and Data Visualizer
- $1k+
- Earned
- 3x
- Hired
- 5.0
- Rating
- 36
- Followers
Analytics Specialist and Data Visualizer