San Martin Stores – Sales Analytics & Performance Dashboard
Devowise Studios
San Martin Stores — Transforming Sales Data into Actionable Business Intelligence
Overview
At Devowise Studios, we designed the San Martin Stores Sales Analytics Dashboard, a comprehensive business intelligence solution that transforms raw sales data into meaningful insights. Built with a focus on clarity, usability, and decision-making, the dashboard enables businesses to monitor performance, understand customer behavior, and identify opportunities for sustainable growth.
By combining interactive data visualization with automated data processing, we created a centralized reporting experience that empowers stakeholders to make faster, data-driven decisions without navigating complex spreadsheets or disconnected reports.
The Challenge
Businesses often manage large volumes of sales data spread across multiple systems, making it difficult to extract meaningful insights quickly. Decision-makers require accurate, real-time reporting to understand performance trends and respond effectively to changing business conditions.
Our objective was to create a dashboard that would:
Consolidate sales and operational data into a single reporting platform.
Present complex business metrics through intuitive visualizations.
Enable stakeholders to monitor KPIs in real time.
Improve visibility into customer behavior and product performance.
Build a scalable analytics solution capable of supporting future business growth.
Project Objectives
To achieve these goals, we focused on:
Creating an intuitive and interactive analytics experience.
Simplifying complex datasets through effective data visualization.
Providing real-time insights into sales, profitability, and operational performance.
Supporting strategic decision-making with accurate business metrics.
Developing a scalable reporting solution that can evolve alongside business needs.
Our Role
Our team managed the project from data analysis through dashboard development, including:
Business Intelligence Strategy
Data Analysis
KPI Planning
Dashboard Architecture
Data Visualization
SQL Data Modeling
Data Processing & Automation
Performance Optimization
Reporting & Analytics Design
Our Process
1. Discovery & Analytics Strategy
We began by identifying the key business metrics that stakeholders rely on for daily decision-making. This included understanding reporting requirements, sales workflows, customer lifecycle data, and operational processes.
Our strategy focused on transforming large datasets into actionable insights that could be understood at a glance while still allowing users to explore deeper performance trends when needed.
The reporting experience was structured around a simple workflow:
Monitor → Analyze → Identify Trends → Make Better Decisions
2. Data Architecture & Processing
A well-structured data foundation was essential for delivering reliable insights. We organized and processed data from multiple sources to ensure consistency, accuracy, and efficient reporting.
Automated data preparation reduced manual reporting efforts while improving data quality and enabling faster dashboard updates.
3. Dashboard Design
The dashboard was designed with clarity and usability as top priorities. Rather than overwhelming users with excessive charts, we organized information into logical sections that allow decision-makers to quickly understand business performance.
Key design decisions included:
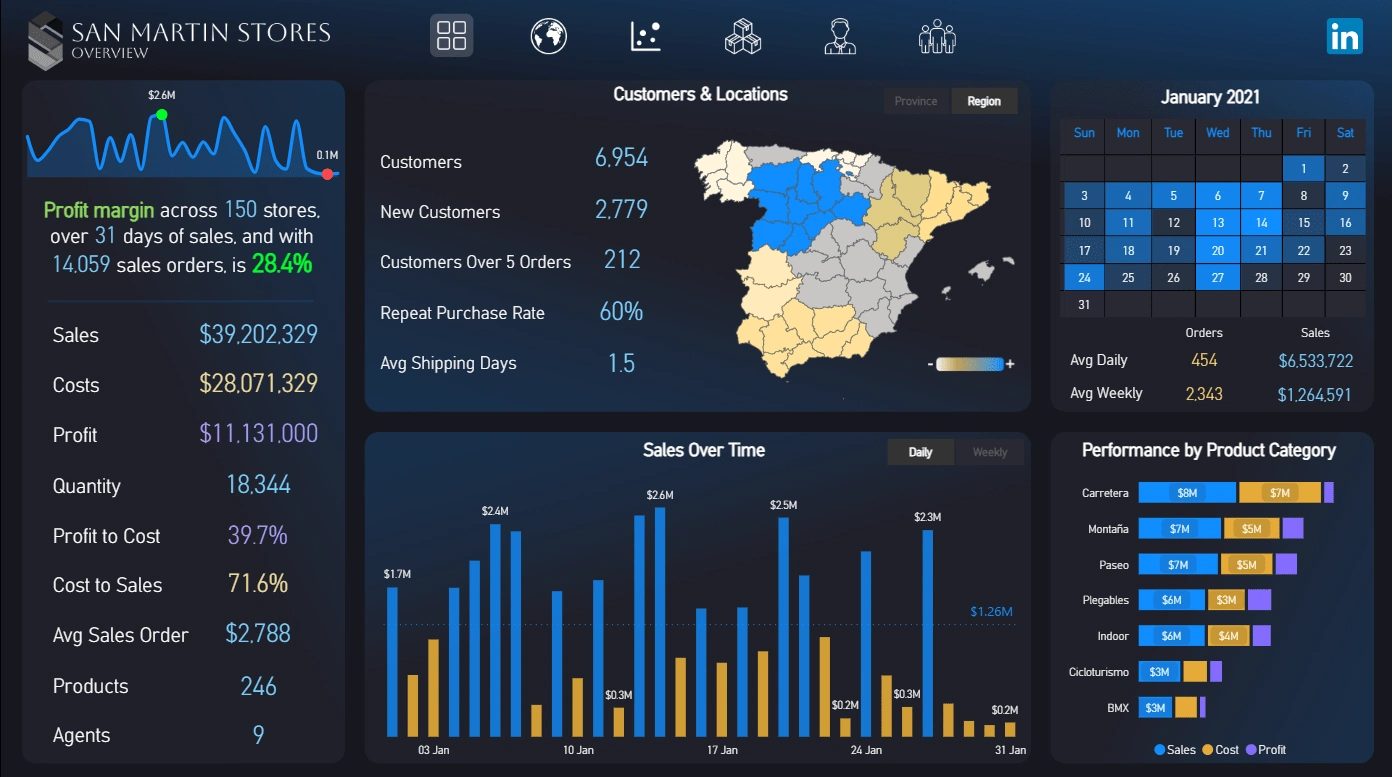
Interactive KPI cards for instant business performance summaries.
Clear visual hierarchy for effortless data interpretation.
Dynamic charts that reveal sales and profitability trends over time.
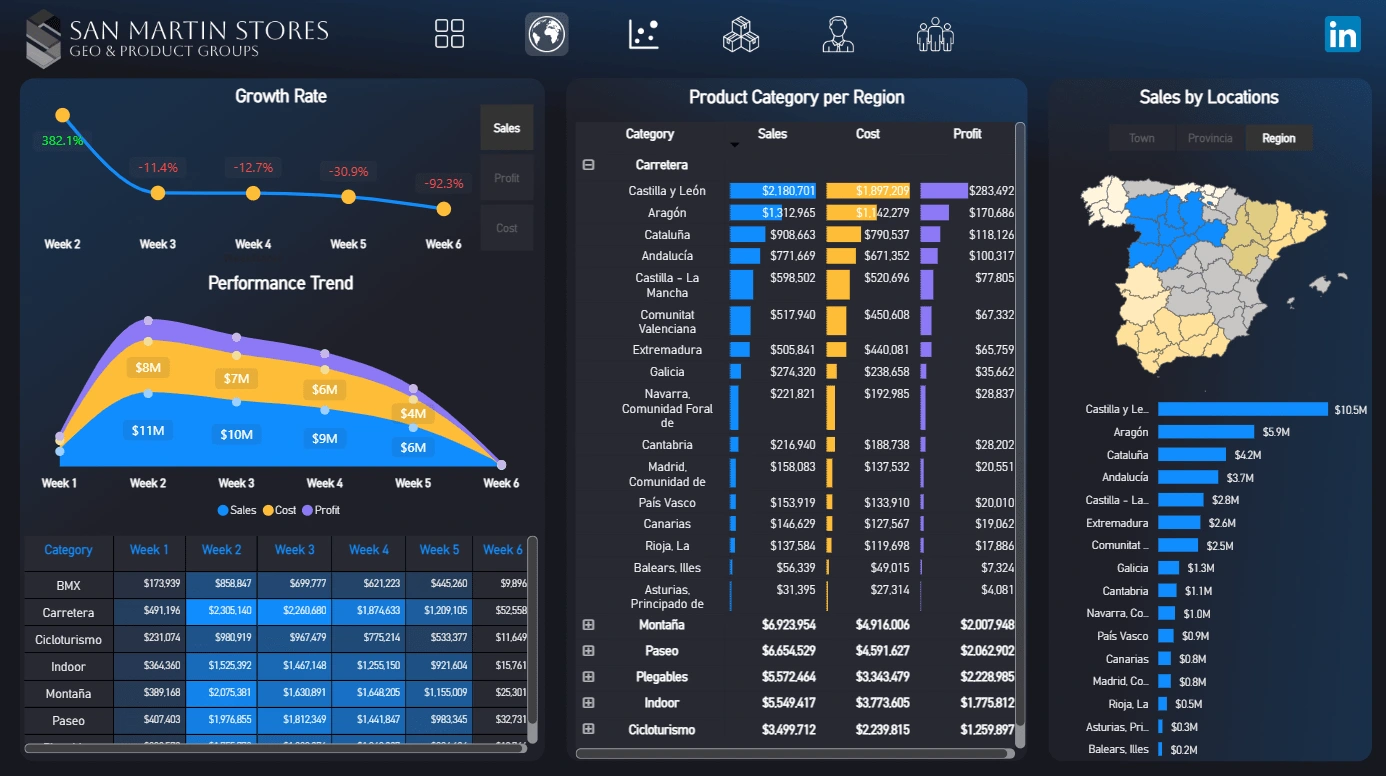
Geographic visualizations for regional sales analysis.
Product and customer performance breakdowns for deeper business insights.
Consistent layouts and reusable reporting components for scalability.
Every visualization was selected to reduce complexity while helping stakeholders uncover meaningful business insights more efficiently.
4. Interactive Reporting Experience
The dashboard was built to support interactive exploration, allowing users to filter data by region, product category, customer segments, and reporting periods.
This flexibility enables teams to move beyond static reports and explore business performance from multiple perspectives, improving both operational efficiency and strategic planning.
Key Features
The final dashboard includes:
Real-time sales and profitability monitoring.
Interactive KPI overview.
Revenue, profit, and cost trend analysis.
Customer acquisition and retention insights.
Geographic sales distribution analysis.
Product category performance comparison.
Operational efficiency metrics.
Order quantity and fulfillment reporting.
Dynamic filters and interactive visualizations.
Scalable reporting architecture for future expansion.
Technology Stack
Data Visualization
Power BI
Database Management
SQL
PostgreSQL
Data Processing & Automation
Python (Pandas, NumPy)
Microsoft Excel
Outcome
The final dashboard provides San Martin Stores with a centralized business intelligence platform that enables faster reporting, improved operational visibility, and more informed decision-making.
Key outcomes include:
Improved visibility into sales performance and profitability.
Faster access to critical business metrics through interactive reporting.
Better understanding of customer purchasing behavior and regional trends.
Enhanced product performance analysis for strategic planning.
A scalable analytics solution capable of supporting future reporting requirements.
Key Takeaways
The San Martin Stores Sales Analytics Dashboard demonstrates how effective business intelligence can transform raw operational data into strategic insights. By combining structured data processing, interactive visualizations, and thoughtful dashboard design, we created an analytics solution that empowers businesses to monitor performance, identify growth opportunities, and make confident, data-driven decisions.
Like this project
Posted Mar 5, 2025
A dynamic dashboard providing real-time insights into sales, customer behavior, and regional performance to optimize business strategies.
Likes
0
Views
12
Clients
San Martin