Freelance Backend Engineers in Sindh
Sign Up
Post a job
Sign Up
Log In
Filters
2
Projects
People
Muhammad Hassan
pro
Karachi, Pakistan
Full-Stack & AI Developer | Next.js, AI Agents
$50k+
Earned
12x
Hired
5.0
Rating
243
Followers
Follow
Message
Full-Stack & AI Developer | Next.js, AI Agents

0
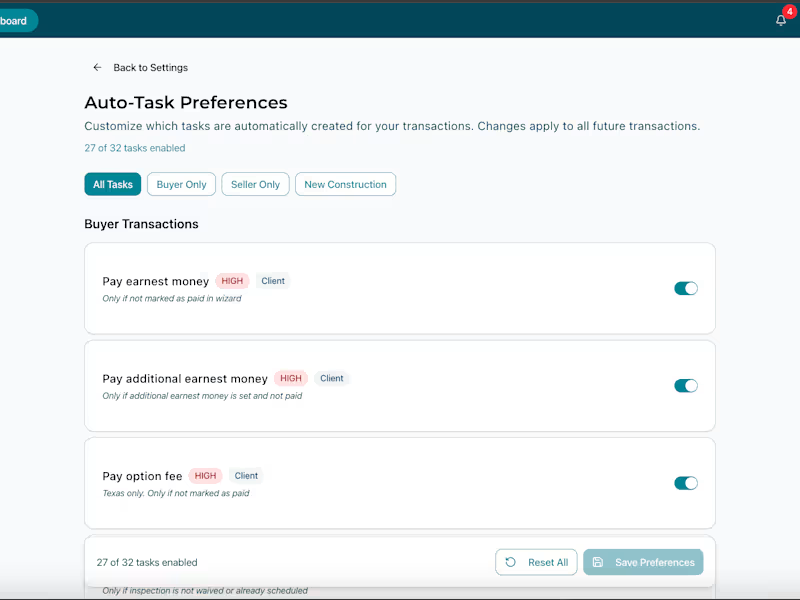
Automatic Rules Set for creating tasks
0
4
1
Ecommerce Gadget Selling Website
1
105
1
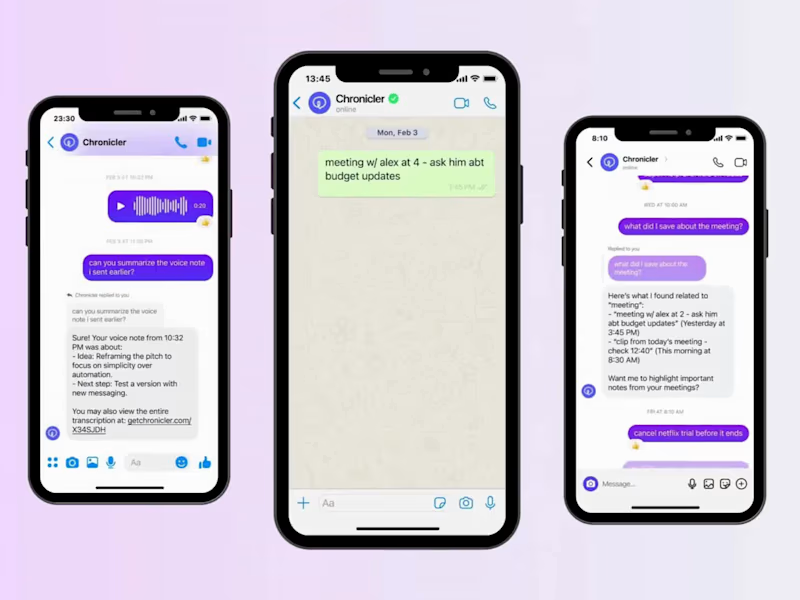
Frontend Lead & AI Developer @ Chronicler Labs
1
242
2
Rebuilding NestLink's Real Estate SaaS Platform
2
91
Backend Engineer
(2)
Follow
Message
Faarid Qureshi
pro
Karachi, Pakistan
Full-Stack & AI Developer | Next.js, AI Agents
$25k+
Earned
7x
Hired
5.0
Rating
54
Followers
Follow
Message
Full-Stack & AI Developer | Next.js, AI Agents

0
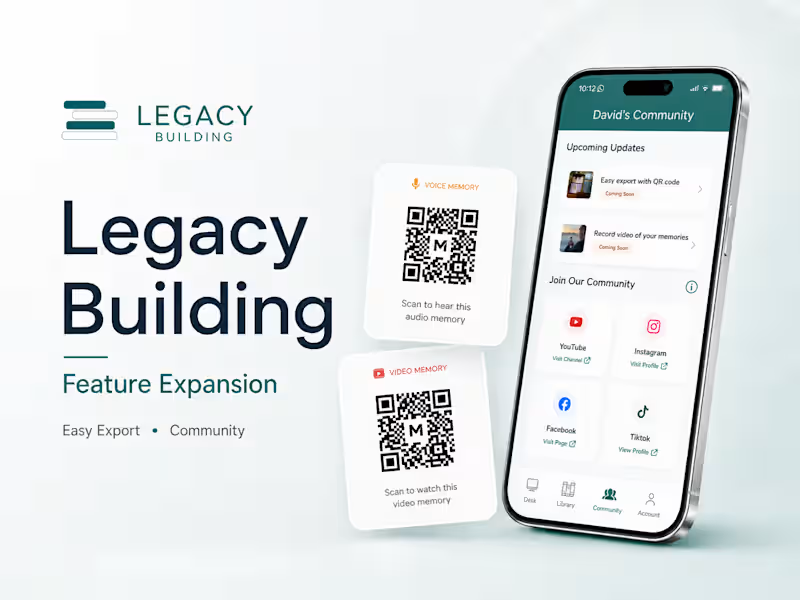
Legacy Building: Media Export & Community Features
0
10
2
NextClean - Cleaning Service Platform
2
27
3
Traced - Tenant Advocacy Platform
3
28
2
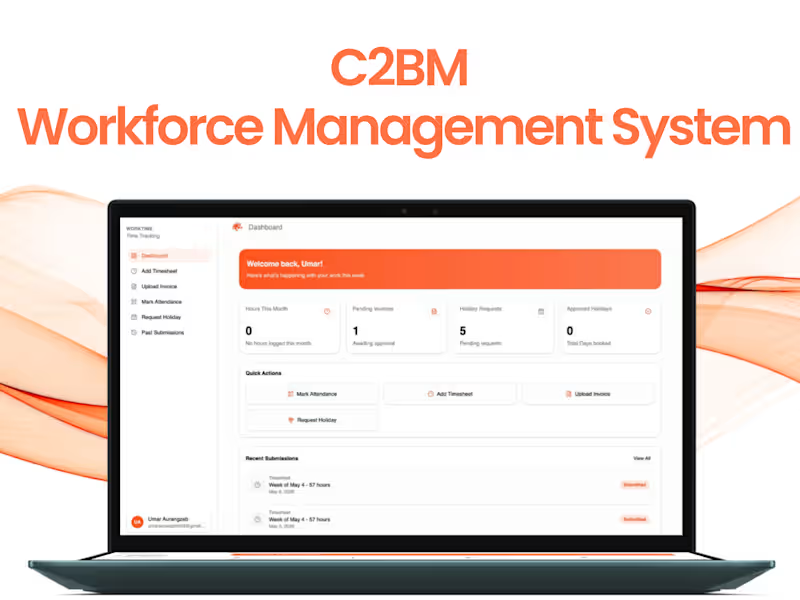
C2BM Workforce Management System
2
32
Backend Engineer
(13)
Follow
Message
Dayan Ahmed
pro
Karachi, Pakistan
AI Engineer & Full Stack Dev — Chatbots & Web Apps
10
Followers
Follow
Message
AI Engineer & Full Stack Dev — Chatbots & Web Apps
0
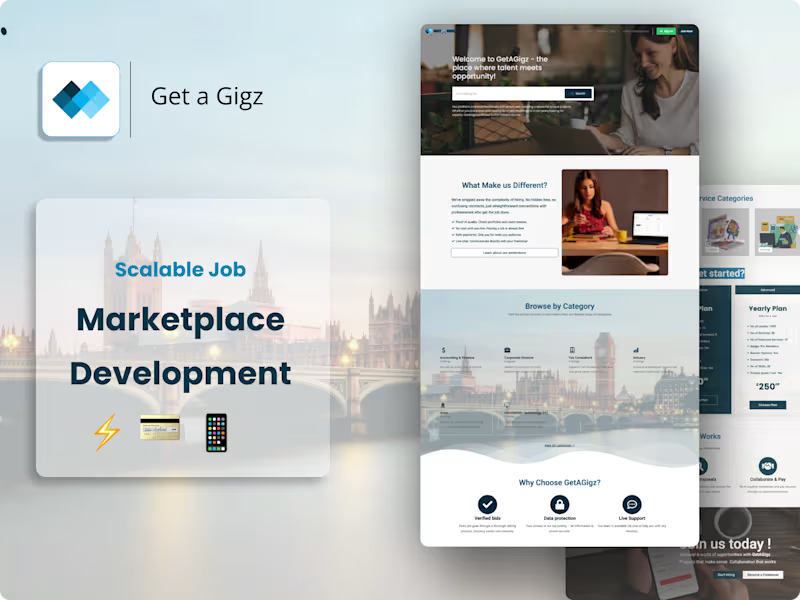
Stabilizing and Scaling a Job Marketplace Platform
0
18
0
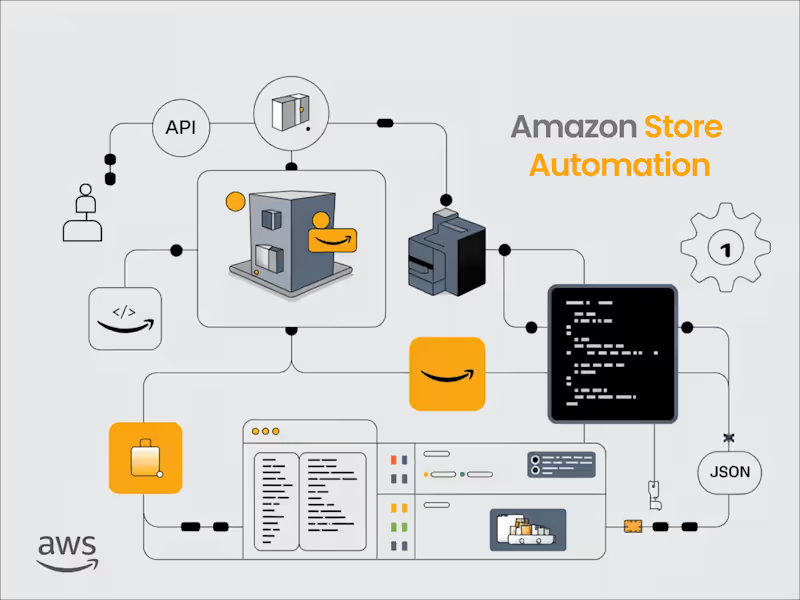
Amazon Product Upload Automation Using SP API
0
12
0
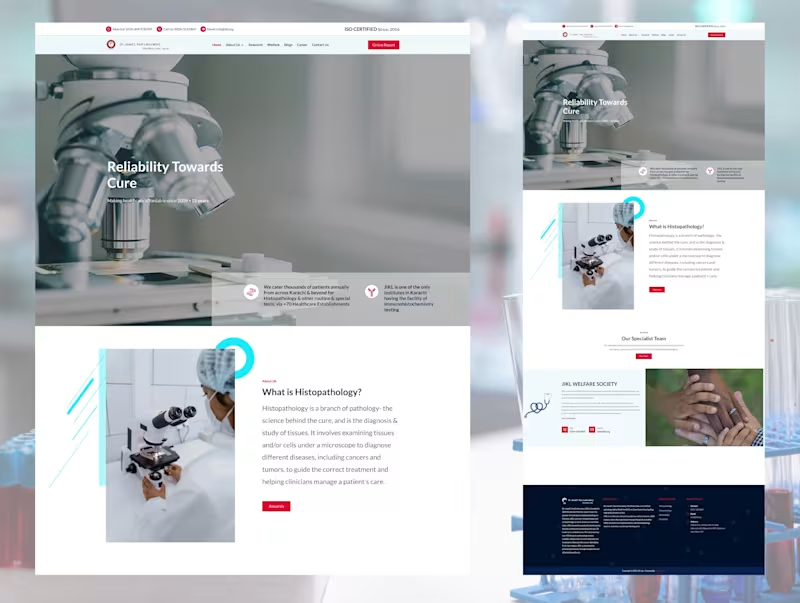
Responsive Medical Website Powered by Next.js & Sanity
0
11
2
I just built an automated Amazon product upload system using SP API for Vendor & Seller accounts. Designed the backend (Laravel/FastAPI), added async jobs, AWS auth, and feed tracking. Reduced manual work by 90% with faster, reliable uploads. Tech: SP API, AWS, MySQL.
1
2
200
Backend Engineer
(4)
Follow
Message
Ehtasham Ali
pro
Karachi, Pakistan
Production-ready AI agents and SaaS built to scale reliably.
$25k+
Earned
2x
Hired
107
Followers
Follow
Message
Production-ready AI agents and SaaS built to scale reliably.
3
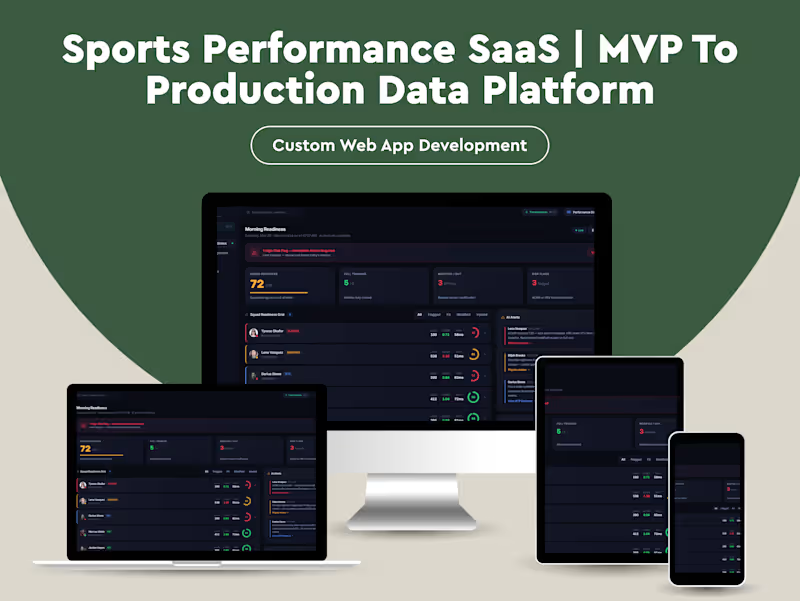
From Instinct to Infrastructure: How Athliq Went From Trainer's Notebook to Production Performance Platform ────────────────────────────────────────── The Person Who Understood the Problem Before Anyone Else Did Marcus had been a strength and conditioning coach for eleven years. He'd worked with professional football squads, Olympic track athletes, and NCAA programs. He knew exactly what was wrong with how performance data was managed, not because someone told him, but because he'd lived inside the problem every day. Every morning, he'd open four browser tabs, a spreadsheet, and a WhatsApp thread just to answer one question: Is this athlete safe to train today? HRV from one app. Sleep data from another. Yesterday's load from a Google Sheet. Wellness check-ins in a form nobody filled out consistently. Injury notes in a physio's personal folder. The picture was always incomplete, not because the data didn't exist, but because no system was designed to assemble it. He wasn't guessing the problem. He was the problem's daily victim. So he built something. ────────────────────────────────────────── The First Version Had Real Value What Marcus and a developer friend put together in six weeks was genuinely useful. A React frontend. Static JSON files simulating the data feeds he wished he had. A morning readiness dashboard showing each athlete's status: green, amber, red. ACWR calculations. A training plan view. A return-to-play protocol tracker. It looked like a real platform. It felt like one. When he demoed it to his performance director, the response was immediate: "This is what we've been trying to build for two years." The prototype surfaced something important. The problem wasn't that nobody had the data. The problem was nobody had designed the right lens to look at it through. Marcus had. His system organized information around the questions coaches actually ask, not the questions software vendors assume they ask. The initial build worked. For one squad. In static conditions. With fake data. And that was exactly the point where it started to matter, and exactly the point where its limitations became unavoidable. ────────────────────────────────────────── What Started Breaking The prototype had no backend. Data was hardcoded. Every "insight" was pre-written. The readiness scores didn't calculate; they were authored. When a second sport scientist saw the demo and said, "Can we plug in our GPS data?" there was no honest answer that didn't involve a complete rebuild. More specifically: The data layer was decorative. The JSON files looked real but required manual authoring for every scenario. There was no pipeline, no ingestion, no validation. Any live deployment would mean the dashboard showed stale or fabricated numbers, which in a performance context is worse than showing nothing at all. The AI insights were static strings. Every "AI-generated" recommendation was hardcoded text. In the prototype, this was fine. It demonstrated the concept. In production, it would mean the same insight appearing for every athlete regardless of their actual state, silently eroding clinician trust. The system had no concept of time. Training load calculations, ACWR ratios, wellness trends, all of these are temporal by definition. The prototype rendered them as snapshots. A real system needed rolling windows, historical comparison, and the ability to detect change over time. There was no role isolation. The role switcher in the UI was cosmetic. A physio and a performance director seeing the same underlying data with a CSS class change was not access control, it was theater. Nothing would survive a real integration. Real wearables return messy, incomplete, delayed data. The system had no error handling, no retry logic, no fallback states. The first real data feed would have broken the UI in ways that were invisible until they were catastrophic. The system was not wrong. It was early. ────────────────────────────────────────── Why They Didn't Just Fix It Themselves Marcus understood sport science. His developer understood React. Neither of them had built a production data system before, and that gap is not a skills deficiency, it is a domain specialization. What they needed was not someone to rewrite their frontend. The frontend was actually good. The visual hierarchy was sharp, the domain terminology was accurate, the workflows reflected how coaches genuinely think. That institutional knowledge was irreplaceable and not to be discarded. What they needed was: • A real-time data layer that could ingest from multiple sources reliably • A calculation engine that could run ACWR, load zone distributions, and readiness scoring against live data • A structured API contract between the front and back end • Authentication and role-based data scoping that actually enforced access boundaries • Observability, so when something silently broke, someone would know The prototype had proven the concept. The job now was to make the concept dependable. ────────────────────────────────────────── What We Actually Did We kept the frontend. Almost entirely. The visual design, the component architecture, the domain-accurate terminology, all of it stayed. We refactored the data layer, not the UI layer. The prototype's greatest strength was its UX fidelity to how coaches actually work, and we had no interest in rebuilding that from scratch. We built a real data ingestion pipeline. Rather than static JSON, we designed a service layer that could ingest from GPS units, HRV monitors, and wellness form submissions. Each source had its own adapter with validation, normalization, and error handling. Partial data was acceptable; silently wrong data was not. We replaced static calculations with a live computation engine. ACWR calculations now ran against a rolling 28-day window of actual load data. Readiness scoring pulled from real HRV baselines, not fixed numbers, and recalibrated as an athlete's personal baseline shifted over a training block. We replaced pre-written AI insights with a rules-based inference layer. Every insight shown in the platform now corresponded to a condition that was evaluated against live data. If Lena Vasquez's ACWR crossed 1.3 and her HRV dropped more than 15% from her 7-day baseline, the injury risk flag was triggered, not because it was hardcoded, but because those conditions were true. We implemented real role-based access control. A physio sees medical data, injury history, and RTP protocols. A sport scientist sees load analytics and benchmarks. A performance director sees the squad-level overview. A head coach sees readiness and today's session. The frontend already had role-switching built in, we gave it actual enforcement. We added observability throughout. Every data ingestion event was logged. Every calculation that produced an out-of-range result generated an alert. If a data source stopped sending, the system surfaced a staleness warning rather than silently displaying old numbers as current. ────────────────────────────────────────── Tech Stack React 19 + Vite, Tailwind CSS v3, Recharts, React Router v7, Node.js + Fastify, PostgreSQL + TimescaleDB, Redis, GPS/HRV/sleep data adapters (Catapult, Polar, Garmin), Google Forms/Typeform ingestion, Auth0, row-level security, Sentry, Datadog, Railway/Render, Vercel, Supabase Storage What Changed The morning workflow Marcus had been running across four tabs and a spreadsheet now ran in a single view that was populated automatically before he arrived at the training ground. The difference wasn't just convenience. It was confidence. When the dashboard flagged an athlete as high-risk, the coaching staff could interrogate why and trust the answer. When a return-to-play progression showed 80% completion, that number reflected actual criteria met against measured data, not a manually updated percentage. The platform was no longer a demo tool. It was a clinical decision-support system. For the squads using it, the shift was measurable: fewer reactive injury responses, more consistent load monitoring, and perhaps most importantly, a shared language between coaching staff, physios, and sport scientists built around the same data rather than competing interpretations of separate sources. ────────────────────────────────────────── The Part That Rarely Gets Said Most platforms built in this space start from the software side. Someone builds a data collection tool, adds a dashboard, and then tries to reverse-engineer what coaches actually care about. Athliq started from the other direction. A domain expert who understood the problem at a professional level built the frame first, and built it correctly. The pain points were real, the workflows were accurate, the terminology was precise. The engineering work didn't fix a bad idea. It made a good idea survivable. That distinction matters more than most technical case studies acknowledge. The hardest part of building a platform like this is not the infrastructure. It's knowing which questions to answer. That knowledge was already there. Our job was to make sure the system could keep answering them reliably, at scale, over time. ────────────────────────────────────────── Athliq is now in active deployment across two professional squads and one university performance program. The morning readiness dashboard processes real-time data from four integrated sources and serves role-scoped views to performance directors, sport scientists, physiotherapists, and athletes.
1
3
1.9K
2
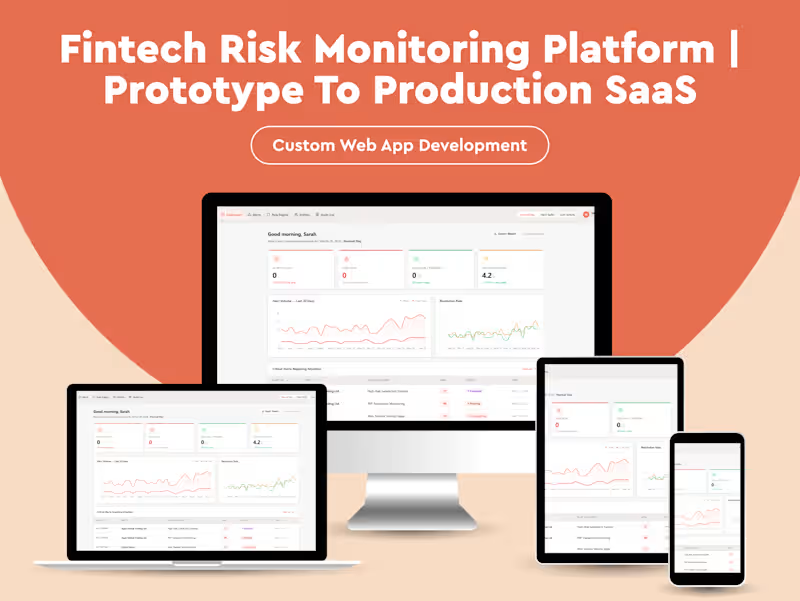
KovaRisk: When the Interface Knew More Than the System ────────────────────────────────────────── The Expert in the Room Compliance officers don't struggle to understand risk. They struggle to act on it fast enough. The team behind KovaRisk understood this precisely. They had spent years inside financial institutions watching the same dysfunction repeat: alerts buried in spreadsheets, investigations tracked in email threads, audit trails reconstructed after the fact. They knew what the interface needed to feel like because they'd lived with the one that didn't. So they built it. Fast. Exactly as they'd imagined it. What emerged was sharp: a risk monitoring dashboard with filterable alert feeds, entity profiles with 12-month risk trajectories, a rule engine with toggle controls, and an audit log that felt immutable. The scenario switcher let compliance teams stress-test different alert load states. The side panel made investigations feel contained and intentional. It looked like a system that had survived production. It hadn't been asked to yet. ────────────────────────────────────────── What Existed Was a Strong Interface - Not a System Every alert in KovaRisk was generated at startup. Every risk score was computed by a random seed function. Every status change - Investigating, Resolved, Escalated - lived in component state. Every timeline event was appended to an in-memory array. Every rule toggle disappeared on refresh. The audit log recorded nothing. The export downloaded a snapshot of what React was holding at that moment. The entity risk history was a curve drawn from a formula, not a record. The logic was there. But it had nowhere to live. A compliance officer investigating a high-risk wire transfer would open the side panel, read the plain-English rule explanation, mark the alert as Investigating, add an internal note - and lose every one of those actions the moment they refreshed the browser. No colleague could see what they'd done. No regulator could verify it had happened. In financial compliance, that's not a UX problem. It's a liability. The prototype validated the workflow brilliantly. It exposed exactly how a compliance team would move through their day. But three things were missing: a source of truth, a coordination layer, and a trail that could be audited under pressure. ────────────────────────────────────────── They Didn't Need More Features - They Needed a System Behind the Interface The team came with a clear idea and a working prototype. What they needed was the architecture that made the prototype a product - the layer that turned interface actions into durable facts. Not a rebuild. A foundation. ────────────────────────────────────────── The Layer That Made It Dependable Data Models: Giving State a Home The first thing to reconstruct was where the data should actually live. KovaRisk's frontend implied a clear schema - alerts, entities, rules, audit events - but none of it persisted. The production system needed a PostgreSQL core with five primary entities: • Alert — with foreign keys to Entity, Rule, Transaction, and a JSONB timeline column for ordered event history • Entity — with risk tier, jurisdiction metadata, and a one-to-many relationship to RiskScore snapshots • Rule — with active/disabled state, trigger thresholds, false-positive tracking, and a versioning mechanism so changes to rules didn't retroactively alter historical alerts • AuditEvent — append-only, with actor ID, action type, target reference, and a server-generated timestamp that clients cannot modify • InternalNote — owned by an alert, with authorship and a soft-delete flag to preserve compliance integrity Every status change, note, escalation, and flag the UI handled ephemerally became a write to this schema. The Alert Generation Engine: Replacing the Seed Function In the prototype, 85 alerts appeared because a loop ran 85 times at startup. In production, alerts are the output of a Transaction Monitoring Service - a background process that runs continuously against incoming transaction streams. This service: • Evaluates each transaction against every active Rule definition • Computes a risk score using rule weights, entity risk tier, jurisdiction flags, and behavioral baselines • Creates an Alert record only when a threshold is breached • Emits an event to a notification queue for high-risk triggers The rule engine the UI let users toggle wasn't decorative. Each rule mapped to an evaluation function in the monitoring service. Disabling a rule didn't just grey out a card - it removed it from the active evaluation set. Re-enabling it didn't retroactively generate alerts it would have caught; it resumed from the point of activation. That distinction mattered for regulatory defensibility. ────────────────────────────────────────── Async Workflows: The Operations the UI Implied But Couldn't Sustain Several interactions in the prototype implied workflows that couldn't complete synchronously. Escalation - When an alert was escalated, the UI changed a status badge. In production, escalation triggers a queue job that: notifies the senior compliance officer via a configured channel, creates a case record linking the alert, and starts a response SLA timer. The UI reflects the outcome - it doesn't produce it. Scheduled Screening - The Sanctions Screening Match rule in the prototype was static. In production, it's a nightly job that re-screens all active entities against updated OFAC, EU, and UN sanctions lists - generating new alerts if a previously clean entity now appears. The results feed back into the alert pipeline. Report Export - The dashboard's Export Report button downloaded a text file of whatever React was holding in memory. In production, report generation is an async job: the user requests the report, the job runs server-side against the live database, and a download link is returned when ready. The content is a verifiable, timestamped record - not a UI snapshot. ────────────────────────────────────────── The Audit Log: From Feed to Fact The prototype's audit log was populated by a generateAuditLog function. It looked comprehensive and immutable. It was neither. Production audit events are written by the API layer on every state-modifying operation - before the response is returned to the client. The table is append-only. No update operations are permitted on AuditEvent records. Timestamps are server-generated in UTC and stored with full precision. Actor identity comes from the authenticated session, not from a string the client sends. The audit log the interface displayed was a simulation of accountability. The production version is the accountability. ────────────────────────────────────────── Tech Stack 1. Frontend: React + Vite, React Router v6, Recharts, React Context + local state, TanStack Query 2. Backend: Node.js + TypeScript, Fastify, Prisma, PostgreSQL, Redis, BullMQ, Passport.js + express-session 3. Infrastructure: AWS ECS / Railway / Render, S3, AWS Secrets Manager / Doppler, Sentry + Datadog, GitHub Actions 4. External Integrations: OFAC / ComplyAdvantage, Refinitiv World-Check, SendGrid / SMTP, Webhooks ────────────────────────────────────────── From Interface to System The prototype answered the right questions. It proved the workflow was sound, the information hierarchy was correct, and the alert investigation pattern worked the way compliance officers needed it to. What it couldn't answer was: what happens when two investigators open the same alert simultaneously? What happens when a rule change needs to take effect immediately across 200 pending alerts? What happens when a regulator asks for every action taken on a specific entity over the past 18 months? Those questions don't live in the interface. They live in the system. KovaRisk's interface was always strong. What it needed was the architecture to make it real - persistent, coordinated, auditable, and defensible under scrutiny. The logic existed from the beginning. We gave it somewhere to live.
2
1.8K
2
Case Study: From Prototype to Production — Building a Credit Management Platform for Ad Operations The Starting Point The founder wasn't guessing the problem. They had spent years inside the ad-credit ecosystem, managing wallet balances across regions, reconciling top-ups via bank wire and stablecoin, chasing compliance documents, and watching campaigns stall because a pixel stopped firing at 2am. They knew exactly what a credit management platform needed to look like. So they built one. Using Figma wireframes translated directly into a React frontend, they shipped a working prototype in days. Two portals were created. One for clients managing wallets and ad accounts, and one for internal operators handling treasury, compliance, and risk. It included real-time spend charts, AI-driven anomaly detection banners, a work queue for ops teams, and an embedded AI assistant that could answer questions about balances, compliance status, and pixel health. The prototype proved the concept. Clients could see their wallet balances, request top-ups, allocate funds to ad accounts, and track campaign performance. Admins could manage treasury operations, review KYB pipelines, monitor risk scores, and process a prioritized work queue. The domain logic was sound. The UX was sharp. But the system was never designed to survive real load. What Started Breaking The prototype worked on mock data. Every API call returned hardcoded arrays after a random delay. There was no backend. No database. No real authentication. The login screen accepted any email and assigned a role based on a toggle switch. Session state lived in localStorage as a raw JSON blob. This was fine for demos. It stopped being fine the moment real money entered the picture. The specific fractures: 1. No transactional integrity. Wallet balances, top-ups, fund transfers, and ad account allocations were all simulated. In a live system, a transfer of $25,000 from a master wallet to a regional sub-wallet is not a UI state change. It is a financial transaction that requires atomicity, audit trails, and rollback capability. The prototype had none of this. 2. Compliance was cosmetic. KYB document statuses were static labels. In production, document verification involves third-party identity providers, expiration tracking, automated re-upload reminders, and regulatory audit logs. The prototype rendered badges like "Verified", "Pending", and "Missing", but nothing enforced the state machine behind them. 3. Risk scoring was decorative. The AI risk badges showed tooltips like "Large P2P transfer detected, document expiring", but these were string literals, not outputs from a scoring model. Real risk assessment requires transaction pattern analysis, velocity checks, cross-referencing compliance status, and escalation workflows that route to the right ops agent. 4. The work queue had no backend. Urgent items like "$45,000 P2P transfer anomaly" appeared in the queue, but resolving them was just a frontend state toggle. There was no case history, no assignment logic, no SLA tracking, and no integration with the compliance or treasury systems that actually needed to act on these events. 5. Multi-tenancy was absent. The platform served one mock client and one mock admin. Scaling to dozens of clients, each with their own wallets, sub-wallets, ad accounts, compliance profiles, and credit limits, required data isolation, permissioning, and tenant-aware queries that did not exist. 6. Ad platform integration was faked. TikTok metrics like impressions, clicks, ROAS, and pixel health were all static datasets. Production requires OAuth-based API integrations, rate-limited data syncing, webhook listeners for pixel status changes, and graceful degradation when platform APIs go down. The founder understood all of this. The prototype was never meant to be the product. It was meant to prove that the product was worth building. Why They Brought In a Team The gap between the prototype and production was not a matter of fixing bugs. It was an architecture problem. The founder needed: - A real backend with transactional guarantees for financial operations - A compliance engine that could enforce document workflows across jurisdictions - A risk system that could ingest transaction data and surface actionable alerts, not static strings - Multi-tenant data architecture with proper isolation and access control - Ad platform integrations that could handle real API contracts, rate limits, and failures - Observability including logging, monitoring, and alerting so the ops team could trust the system under load They did not need someone to rewrite the frontend. They needed someone to build the system underneath it. What We Delivered Financial Operations Layer We replaced the mock API with a transactional backend. Every wallet operation, including top-ups, transfers, allocations, and refunds, now runs through an auditable pipeline with: - Atomic balance updates with optimistic locking - Double-entry ledger for every fund movement - Idempotent transaction processing to prevent duplicate charges - Full audit trail with actor, timestamp, and before and after state Top-up requests now flow through a verification pipeline with submission, proof-of-payment upload, approval, and balance credit. Each step is recorded and reversible. Compliance and KYB Engine - We built a document lifecycle system that replaces static badges with enforced state transitions: - Documents move through missing → uploaded → under_review → verified → expired with rules governing each transition - Expiration monitoring triggers automated client notifications before deadlines - Third-party identity verification integration for director ID matching - Jurisdiction-aware requirements where different regions require different document sets - Audit-grade logging for every status change, reviewer action, and override The KYB pipeline now routes cases to specific compliance agents based on workload, region, and verification type. Risk and Anomaly Detection We replaced hardcoded risk labels with a scoring system that evaluates: - Transaction velocity based on spend acceleration versus historical baseline - P2P transfer patterns and threshold breaches - Compliance status correlation, such as expired documents combined with high spend - Account dormancy detection where inactivity triggers review Risk scores update in near real time. High-risk events automatically generate work queue items with priority, context, and suggested actions. Work Queue and Case Management We transformed the frontend-only task list into an event-driven operations system: - Events from treasury, compliance, and risk systems automatically create queue items - Assignment logic routes items to the right agent based on type, region, and capacity - SLA tracking with escalation rules for overdue items - Case history that records every action, note, and resolution - Enforced status transitions so items cannot be resolved without required actions Multi-Tenant Architecture We designed the data layer for tenant isolation from the ground up: - Each client organization has isolated wallets, documents, ad accounts, and transaction histories - Role-based access control separates client-facing and admin-facing data - API endpoints are tenant-scoped to prevent cross-tenant data leakage - Admin views aggregate across tenants with proper permissioning Ad Platform Integration We built a sync layer for TikTok Ads with an architecture that supports additional platforms: - OAuth-based account linking with token refresh management - Scheduled metric pulls with rate limit awareness and backoff - Pixel health monitoring via event signal tracking instead of static labels - Graceful degradation where stale data is clearly labeled if APIs fail Observability We added the infrastructure the ops team needs to trust the system: - Structured logging for every financial operation, compliance action, and API call - Health dashboards for backend services, integration sync status, and queue throughput - Alerting on anomalies such as failed transactions, sync delays, and SLA breaches - Error tracking with business context, not just stack traces The Outcome The system went from a prototype that could demo well to a platform that could process real money, enforce real compliance, and surface real risk under real load. What changed: - Financial operations now run with transactional guarantees. Wallet balances are accurate, auditable, and reconcilable. - Compliance is enforced, not displayed. Document workflows follow regulated state machines with full audit trails. - Risk detection is continuous and contextual. The ops team acts on scored alerts instead of static labels. - The work queue drives operations. Events flow in automatically, route correctly, and track resolution against SLAs. - Multi-tenancy works. New clients onboard into isolated environments without architectural changes. - Ad integrations sync reliably. When they fail, the system clearly shows it instead of masking stale data. The founder’s instinct was right from the start. The domain model, the UX, and the operational workflows all held up. What we built was the engineering foundation that made it dependable. The system worked until it didn’t. Not because the idea was flawed, but because it was never designed to handle this level of complexity. The prototype proved the product. The production system proved it could scale. Tech Stack Overview 1. Backend: Node.js (NestJS) 2. API: GraphQL 3. Auth: Auth0 4. Database: PostgreSQL 5. Cache/Queue: Redis 6. Search: Elasticsearch 7. Infrastructure: AWS 8. Containers: ECS Fargate 9. CI/CD: GitHub Actions 10. IaC: Terraform 11. Integrations: Stripe 12. Risk Engine: Python (FastAPI) 13. ML Pipeline: scikit-learn 14. AI Assistant: OpenAI GPT-4 15. Vector Store: Pinecone
2
1.8K
1
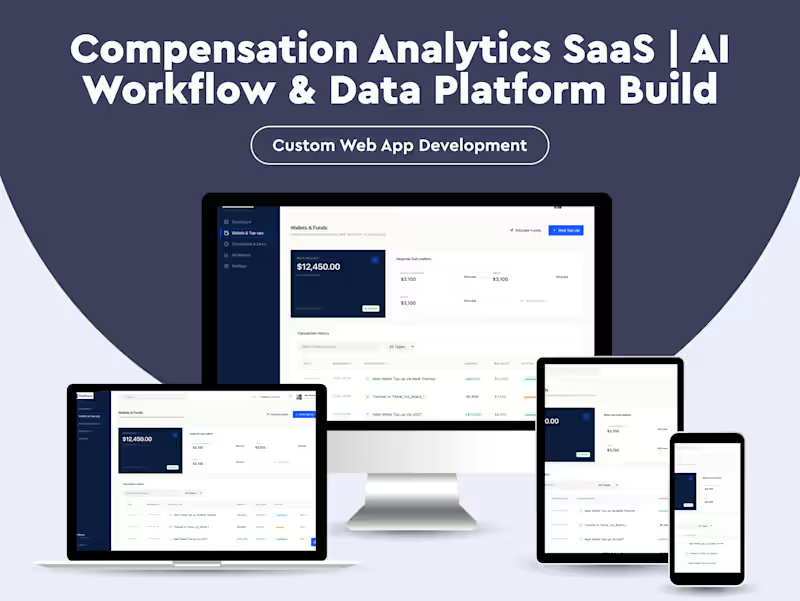
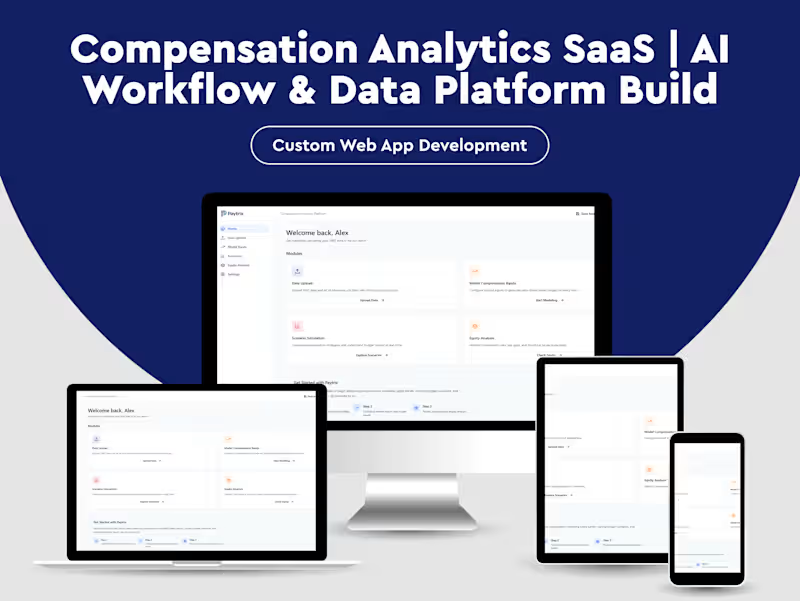
Paytrix: From Interface Logic to Compensation Infrastructure The Insight The builder behind Paytrix understood compensation deeply, not as a payroll function, but as a structural problem. They knew that most companies manage salary bands in spreadsheets, that job title normalization is a nightmare at scale, and that equity analysis gets ignored until it becomes a legal liability. They knew this because they lived it. So they built what they knew. Fast. What Existed Paytrix, as delivered, was a polished React application, built with Vite, Tailwind, Radix primitives, and Recharts, spanning six distinct modules: a dashboard, an HRIS data upload flow, a compensation modeling engine, a scenario simulator, an equity analysis suite, and a settings panel. The interface was sharp. The workflows were correct. A user could upload employee data, watch AI "normalize" job titles into a structured architecture, model salary bands against market percentiles, run budget impact scenarios, and review compression risks across career levels. It looked like a product. But every piece of logic lived on the client. Where It Breaks The 114 employees in the system are not uploaded. They are hardcoded in a TypeScript file. The "AI normalization" is a setInterval cycling through four progress labels over two seconds. Market benchmarks are arithmetic constants (industryPremium = 0.08). The equity analysis, compa-ratios, range penetration histograms, compression heatmaps, renders from static arrays defined at the top of the component. Scenario simulation multiplies a base salary by a percentile offset. The entire application state persists to localStorage. None of this is a criticism. It's what a vibe-coded prototype should be: directionally correct, visually convincing, structurally hollow. The problems emerge when you try to use it: • No persistence. Clear your browser, lose your scenarios. There's no database, no user accounts, no tenant isolation. • No real data ingestion. The upload flow accepts nothing. There's no CSV parser, no file handler, no validation pipeline. The "AI" that maps "Sr. Software Engineer" to "Engineering / L3 - Mid-Level" is a pre-written array with confidence scores already assigned. • No market data layer. Salary benchmarks are invented constants. There's no connection to BLS, Radford, Mercer, or any compensation data provider. The "industry premium" and "funding stage adjustment" are fixed floats that don't change regardless of input. • No computation engine. Compa-ratios, range penetrations, and compression risks are display values, not derived metrics. Change an employee's salary in the mock data and the equity charts do not move, because the charts read from a different hardcoded array. • No multi-user support. "Welcome back, Alex" is a string literal. There's no auth, no RBAC, no concept of who should see what. The logic was all there. It just had nowhere to live. The System That Needed to Exist What Paytrix required was not more UI work. It required the invisible layer that makes compensation software trustworthy. Data Ingestion Pipeline A backend service that accepts HRIS CSV uploads, validates schema (employee ID, title, department, salary, location, demographics), handles malformed data gracefully, and stages records for processing. This is not a file drop. It is an ETL pipeline with column mapping, deduplication, and audit logging. The upload endpoint needs to support files from Workday, BambooHR, Rippling, and manual exports, each with different schemas. Job Architecture Normalization Service The prototype simulates AI-driven title mapping. In production, this is a classification service, likely backed by an LLM or a trained model, that ingests raw job titles and maps them to a canonical taxonomy of families and levels. It needs to handle ambiguity ("Sr. Software Engineer" vs. "Senior Software Engineer" vs. "SWE III"), surface confidence scores that reflect model uncertainty, and support human-in-the-loop correction that feeds back into the model. This is a backend job queue, not a frontend animation. Market Data Integration Layer Compensation modeling requires real benchmark data. The system needs API integrations with at least one primary data provider (Radford, Mercer, Comptryx) and the ability to ingest custom survey data. Market rates need to be indexed by role, geography, industry, company size, and funding stage. This is a multi-dimensional lookup that changes quarterly. This data must be versioned and cacheable, with fallback logic when specific cuts are not available. Compensation Calculation Engine The core math, midpoint derivation, band construction, compa-ratio computation, range penetration, compression detection, needs to run server-side against real employee records and real market data. The prototype calculates midpoint = baseMarket * (1 + industryPremium + fundingAdjustment) * percentileMultiplier. In production, this becomes a parameterized model where each variable is resolved from the market data layer, scoped to the company’s configuration, and applied across every employee in the dataset. Band width, skills premiums, and geographic differentials are all configurable per job family. Scenario Persistence and Comparison The prototype stores scenarios in React context backed by localStorage. Production requires a database-backed scenario system where a user can save named configurations, compare them side by side, share them with stakeholders, and track which scenario was ultimately adopted. Each scenario needs to carry its full parameter set, the resulting budget impact, and a snapshot of the employee population it was run against. Equity Analysis Engine The hardcoded charts need to be replaced by a statistical analysis service. Gender and ethnicity pay gap calculations require controlled regression, adjusting for level, tenure, location, and department, not raw averages. Compression detection needs to compare adjacent levels within the same job family dynamically. Flagged roles need to be generated algorithmically, not listed manually. Authentication, Tenancy, and Access Control Compensation data is among the most sensitive in any organization. The system needs proper auth (SSO at minimum for enterprise), tenant isolation so each company sees only its data, and role-based access so an HR analyst sees different things than a VP of People. Audit logging is non-negotiable. Every view, edit, and export must be tracked. What Changed The interface did not need to be rebuilt. It needed something behind it. What was a demo became a system. What was localStorage became a database. What were constants became integrations. What was a progress bar became a processing pipeline. The prototype proved the idea was right. The architecture made it real. From demo-ready to production-ready. From UI-driven logic to system-driven reliability. We built the layer that made it dependable.
1
1.8K
Backend Engineer
(5)
Follow
Message
Mufasil Iqbal
Karachi, Pakistan
Innovative Solution-Driven Developer
$1k+
Earned
1x
Hired
4.9
Rating
1
Followers
Follow
Message
Innovative Solution-Driven Developer
1
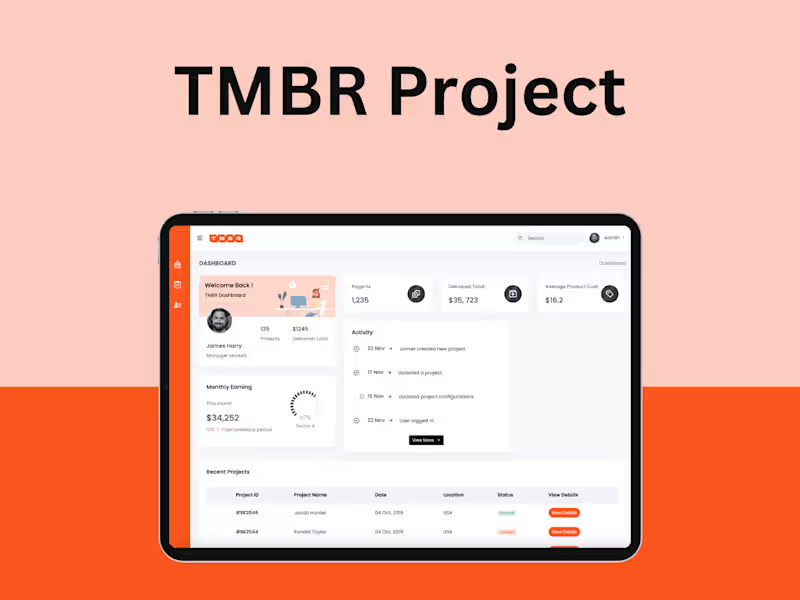
TMBR | Portal
1
65
0
Afkar | Framer Project
0
16
0
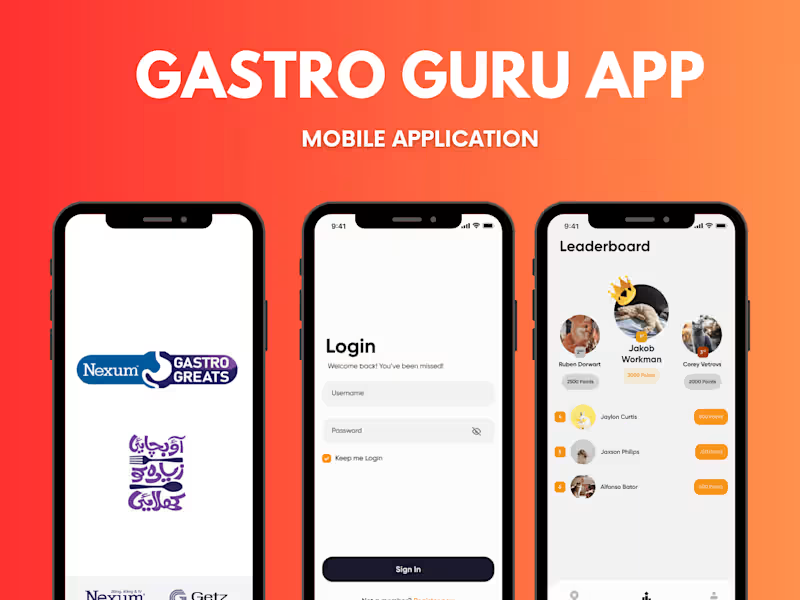
Getz Pharma | Gastro Guru
0
22
0
Synage Global | HRM
0
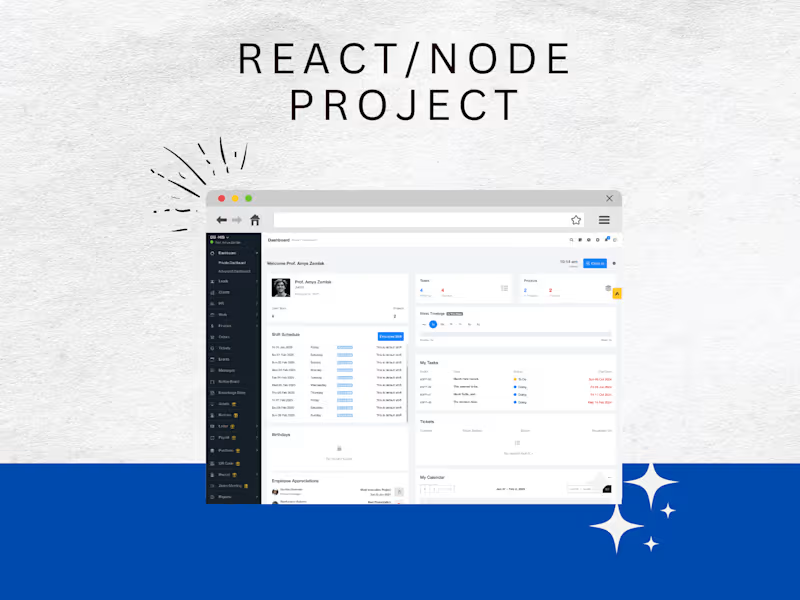
19
Backend Engineer
(8)
Follow
Message
Maaz M.
Karachi, Pakistan
Product Design, Growth and Developer | E-Books and Software
5.0
Rating
11
Followers
Follow
Message
Product Design, Growth and Developer | E-Books and Software
1
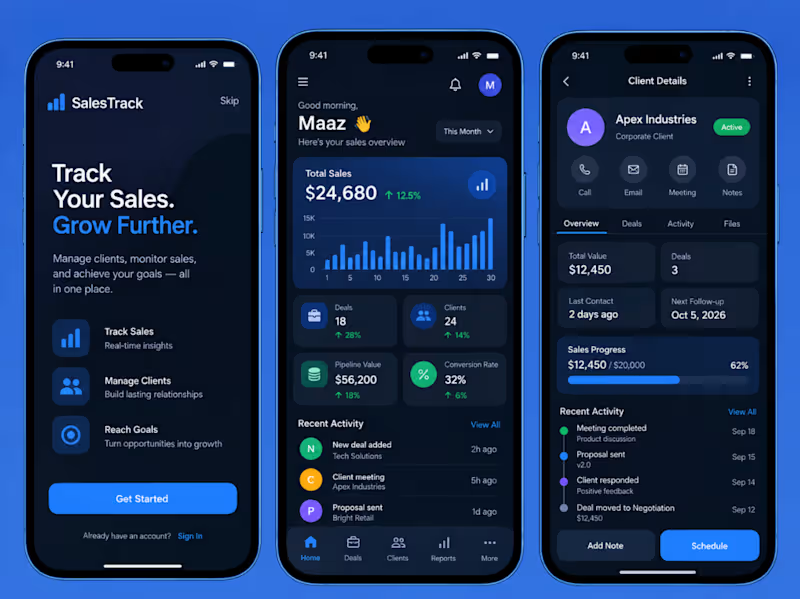
SalesTrack: A Modern Sales Tracking and Client Management App I designed SalesTrack to give sales professionals a clear view of their performance without turning the experience into a spreadsheet on a phone. Instead of overwhelming users with dense CRM tables, long reports, and scattered client records, I structured the product around the questions sales teams check every day: how much have I sold, how healthy is my pipeline, which deals are moving, and which clients need attention next? The visual identity combines a deep navy interface with electric blue accents, supported by green, purple, and amber indicators for performance states. The dark background keeps the interface focused, while blue is used consistently for primary actions, navigation, charts, progress bars, and active states. Cards are flat, spacious, and highly legible, creating a professional dashboard aesthetic without relying on illustrations or decorative imagery. The onboarding screen introduces the product with a simple promise: “Track Your Sales. Grow Further.” Instead of explaining every feature through lengthy copy, it highlights the three core functions of the platform: tracking sales, managing clients, and reaching revenue goals. A single Get Started action keeps the entry experience focused and mobile-first. The main dashboard opens with a personalized greeting and immediately surfaces the most important sales metrics. Total Sales sits at the top of the hierarchy alongside month-over-month growth and a compact performance chart. Supporting KPI cards show Deals, Clients, Pipeline Value, and Conversion Rate, allowing users to understand the state of their business within seconds. Sales performance is presented visually rather than through lengthy reports. The dashboard combines bar charts, percentage movements, status indicators, and compact cards to show trends at a glance. Metrics such as $24,680 in total sales, 18 active deals, 24 clients, a $56,200 pipeline, and a 32% conversion rate are organized in a consistent grid so users can compare performance without leaving the screen. The Recent Activity section turns the dashboard into an operational workspace rather than a static analytics page. New deals, client meetings, proposals, and other sales events are shown chronologically with clear timestamps. This gives users a quick understanding of what has happened recently and where follow-up may be required. The client detail experience is designed as a lightweight CRM. A client such as Apex Industries opens into a dedicated profile containing account status, communication shortcuts, deal information, activity, documents, and follow-up details. Quick actions for calling, emailing, scheduling meetings, and adding notes are positioned near the top so the screen supports action as much as information. Client performance is summarized through compact metrics including total account value, number of deals, last contact date, and next follow-up. A sales progress module visually compares the current value against the target, while the activity timeline records milestones such as meetings completed, proposals sent, client responses, and negotiation progress. Rather than forcing users through separate modules for every task, the interface keeps sales context connected. A representative can move from overall revenue performance to a specific account, review the relationship history, add a note, or schedule the next interaction without breaking the workflow. Across the product, a five-tab bottom navigation structure; Home, Deals, Clients, Reports, and More, keeps the information architecture predictable. Components, spacing, card dimensions, iconography, and typography remain consistent across screens, making the experience feel like one connected mobile product rather than several dashboards placed together. Frontend I built the client as a cross-platform mobile application using React Native and TypeScript. React Navigation manages the bottom-tab structure and stack navigation between dashboards, deal records, client profiles, reports, and activity screens. TanStack Query handles API data fetching, caching, background refreshing, and loading states, while Zustand manages lightweight client-side state such as active date ranges, dashboard filters, selected pipeline stages, and temporary UI preferences. The dashboard is built from reusable components including Metric Cards, Sales Charts, Pipeline Cards, Activity Rows, Client Cards, Progress Indicators, and Quick Action controls. A centralized design-token system manages spacing, typography, border radii, dark surfaces, and accent colors to maintain visual consistency across every screen. Chart components use lightweight mobile visualization libraries to display revenue trends, deal progression, conversion rates, and pipeline performance without overcrowding smaller screens. Responsive layouts ensure every dashboard element maintains proper mobile proportions rather than shrinking desktop-style panels into a phone interface. Backend The backend is a Node.js REST API built with NestJS and PostgreSQL through Prisma ORM. The primary data model covers Users, Clients, Contacts, Deals, Pipelines, Sales Activities, Notes, Meetings, Tasks, Sales Targets, and Reports. Each deal stores its value, pipeline stage, probability, assigned salesperson, expected close date, client relationship, status, and activity history. Client records contain contact details, account value, associated deals, last interaction, upcoming follow-ups, notes, and relationship status. Sales calculations are generated from transactional deal data rather than manually stored dashboard totals. This allows metrics such as total sales, pipeline value, conversion rate, closed deals, average deal size, and target achievement to update automatically as opportunities progress through the pipeline. Endpoints support dashboard analytics, client search, deal filtering, pipeline management, activity logging, follow-up scheduling, and reporting. For example, dashboard requests can be filtered by salesperson, period, team, or deal stage so the same architecture can support both individual representatives and sales managers. Authentication uses JWT access and refresh tokens with role-based permissions for sales representatives, managers, and administrators. PostgreSQL stores transactional CRM data, Redis can be used for frequently accessed dashboard aggregates, and WebSockets can optionally provide live updates when deals, activities, or team metrics change. The result is a mobile-first sales management experience that combines CRM functionality with meaningful sales analytics. SalesTrack gives users a fast, visually clear way to understand performance, manage clients, track opportunities, and decide what action needs to happen next — without the complexity normally associated with traditional CRM platforms.
1
187
0
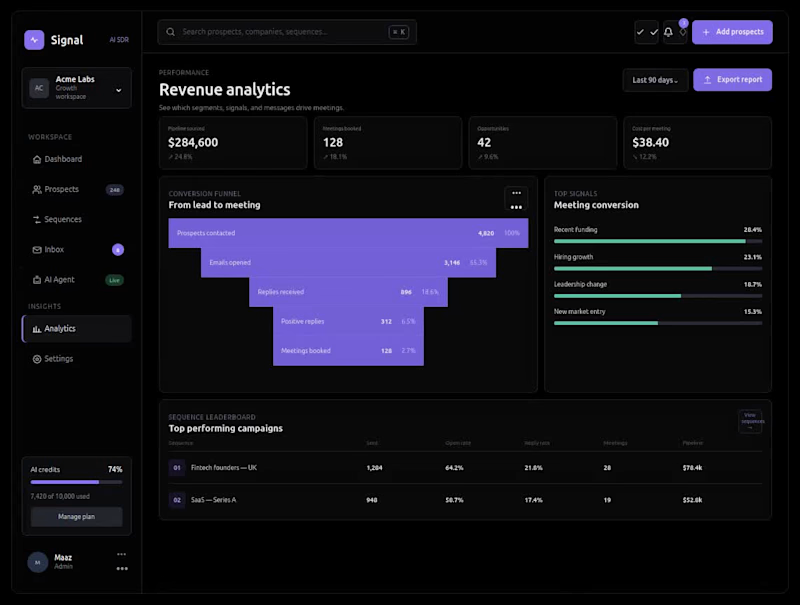
Signal: AI-Powered Sales Development and Outreach Platform I designed Signal as a full-stack AI sales development platform that helps teams discover prospects, manage outreach sequences, prioritize conversations, and convert engagement into qualified meetings. Instead of spreading sales activities across disconnected tools, Signal brings prospect research, communication, automation, and performance reporting into one focused workspace. The visual identity uses a pitch-black interface with subtle violet, teal, green, and amber accents. Flat panels, restrained borders, professional outline icons, and generous spacing give the product a confident, human-designed appearance. Color is used functionally to distinguish active sequences, positive responses, scheduled meetings, prospect scores, and automation statuses without overwhelming the interface. The main dashboard provides an immediate overview of active prospects, emails sent, reply rates, and meetings booked. Outreach performance is displayed through clean charts, while campaign tables highlight prospect volumes, delivery activity, and response rates. A dedicated research queue shows the work currently being completed by the sales agent without relying on distracting animations or exaggerated AI visuals. The Prospects screen operates as the central lead database. Users can search and filter contacts, review company information, examine buying signals, compare qualification scores, and track each prospect’s latest activity. Qualified prospects can be moved directly into outreach sequences, creating a connected workflow from discovery to engagement. The Sequences workspace enables teams to build and monitor structured, multi-step campaigns across email and LinkedIn. Every sequence presents its delivery schedule, prospect volume, open rate, reply rate, meetings generated, and current operating status. The connected Inbox brings replies into one place, prioritizes high-intent conversations, and provides context-aware response suggestions that users can review, edit, or send. The AI Agent workspace gives users control over automated prospecting. Teams can define their ideal customer profile using industry, company size, geography, seniority, department, and buying-signal criteria. Guardrails and written instructions determine how prospects are researched, qualified, enriched, and prepared for outreach, while a live activity log keeps every automated action visible and accountable. The Analytics screen connects outreach activity to commercial outcomes. It tracks pipeline sourced, meetings booked, opportunities created, cost per meeting, funnel conversion, top-performing buying signals, and sequence-level performance. This allows sales leaders to understand not only how much activity is taking place, but which audiences, signals, and messages are producing meaningful results. The backend architecture is designed around a secure REST or GraphQL API layer built with Node.js and TypeScript. PostgreSQL stores users, workspaces, prospects, companies, sequences, messages, tasks, campaign events, and analytics records. Redis supports caching, background queues, rate limiting, and scheduled outreach, while asynchronous workers handle enrichment, qualification, message generation, email delivery, follow-ups, and CRM synchronization. AI capabilities are managed through a controlled orchestration layer that combines company data, prospect history, buying signals, sequence context, and user-defined instructions. Retrieval-based context can be used to ground generated messages in approved company information, while approval workflows, audit logs, prompt controls, and configurable sending limits provide operational oversight. Authentication uses secure session or token-based access with role-based permissions for administrators, managers, and sales representatives. External integrations can connect Signal with email providers, LinkedIn-compatible workflows, calendars, enrichment services, and CRM platforms such as HubSpot or Salesforce. Webhooks capture delivery, open, reply, bounce, booking, and opportunity events in near real time. Across the complete product, I prioritized clarity, practical automation, transparent AI assistance, and connected navigation between Dashboard, Prospects, Sequences, Inbox, AI Agent, Analytics, and Settings. The result is a modern sales development platform that feels focused, professional, scalable, and genuinely useful to the people responsible for building pipeline.
0
146
6
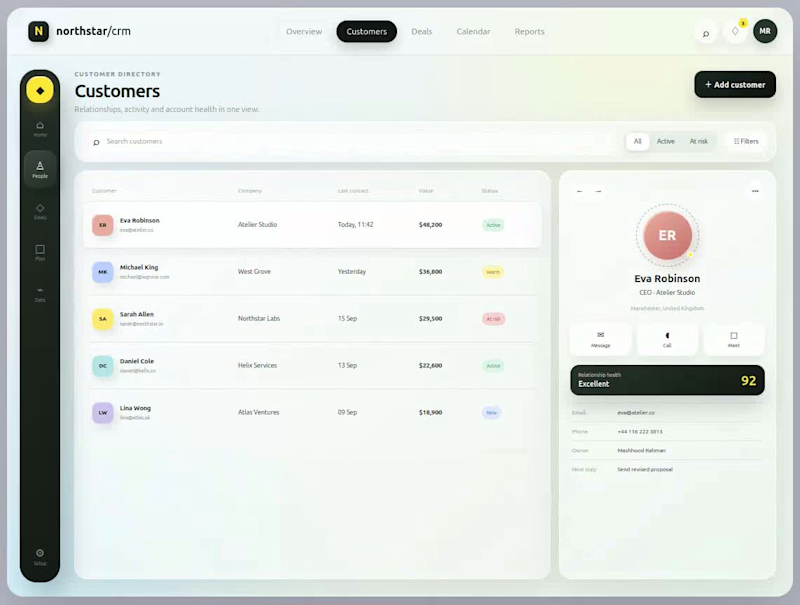
Northstar CRM: Full-Stack Customer Relationship and Sales Management Platform I designed and developed Northstar CRM to transform customer relationship management into a focused, visually intuitive, and connected workspace. Instead of overwhelming sales teams with dense tables and fragmented tools, I structured the platform around clear customer insights, actionable sales data, and streamlined daily workflows. The visual identity combines a soft atmospheric background with glass-inspired surfaces, dimensional cards, and vibrant blue, teal, yellow, and charcoal accents. Carefully layered shadows, subtle gradients, and elevated components create a refined 3D appearance while maintaining clarity and professional usability. The entire interface follows a consistent 4:3 presentation ratio, making every screen suitable for portfolio displays and high-quality screenshots. The overview dashboard gives users an immediate picture of business performance. Key metrics—including total revenue, pipeline value, completed tasks, priority deals, recent activities, and upcoming meetings—are presented through scannable cards, progress indicators, compact charts, and contextual status colours. This allows teams to identify important changes and required actions without navigating through multiple reports. The customer management screen provides a searchable directory with company information, recent interactions, account value, relationship status, and assigned ownership. Selecting a customer dynamically updates the detailed profile panel, where users can review contact information, relationship health, next actions, and communication options such as messaging, calling, or scheduling a meeting. The deal pipeline organizes opportunities into clear stages, including Discovery, Proposal, Negotiation, and Closing. Each opportunity card displays its customer, estimated value, expected closing date, owner, and current stage. The Kanban-style structure gives sales teams a visual understanding of pipeline movement while supporting faster prioritization and opportunity management. The calendar and reporting screens connect operational planning with performance analysis. The calendar provides monthly scheduling, customer meetings, deadlines, focus time, and team commitments. The reporting workspace combines revenue trends, conversion rates, customer retention, pipeline sources, account health, and period-based performance comparisons through interactive charts and summary cards. On the backend, I implemented a modular Node.js and Express REST API connected to a PostgreSQL database. The data model supports users, customers, companies, contacts, deals, pipeline stages, activities, tasks, meetings, notes, and reporting records. Structured relationships and indexed queries ensure that customer histories, pipeline summaries, and dashboard analytics remain fast and consistent as the dataset grows. Authentication is handled through secure token-based sessions, password hashing, protected API routes, and role-based access control. Different permissions can be assigned to administrators, sales managers, and sales representatives, ensuring users only access or modify information relevant to their responsibilities. Input validation, centralized error handling, audit logging, and rate limiting strengthen reliability and application security. Real-time updates allow changes to deals, tasks, customer activity, and meeting schedules to appear across connected screens without requiring a manual refresh. Background processes handle reminders, notifications, scheduled follow-ups, and reporting calculations, while caching improves the performance of frequently requested dashboard metrics. Across the complete full-stack platform, I prioritized reusable frontend components, responsive layouts, secure API design, reliable data relationships, and consistent interaction patterns. The result is a modern CRM experience that feels premium and approachable while providing the technical foundation required for scalable customer management, sales execution, and business intelligence.
4
6
1.1K
0
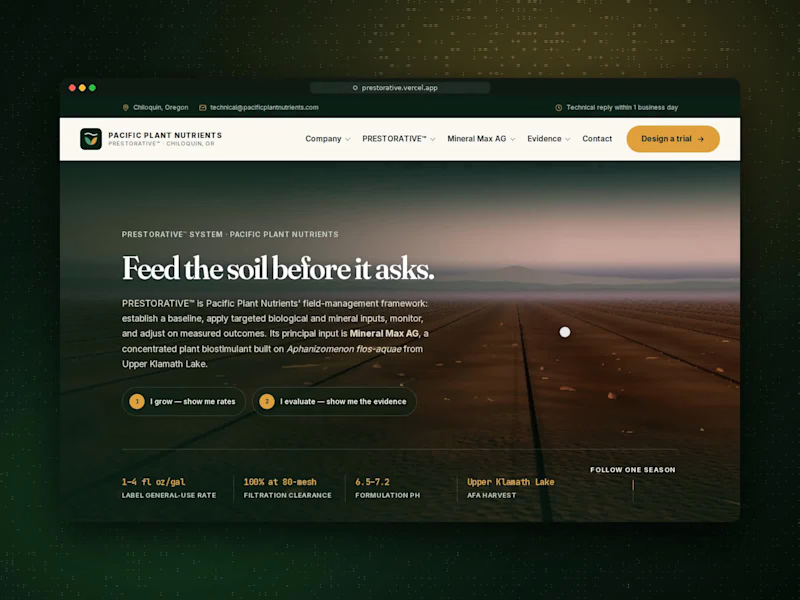
PRESTORATIVE™ (Pacific Plant Nutrients) I designed this website for an agricultural biostimulant brand whose buyers are practical and sceptical: growers who want application rates, and agronomists and distributors who want proof. The challenge was to make a biological product feel credible and easy to understand without relying on big marketing claims. The hero opens on a 3D farm field at dusk under the headline "Feed the soil before it asks." Two buttons split visitors by what they need: "I grow — show me rates" and "I evaluate — show me the evidence." Key product facts sit below in amber monospace type, like readings on a field instrument. I paired an editorial serif with that data typeface, on a palette of deep forest green, warm cream and amber. The centrepiece is "One season," a scroll-driven 3D story. As visitors scroll, a single seed sits in the soil, puts down roots and grows into a full field of crops under a setting sun. Along the way the five stages of the program appear: Assess, Plan, Apply, Measure and Adapt. Floating labels mark the water, root zone, biological activity and mineral environment, and a stage tracker at the bottom shows where you are in the season. It turns an abstract field-management method into something visitors can watch happen. The rest of the page is built around proof rather than promises: Three names, one job each: clear cards separate the company, the system and the product. Product specification: laid out like a technical data sheet. Crop rate engine: choose one of six crops, a growth stage and your acreage, and it calculates the dose and carrier volume. Technical assistant: answers questions from the product documentation. Evidence library: a record carousel with a grading system, "Read the grade before you read the number," so every result shows how strong its evidence is. Toxicology section: tackles the toughest objection head-on: "Isn't this the toxic Klamath algae?" After grower testimonials, the page closes with a confident invitation: "Don't take our word for it. Test it against your current program."
0
8
Backend Engineer
(3)
Follow
Message
Sakhawat Hussain
Karachi, Pakistan
Full stack and Ai powered agents developer
34
Followers
Follow
Message
Full stack and Ai powered agents developer

0
😍
0
17
1
Elevate Your Salon’s Online Presence👍 First impressions are everything in the beauty industry. If you’re looking to transform your salon’s digital space, this premium template is designed to do exactly that.💯 I’ve crafted this website template specifically for beauty professionals who want a sleek, modern, and high-converting look. It’s built to balance stunning aesthetics with seamless functionality—allowing your clients to view services, check portfolios, and book appointments with ease. Why this template stands out:👍 Visual-First Design: Optimized to showcase your high-quality imagery and branding. Client-Focused Layout: Intuitive navigation so your visitors find what they need in seconds. Fully Responsive: It looks just as beautiful on a mobile screen as it does on a desktop. Ready to Customize: Easy to personalize with your own colors, typography, and content. Whether you're a boutique studio or a growing salon, this template provides the perfect foundation to help your business look as professional as the services you provide. Interested in leveling up your online presence? Check out the live preview and let’s get your salon the website it deserves. 😍 💯
1
84
0
E-commerce Full-Stack Development
0
10
1
Building modern, scalable, and user-friendly web applications 🚀 I specialize in Full-Stack (MERN) development, creating responsive UIs, secure authentication, Firebase integrations, and performance-optimized solutions. Always focused on clean code, great UX, and real business value.
1
72
Backend Engineer
(7)
Follow
Message
Faisal Ismail
pro
Karachi, Pakistan
Senior .NET developer building web, mobile & API products
New to Contra
Follow
Message
Senior .NET developer building web, mobile & API products
0
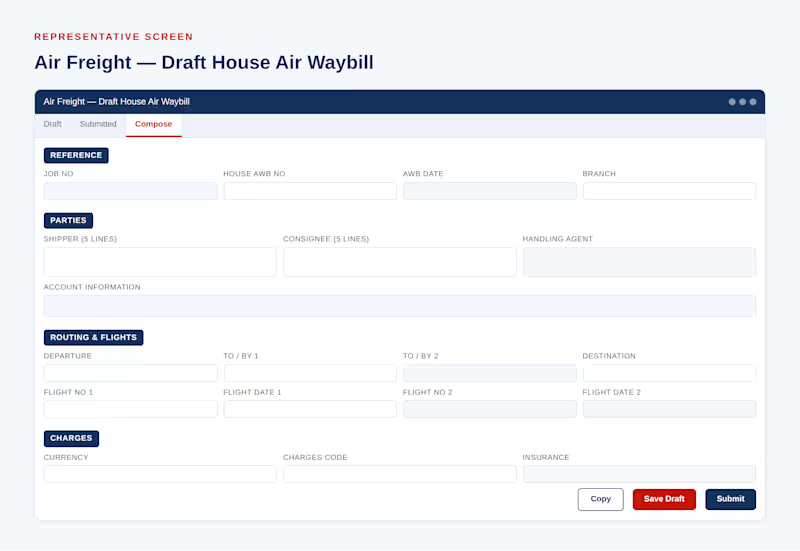
A self-service portal that lets a freight forwarder's customers prepare their own shipping documents online, instead of emailing drafts back and forth. The old process: a customer emails their shipping instructions, the forwarder's documentation team keys them into a draft Bill of Lading, emails a PDF back, the customer spots a typo, and the loop repeats. Every round trip is a chance to get a consignee address wrong. Now the customer logs in and drafts it themselves. They fill the House Bill of Lading or Air Waybill form directly — shipper, consignee, routing, flights, charges — save it as a draft, edit it as many times as they need, copy a previous shipment for a repeat booking, and print a draft PDF to check. When they submit, the record locks, becomes read-only, and a generated PDF goes to the documentation team. Multi-tenant, so each customer sees only their own documents. Built with C# / ASP.NET (http://ASP.NET) and SQL Server.
0
52
0
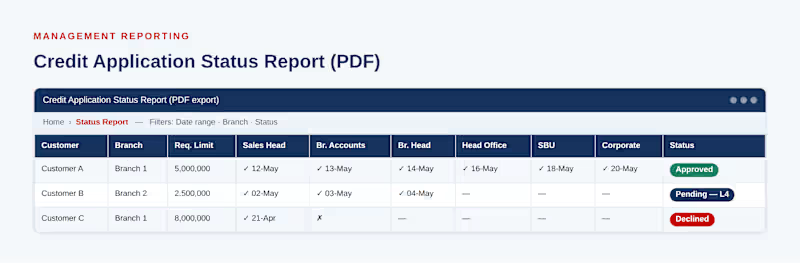
A web platform that replaced a paper-and-email credit approval process with a tracked digital workflow. Before it, a customer's credit request moved through the company as a form that got signed, scanned, emailed and chased. Nobody could answer "where is it right now?" without phoning three people. The system turns that into a seven-level sequential approval chain — sales person raises the request with the limit, terms, financials and supporting documents; it moves through sales head, branch accounts, branch head, head office, SBU head and finally corporate approval. Each level sees exactly what it needs, every action is timestamped and attributed, and stakeholders are notified by email as it moves. On final approval the credit facility goes live automatically. It also generates the PDF reports management uses to review exposure across branches. Built with C# / ASP.NET (http://ASP.NET) and SQL Server.
0
43
0
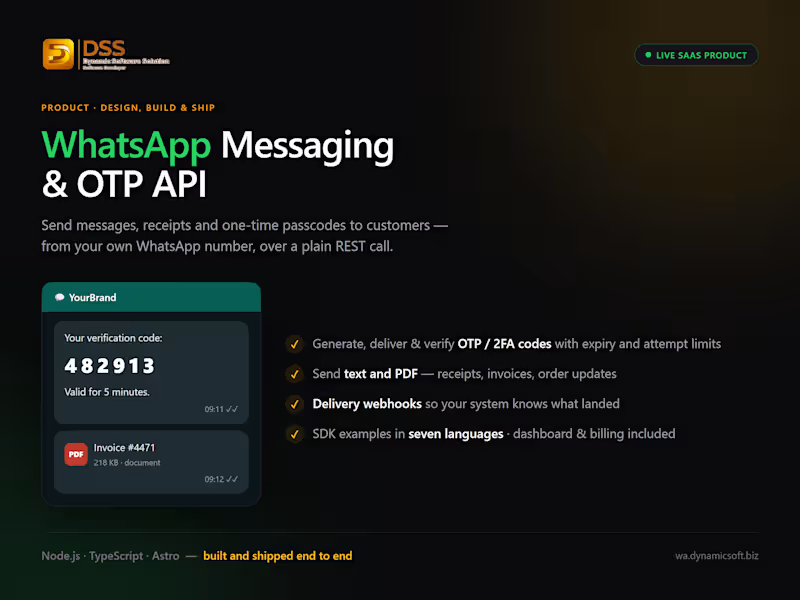
A messaging API that lets businesses send WhatsApp messages and documents from their own number, programmatically. The problem it solves: a small business wants to send order confirmations, receipts and invoices on WhatsApp — where their customers actually are — but the enterprise options are heavy, slow to get approved, and priced for companies far larger than them. So I built the alternative. One REST endpoint to send a message, another to attach a PDF, and delivery webhooks so your system knows what landed. OTP codes with expiry and attempt limits for login and 2FA. SDK examples in seven languages, a dashboard to manage it, and a subscription that starts at $19/month. I designed, built and shipped the whole thing — API, dashboard, billing, docs and marketing site. Node.js and TypeScript on the backend, Astro for the site.
0
49
0
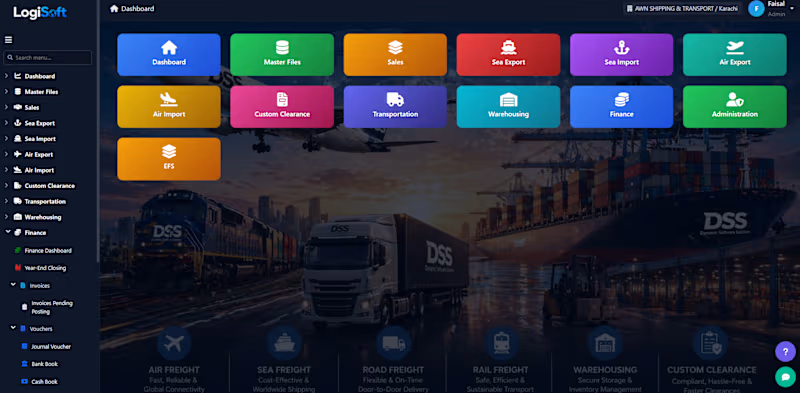
LogiSoft is a freight-forwarding ERP I designed and built for logistics companies that were running their operations on spreadsheets and email. It covers the full shipment lifecycle in one system: customer and carrier bookings, sea and air import/export jobs, house and master bills of lading, allotments, invoicing, and finance — with party master data and role-based administration underneath. The part I'm most proud of is the document handling. Instead of staff re-keying details from incoming shipping documents, the system reads them and maps the data straight into the right ERP fields. I built that on the Claude API, along with an in-app assistant that answers questions about shipments and lets users ask for what they need in plain language. Built with C#/.NET and SQL Server, with a web front end. It's in daily production use. What I do best: taking a messy, paper-heavy business process and turning it into software people actually want to use.
0
50
Backend Engineer
(4)
Follow
Message
Explore people