The network for creativity
Join 1.25M professional creatives like you
Connect with clients, get discovered, and run your business 100% commission-free
Creatives on Contra have earned over $150M and we are just getting started
Back to feedPost


From Instinct to Infrastructure: How Athliq Went From Trainer's Notebook to Production Performance Platform
──────────────────────────────────────────
The Person Who Understood the Problem Before Anyone Else Did
Marcus had been a strength and conditioning coach for eleven years. He'd worked with professional football squads, Olympic track athletes, and NCAA programs. He knew exactly what was wrong with how performance data was managed, not because someone told him, but because he'd lived inside the problem every day.
Every morning, he'd open four browser tabs, a spreadsheet, and a WhatsApp thread just to answer one question: Is this athlete safe to train today?
HRV from one app. Sleep data from another. Yesterday's load from a Google Sheet. Wellness check-ins in a form nobody filled out consistently. Injury notes in a physio's personal folder. The picture was always incomplete, not because the data didn't exist, but because no system was designed to assemble it.
He wasn't guessing the problem. He was the problem's daily victim.
So he built something.
──────────────────────────────────────────
The First Version Had Real Value
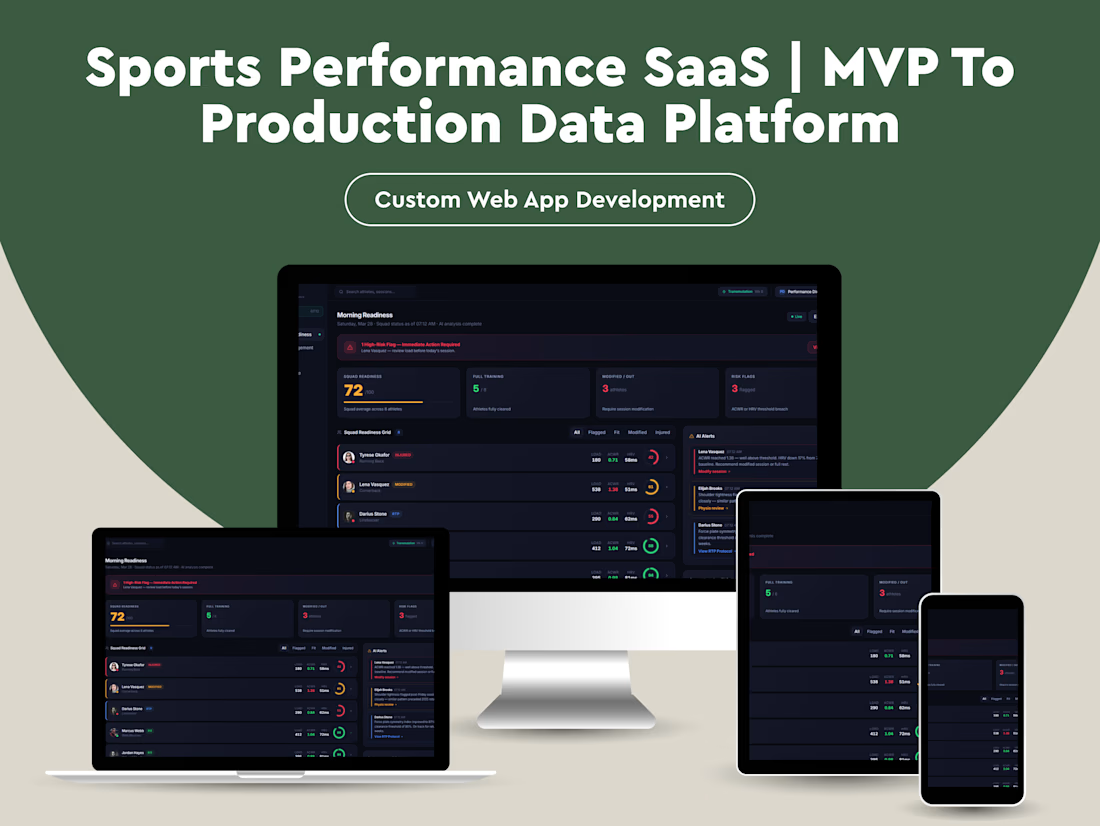
What Marcus and a developer friend put together in six weeks was genuinely useful. A React frontend. Static JSON files simulating the data feeds he wished he had. A morning readiness dashboard showing each athlete's status: green, amber, red. ACWR calculations. A training plan view. A return-to-play protocol tracker.
It looked like a real platform. It felt like one. When he demoed it to his performance director, the response was immediate: "This is what we've been trying to build for two years."
The prototype surfaced something important. The problem wasn't that nobody had the data. The problem was nobody had designed the right lens to look at it through. Marcus had. His system organized information around the questions coaches actually ask, not the questions software vendors assume they ask.
The initial build worked. For one squad. In static conditions. With fake data.
And that was exactly the point where it started to matter, and exactly the point where its limitations became unavoidable.
──────────────────────────────────────────
What Started Breaking
The prototype had no backend. Data was hardcoded. Every "insight" was pre-written. The readiness scores didn't calculate; they were authored. When a second sport scientist saw the demo and said, "Can we plug in our GPS data?" there was no honest answer that didn't involve a complete rebuild.
More specifically:
The data layer was decorative. The JSON files looked real but required manual authoring for every scenario. There was no pipeline, no ingestion, no validation. Any live deployment would mean the dashboard showed stale or fabricated numbers, which in a performance context is worse than showing nothing at all.
The AI insights were static strings. Every "AI-generated" recommendation was hardcoded text. In the prototype, this was fine. It demonstrated the concept. In production, it would mean the same insight appearing for every athlete regardless of their actual state, silently eroding clinician trust.
The system had no concept of time. Training load calculations, ACWR ratios, wellness trends, all of these are temporal by definition. The prototype rendered them as snapshots. A real system needed rolling windows, historical comparison, and the ability to detect change over time.
There was no role isolation. The role switcher in the UI was cosmetic. A physio and a performance director seeing the same underlying data with a CSS class change was not access control, it was theater.
Nothing would survive a real integration. Real wearables return messy, incomplete, delayed data. The system had no error handling, no retry logic, no fallback states. The first real data feed would have broken the UI in ways that were invisible until they were catastrophic.
The system was not wrong. It was early.
──────────────────────────────────────────
Why They Didn't Just Fix It Themselves
Marcus understood sport science. His developer understood React. Neither of them had built a production data system before, and that gap is not a skills deficiency, it is a domain specialization.
What they needed was not someone to rewrite their frontend. The frontend was actually good. The visual hierarchy was sharp, the domain terminology was accurate, the workflows reflected how coaches genuinely think. That institutional knowledge was irreplaceable and not to be discarded.
What they needed was:
• A real-time data layer that could ingest from multiple sources reliably
• A calculation engine that could run ACWR, load zone distributions, and readiness scoring against live data
• A structured API contract between the front and back end
• Authentication and role-based data scoping that actually enforced access boundaries
• Observability, so when something silently broke, someone would know
The prototype had proven the concept. The job now was to make the concept dependable.
──────────────────────────────────────────
What We Actually Did
We kept the frontend. Almost entirely. The visual design, the component architecture, the domain-accurate terminology, all of it stayed. We refactored the data layer, not the UI layer. The prototype's greatest strength was its UX fidelity to how coaches actually work, and we had no interest in rebuilding that from scratch.
We built a real data ingestion pipeline. Rather than static JSON, we designed a service layer that could ingest from GPS units, HRV monitors, and wellness form submissions. Each source had its own adapter with validation, normalization, and error handling. Partial data was acceptable; silently wrong data was not.
We replaced static calculations with a live computation engine. ACWR calculations now ran against a rolling 28-day window of actual load data. Readiness scoring pulled from real HRV baselines, not fixed numbers, and recalibrated as an athlete's personal baseline shifted over a training block.
We replaced pre-written AI insights with a rules-based inference layer. Every insight shown in the platform now corresponded to a condition that was evaluated against live data. If Lena Vasquez's ACWR crossed 1.3 and her HRV dropped more than 15% from her 7-day baseline, the injury risk flag was triggered, not because it was hardcoded, but because those conditions were true.
We implemented real role-based access control. A physio sees medical data, injury history, and RTP protocols. A sport scientist sees load analytics and benchmarks. A performance director sees the squad-level overview. A head coach sees readiness and today's session. The frontend already had role-switching built in, we gave it actual enforcement.
We added observability throughout. Every data ingestion event was logged. Every calculation that produced an out-of-range result generated an alert. If a data source stopped sending, the system surfaced a staleness warning rather than silently displaying old numbers as current.
──────────────────────────────────────────
Tech Stack
React 19 + Vite, Tailwind CSS v3, Recharts, React Router v7, Node.js + Fastify, PostgreSQL + TimescaleDB, Redis, GPS/HRV/sleep data adapters (Catapult, Polar, Garmin), Google Forms/Typeform ingestion, Auth0, row-level security, Sentry, Datadog, Railway/Render, Vercel, Supabase Storage
What Changed
The morning workflow Marcus had been running across four tabs and a spreadsheet now ran in a single view that was populated automatically before he arrived at the training ground.
The difference wasn't just convenience. It was confidence.
When the dashboard flagged an athlete as high-risk, the coaching staff could interrogate why and trust the answer. When a return-to-play progression showed 80% completion, that number reflected actual criteria met against measured data, not a manually updated percentage.
The platform was no longer a demo tool. It was a clinical decision-support system.
For the squads using it, the shift was measurable: fewer reactive injury responses, more consistent load monitoring, and perhaps most importantly, a shared language between coaching staff, physios, and sport scientists built around the same data rather than competing interpretations of separate sources.
──────────────────────────────────────────
The Part That Rarely Gets Said
Most platforms built in this space start from the software side. Someone builds a data collection tool, adds a dashboard, and then tries to reverse-engineer what coaches actually care about.
Athliq started from the other direction. A domain expert who understood the problem at a professional level built the frame first, and built it correctly. The pain points were real, the workflows were accurate, the terminology was precise.
The engineering work didn't fix a bad idea. It made a good idea survivable.
That distinction matters more than most technical case studies acknowledge. The hardest part of building a platform like this is not the infrastructure. It's knowing which questions to answer. That knowledge was already there.
Our job was to make sure the system could keep answering them reliably, at scale, over time.
──────────────────────────────────────────
Athliq is now in active deployment across two professional squads and one university performance program. The morning readiness dashboard processes real-time data from four integrated sources and serves role-scoped views to performance directors, sport scientists, physiotherapists, and athletes.



Strong case study, especially the decision to preserve the domain-accurate frontend and replace the simulated data layer with dependable ingestion, calculations, RBAC, and observability. That prototype-to-production transition is where I do much of my best work as well. I’ve...
contra.com
Waleed yaseen - Backend Engineer | Contra
Full-Stack Developer | AI & Web3. View Waleed yaseen’s Profile on Contra. The Independent-first, commission-free freelance marketplace shaping the future of work.
The network for creativity
Join 1.25M professional creatives like you
Connect with clients, get discovered, and run your business 100% commission-free
Creatives on Contra have earned over $150M and we are just getting started











Related posts

Trax Omni: Multi-Company Sales CRM + Mobile App, Built From Scratch
THE PROBLEM
Small and growing sales teams run on WhatsApp chats, Instagram DMs, spreadsheets and memory. Leads come from five places, nobody knows who replied to whom, follow-ups are forgotten, and the owner can't see what's actually in the pipeline. Every slow reply is a lost customer.
WHAT WE BUILT
Trax Omni, a complete sales CRM product, designed and built from scratch by UI Trax:
Product website: explains the product, shows industry templates, and lets a business create its own workspace
Today dashboard: total leads, open pipeline, won revenue, win rate and the next actions to take
Leads: source, stage, value, owner and score for every inquiry, with import and filters
Pipeline: drag-and-drop stages from Inquiry to Won, with custom stages
Sales Copilot: ask in plain words ("show my hot leads with no activity for 3 days"); it finds leads and drafts follow-ups, and nothing changes until you confirm
Tasks & follow-ups: open, overdue and completed tasks, so no lead goes cold
Automations: round-robin lead assignment, follow-up tasks and stage-based next steps
Reports & forecast: pipeline distribution, weighted forecast and revenue targets
Team & roles: separate owner, manager and employee views; each person sees only what they should
Campaigns: Meta and TikTok lead campaigns, with their leads brought into the pipeline
Quotes & invoices, WhatsApp inbox and email connected to each lead
Mobile app for iOS & Android with a full English and Urdu interface
HOW IT WAS BUILT
Multi-company setup: each business gets its own private workspace
Backend in Node.js with a PostgreSQL database
Mobile app in React Native (Expo)
Secure sign-in with Google Workspace / Microsoft SSO and MFA
Automated test suites for the backend, the mobile app and the dashboards
STATUS
Built and in final launch testing. The screens show sample data from the interactive preview.


No After Effects. No manual keyframes.
Just pure React, frame-level spring math, and code.
Built this SaaS product reel completely with Remotion at 60fps. Programmatic motion design makes it effortless to keep animations 100% true to real product UI while allowing programmatic variant generation.
💯 What you receive as a deliverable:
🎬 Production Video: 4K/60fps .mp4 or .webm ready for social, ads, and landing pages
🪟 Transparent Overlays: Alpha-channel .mov (ProRes 4444) to drop over your existing product footage
🔁 Looping Assets: Optimized .gif files for GitHub readmes and email campaigns
💻 Web Native: Interactive React @remotion/player components or automated server-side render scripts
Stack:
• React
• Remotion (useCurrentFrame, spring, interpolate)
• Headless Chromium render pipeline
Taking on 2 new projects this month for SaaS and dev-tool teams looking for high-end product animations.
DMs are open—let’s build.


I'm currently building a PDF data extraction application for road freight and logistics companies.
I'm focusing on flexible field selection, local document processing, and handling different PDF layouts.