
SAP MM/WM & Power BI Specialist | Inventory & Supply Chain
New to Contra
SAP MM/WM & Power BI Specialist | Inventory & Supply Chain
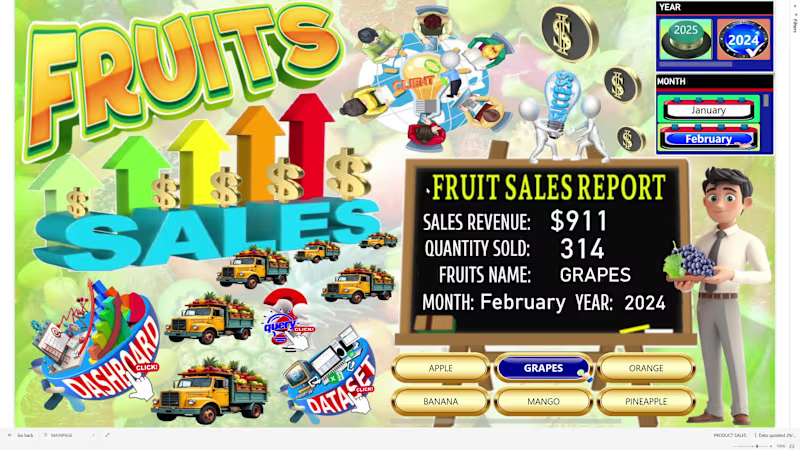
### 🍍 Fruit Sales Data Analysis – Interactive Power BI Dashboard
An interactive Power BI dashboard designed to analyze fruit sales performance and provide clear graphical insights into revenue, sales volume, product, size, and geographic performance.
The dashboard includes:
Sales Revenue – total revenue generated from fruit sales
Total Sales Quantity – total quantity of fruits sold
Sales by Fruit Name – compares sales performance across different fruits
Sales by Size – analyzes sales across different fruit sizes
Sales by City – identifies sales performance by city
Sales by Country – compares sales across countries
Sales per Month – monitors monthly sales performance
Revenue per Month – tracks monthly revenue trends
Sales Trend by Fruit – analyzes monthly sales trends by fruit name
Geographic Sales Analysis – identifies locations with the highest and lowest sales performance
The interactive dashboard allows users to explore product, size, time, and geographic sales patterns, helping identify top-performing fruits and markets while supporting data-driven sales and business decisions.
Key value:
Sales data → KPI analysis → Product & size analysis → Geographic analysis → Monthly trends → Graphical insights → Business decisions
0
106
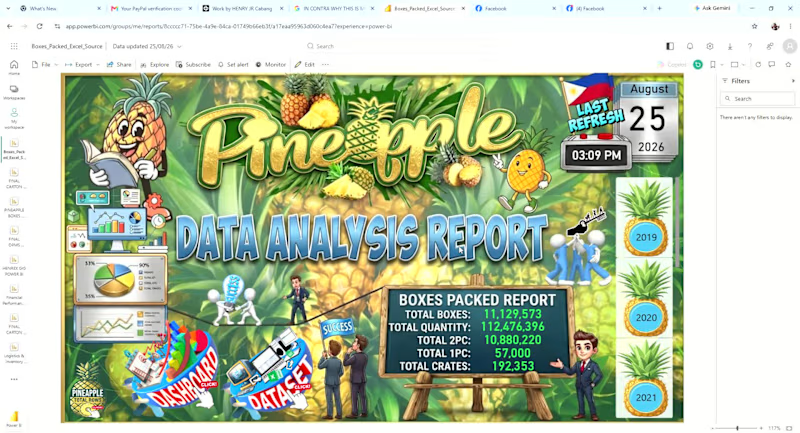
An interactive Power BI dashboard designed to monitor pineapple production and packing performance from 2019 to the present year.
The dashboard provides graphical insights into:
Total Pineapple Boxes Packed – overall production/packing volume
Daily, Weekly, Monthly, and Yearly KPIs – performance monitoring across different time periods
Packing Trends – identifies production trends and changes over time
Brand Distribution – boxes packed by brand
Tag Distribution – analysis of packing tags
Variant Distribution – comparison of different pineapple variants
Pack Size Distribution – analysis of boxes packed by pack size
Time-Based Analysis – allows users to drill into daily, weekly, monthly, and yearly performance
The dashboard helps management quickly understand packing volume, production trends, and product mix, while identifying changes in brand, tag, variant, and pack-size distribution.
Key value:
Production data → KPI analysis → Trend analysis → Product mix → Graphical insights → Better operational decisions
0
81

An interactive Power BI dashboard designed to provide clear graphical insights into coffee sales performance and customer purchasing patterns.
The dashboard analyzes:
Total Sales – overall coffee sales performance
Total Cups Sold – total number of cups sold
Monthly Sales KPI – tracks sales performance by month
Sales by Month – identifies monthly sales trends
Sales by Time of Day – compares morning, afternoon, and evening/night sales
Sales by Product – identifies which coffee products generate the highest sales
Product Performance by Time of Day – shows which coffee products perform best during morning, afternoon, or night
The interactive visuals make it easy to identify top-selling coffee products, peak sales periods, and monthly performance trends, helping management understand customer purchasing behavior and make better sales decisions.
Key value:
Sales data → KPI analysis → Interactive visualization → Customer insights → Better sales decisions
0
89
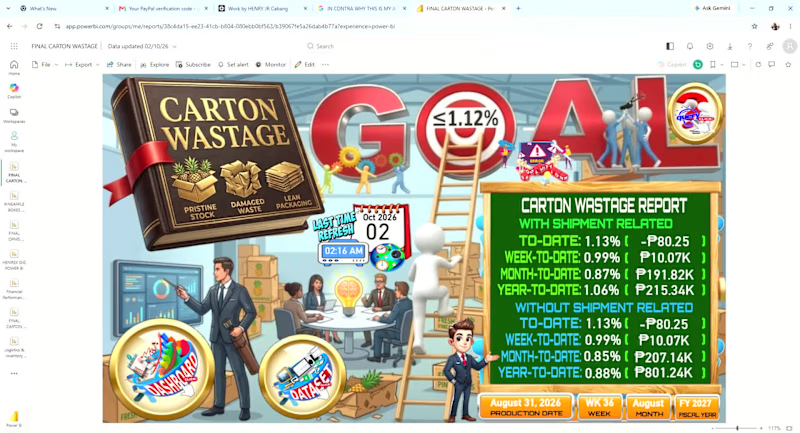
An interactive Power BI dashboard designed to monitor and analyze carton wastage and its cost impact against the Annual Operating Plan (AOP).
The dashboard provides daily, weekly, monthly, and yearly analysis of:
Carton wastage and quantity trends
Wastage cost impact vs. AOP
Causes of damage and their contribution to total wastage
Team performance, including the team with the highest damage
Daily, weekly, monthly, and yearly trends
Interactive buttons for easy navigation between different time periods
Power BI Q&A page for users to ask questions and explore the data interactively
The dashboard transforms raw operational data into clear graphical insights, helping management identify major wastage drivers, monitor trends, compare actual performance against AOP, and determine areas that require corrective action.
Key value:
From wastage data → KPI analysis → graphical visualization → business insights → actionable decisions.
0
87


Healthcare VA Expert | Empowering Care, Virtually 💖
- 19
- Followers
Healthcare VA Expert | Empowering Care, Virtually 💖


View more →

AI & Automation | n8n/Make/Zapier/Airtable/Notion | CRM SaaS
- 58
- Followers
AI & Automation | n8n/Make/Zapier/Airtable/Notion | CRM SaaS




Projects + Teams + Systems Management for Entrepreneurs
Projects + Teams + Systems Management for Entrepreneurs


C-level Virtual Executive Assistant & Project Manager
- 11
- Followers
C-level Virtual Executive Assistant & Project Manager


View more →

Customer Support Professional | Efficient Admin Assistant
Customer Support Professional | Efficient Admin Assistant





Versatile Email & Product Marketing Specialist
Versatile Email & Product Marketing Specialist


View more →

Adaptable Virtual Assistant with Attention to Detail
Adaptable Virtual Assistant with Attention to Detail


