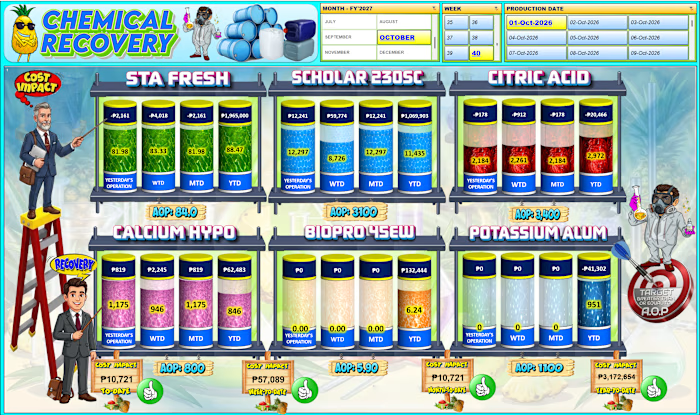
An interactive Power BI dashboard

HENRY JR Cabang


An interactive Power BI dashboard designed to monitor pineapple production and packing performance from 2019 to the present year.
The dashboard provides graphical insights into:
Total Pineapple Boxes Packed – overall production/packing volume
Daily, Weekly, Monthly, and Yearly KPIs – performance monitoring across different time periods
Packing Trends – identifies production trends and changes over time
Brand Distribution – boxes packed by brand
Tag Distribution – analysis of packing tags
Variant Distribution – comparison of different pineapple variants
Pack Size Distribution – analysis of boxes packed by pack size
Time-Based Analysis – allows users to drill into daily, weekly, monthly, and yearly performance
The dashboard helps management quickly understand packing volume, production trends, and product mix, while identifying changes in brand, tag, variant, and pack-size distribution.
Key value:
Production data → KPI analysis → Trend analysis → Product mix → Graphical insights → Better operational decisions
Like this project
Posted Oct 2, 2026
An interactive Power BI dashboard designed to monitor pineapple production and packing performance from 2019 to the present year. The dashboard provides grap...