Data visualization engineer, Data Analyst, BI Expert
Build production-ready AI applications with Machine Learning
- 13
- Followers
Build production-ready AI applications with Machine Learning
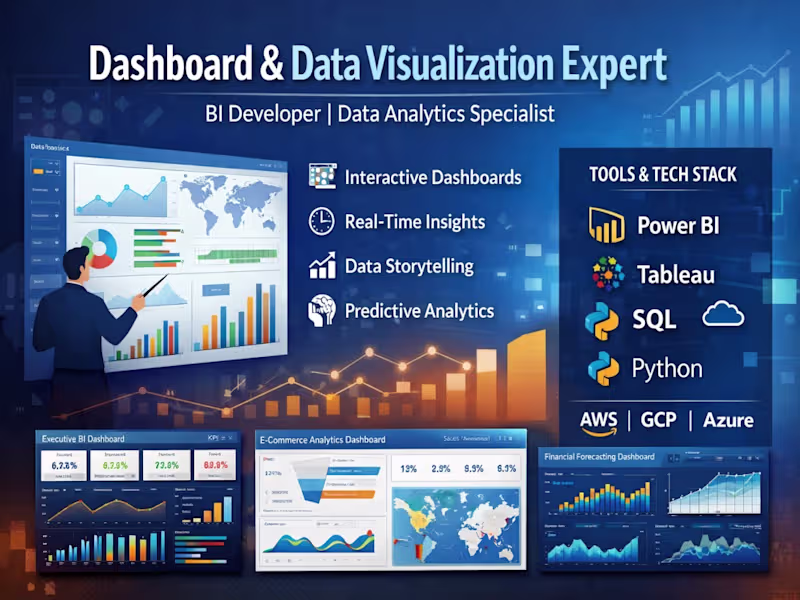
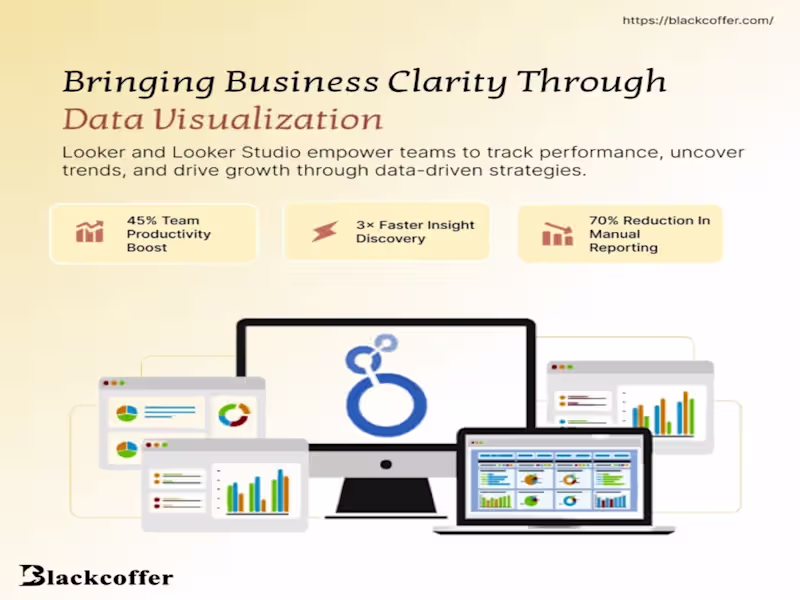

Transforming data into insights that drive growth with AI
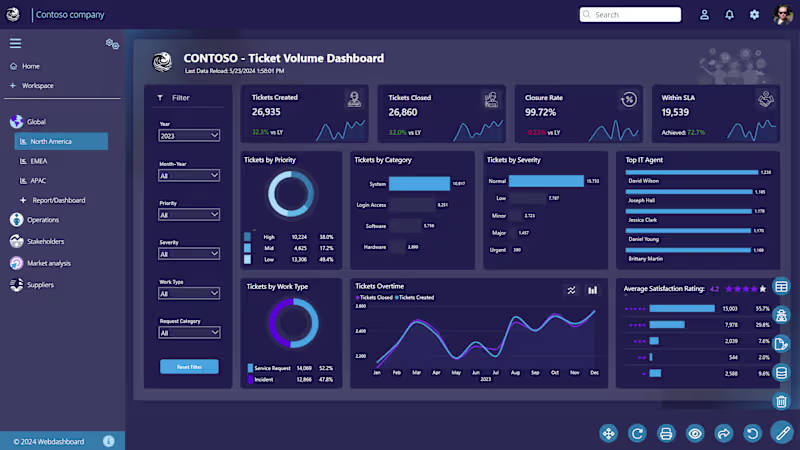
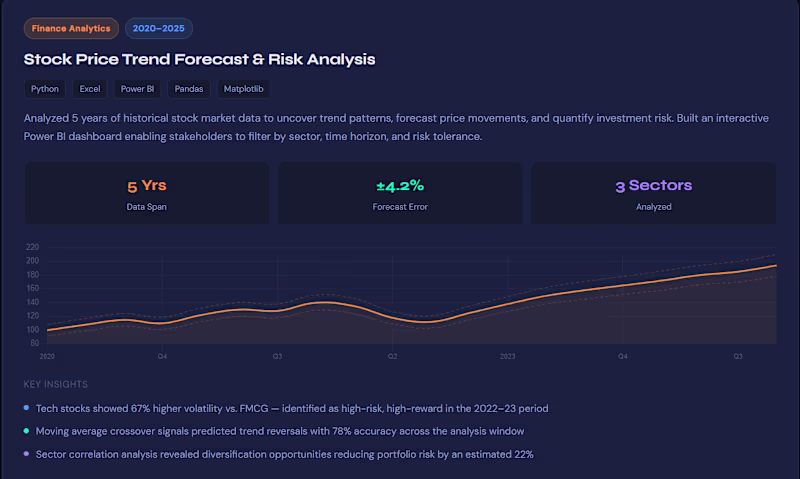
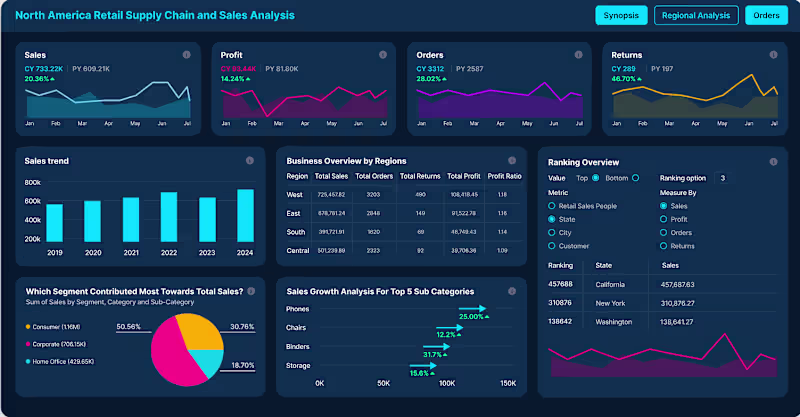
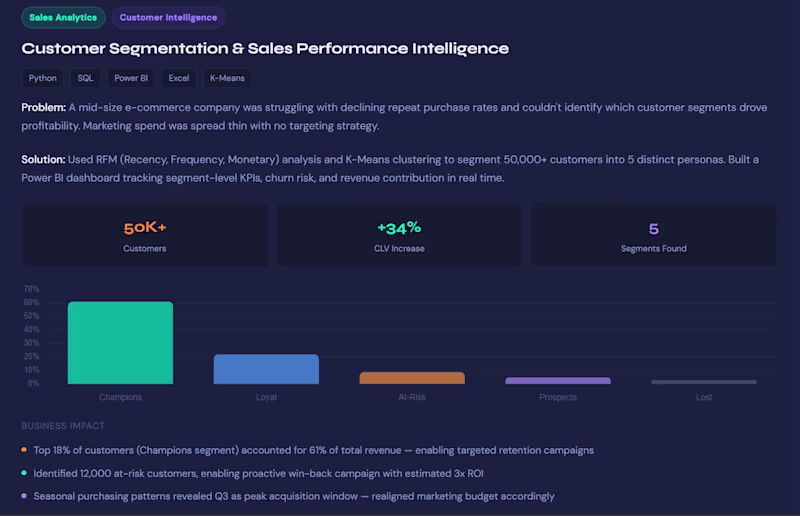
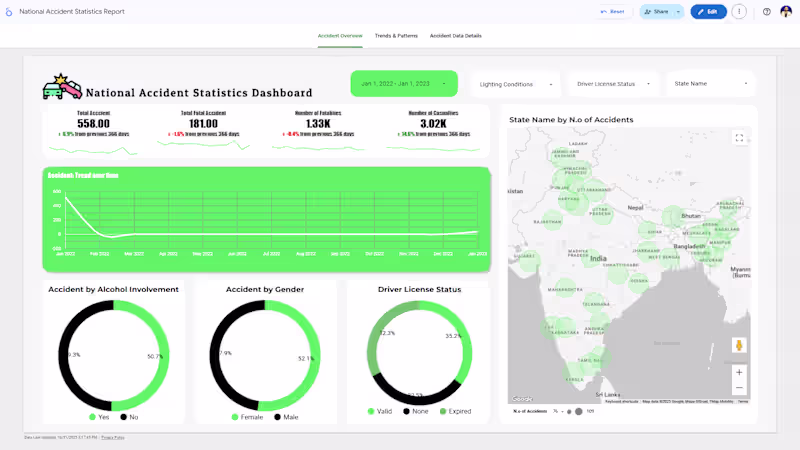
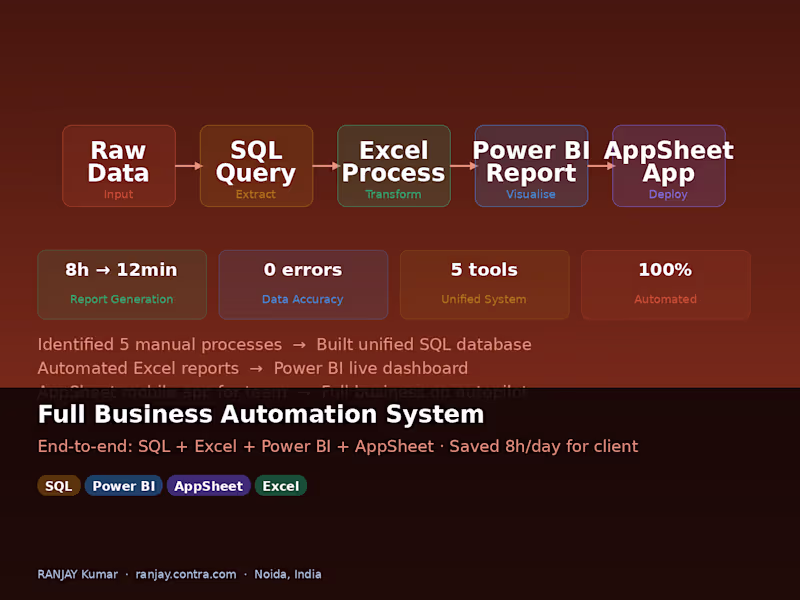
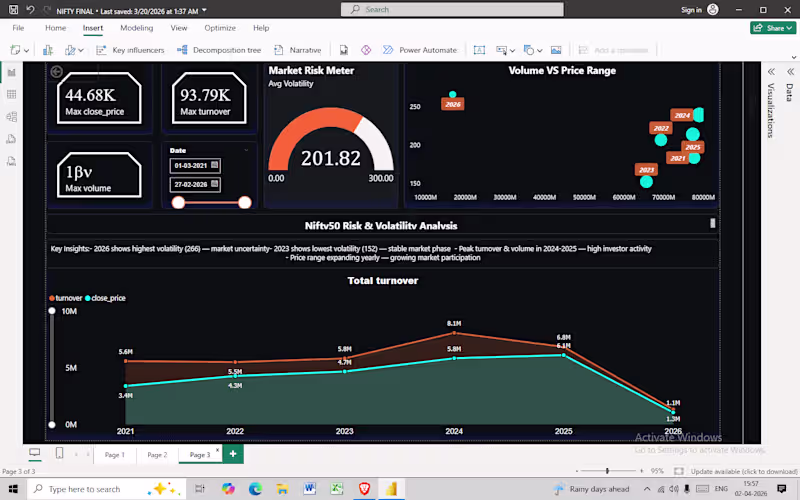
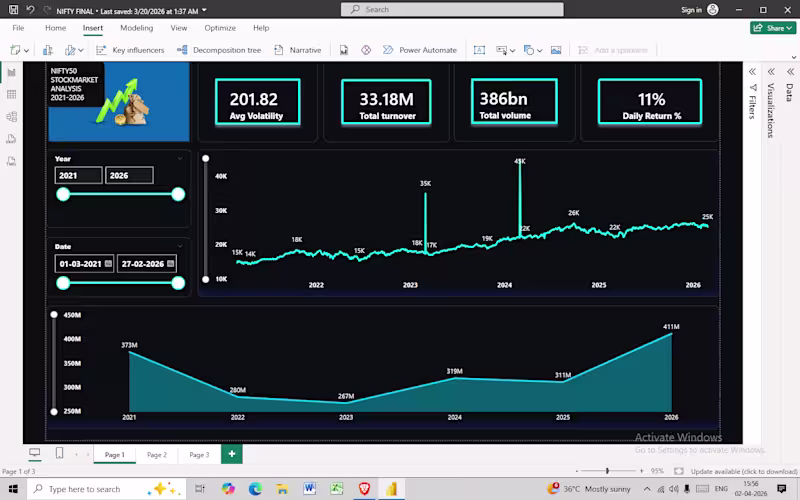
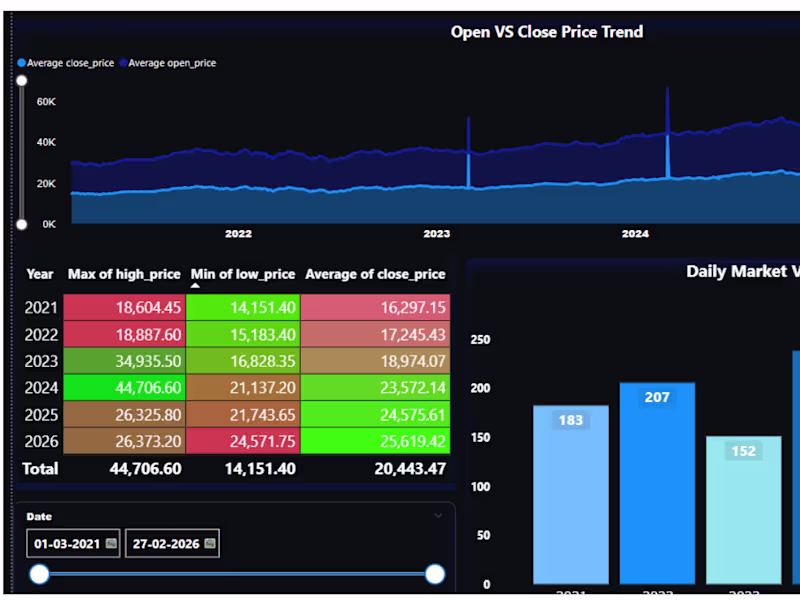
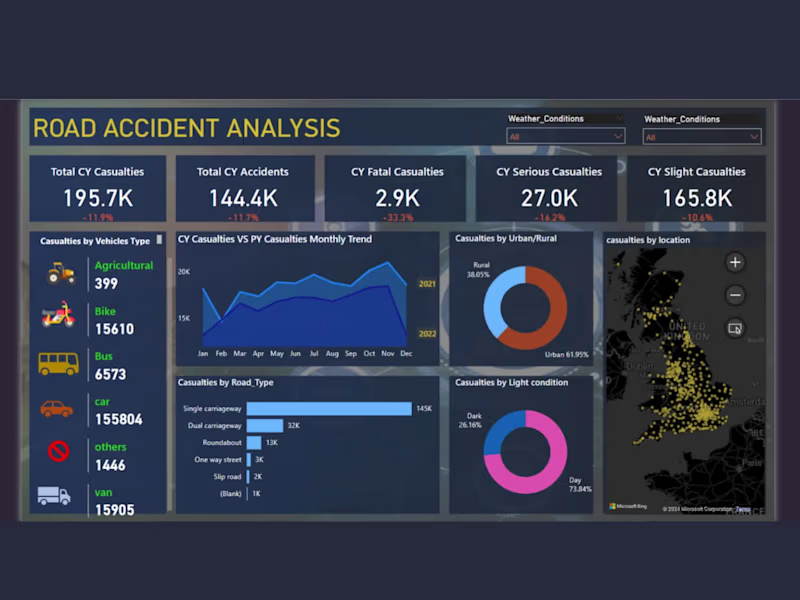
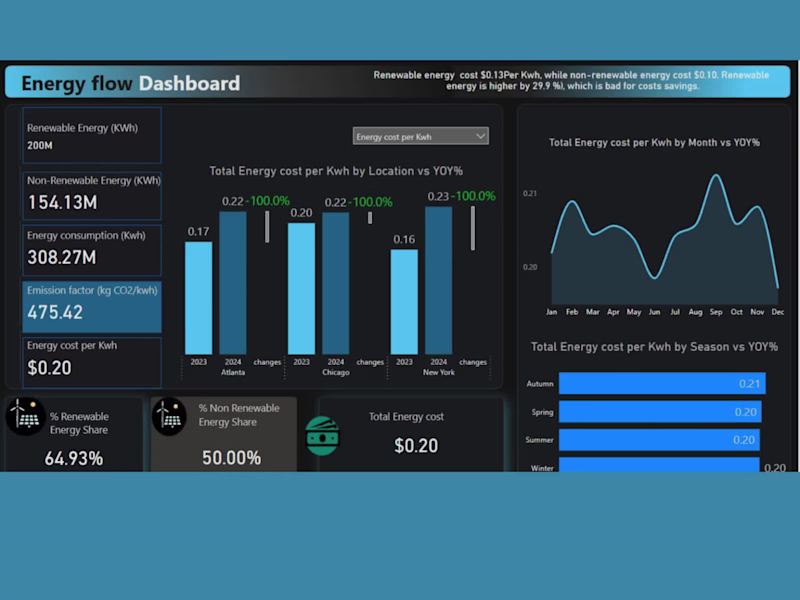
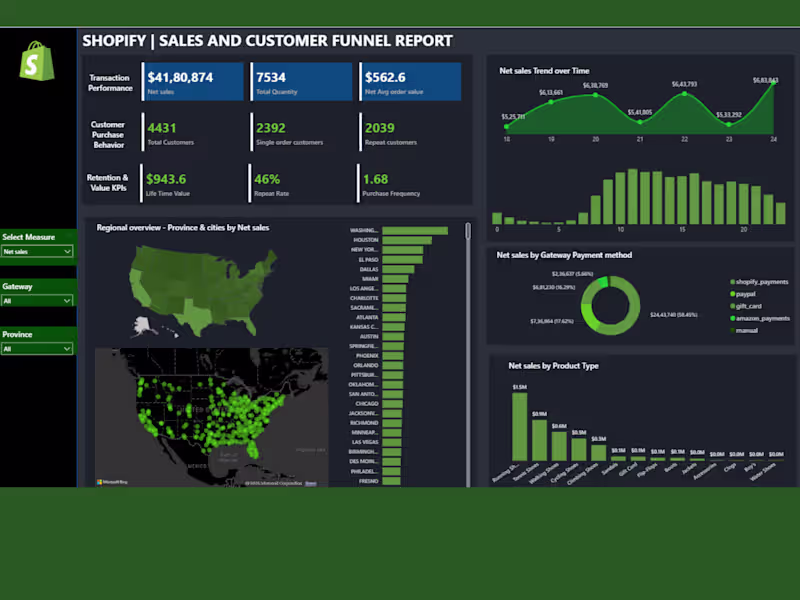
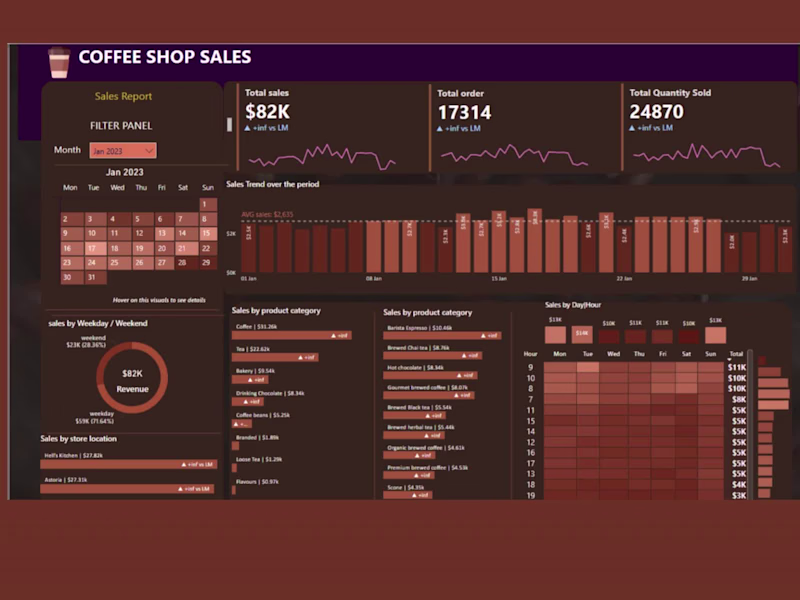
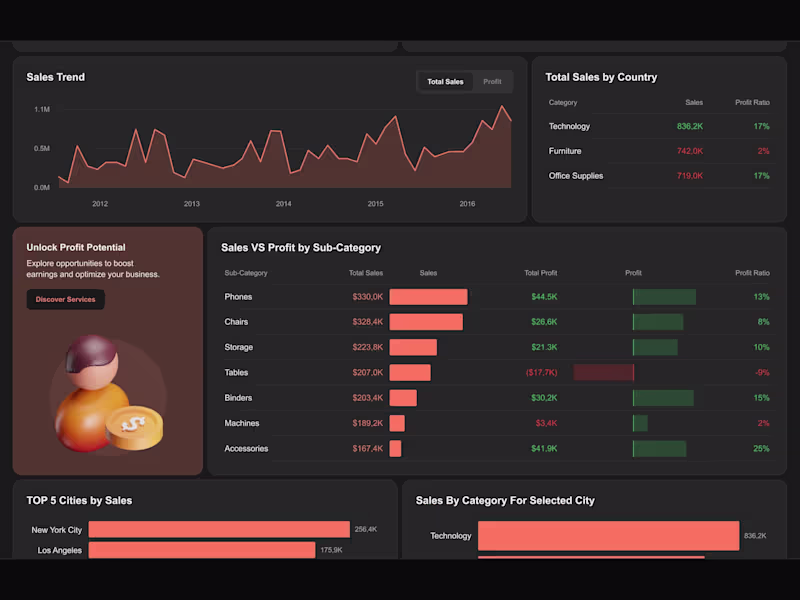
Data Insights & Dashboards Curated for Success
Data Insights & Dashboards Curated for Success


View more →
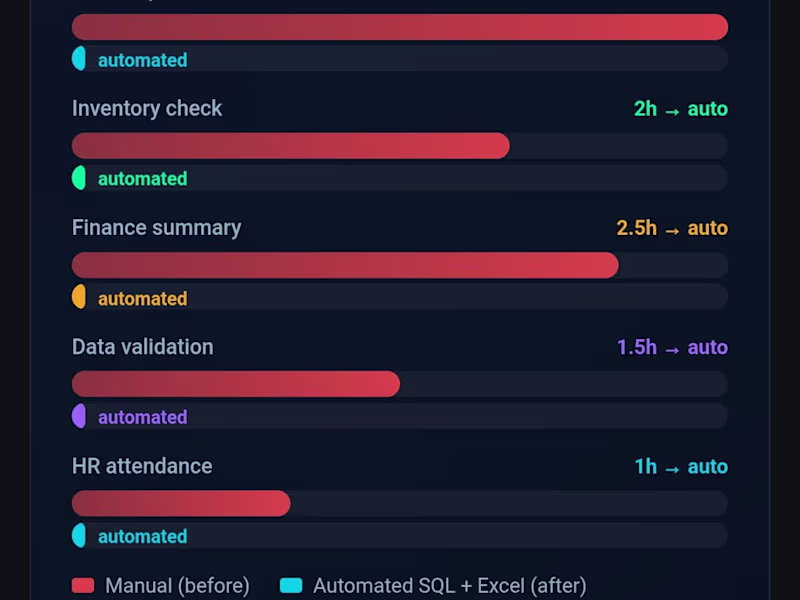
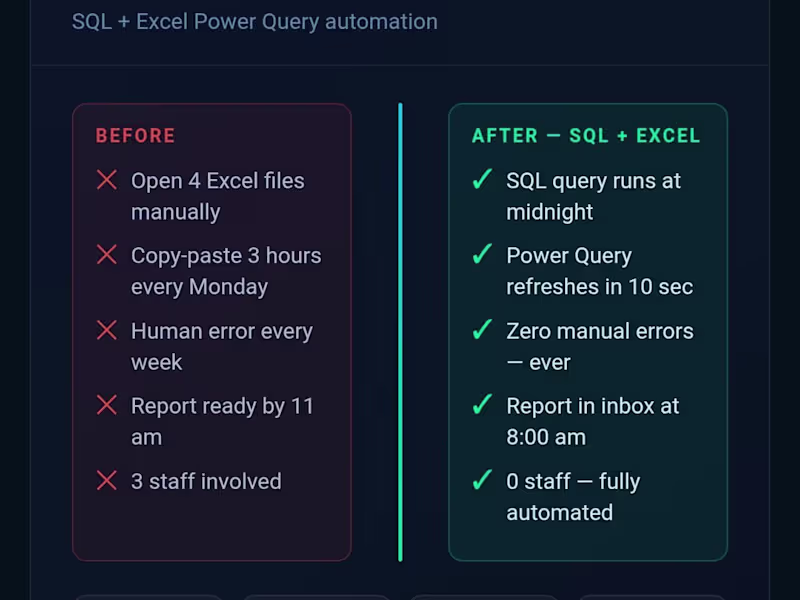
I automate processes and build dashboards that save time
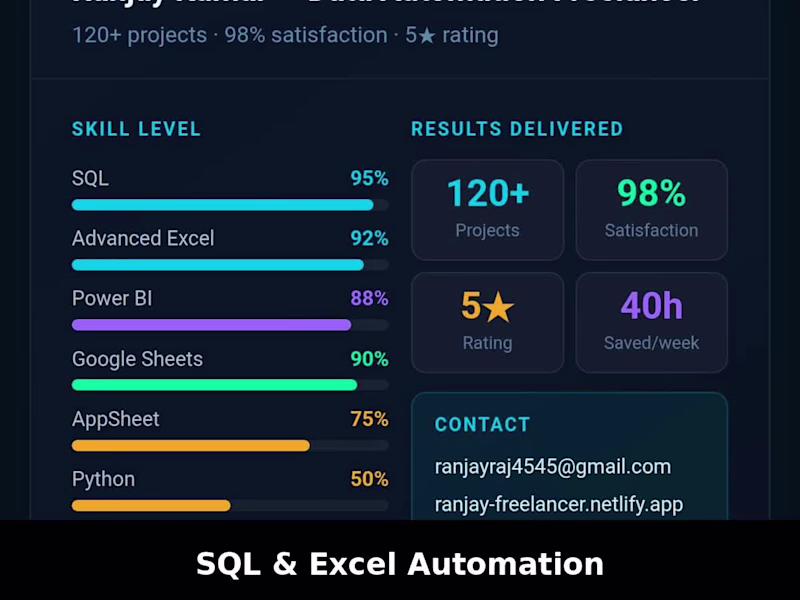
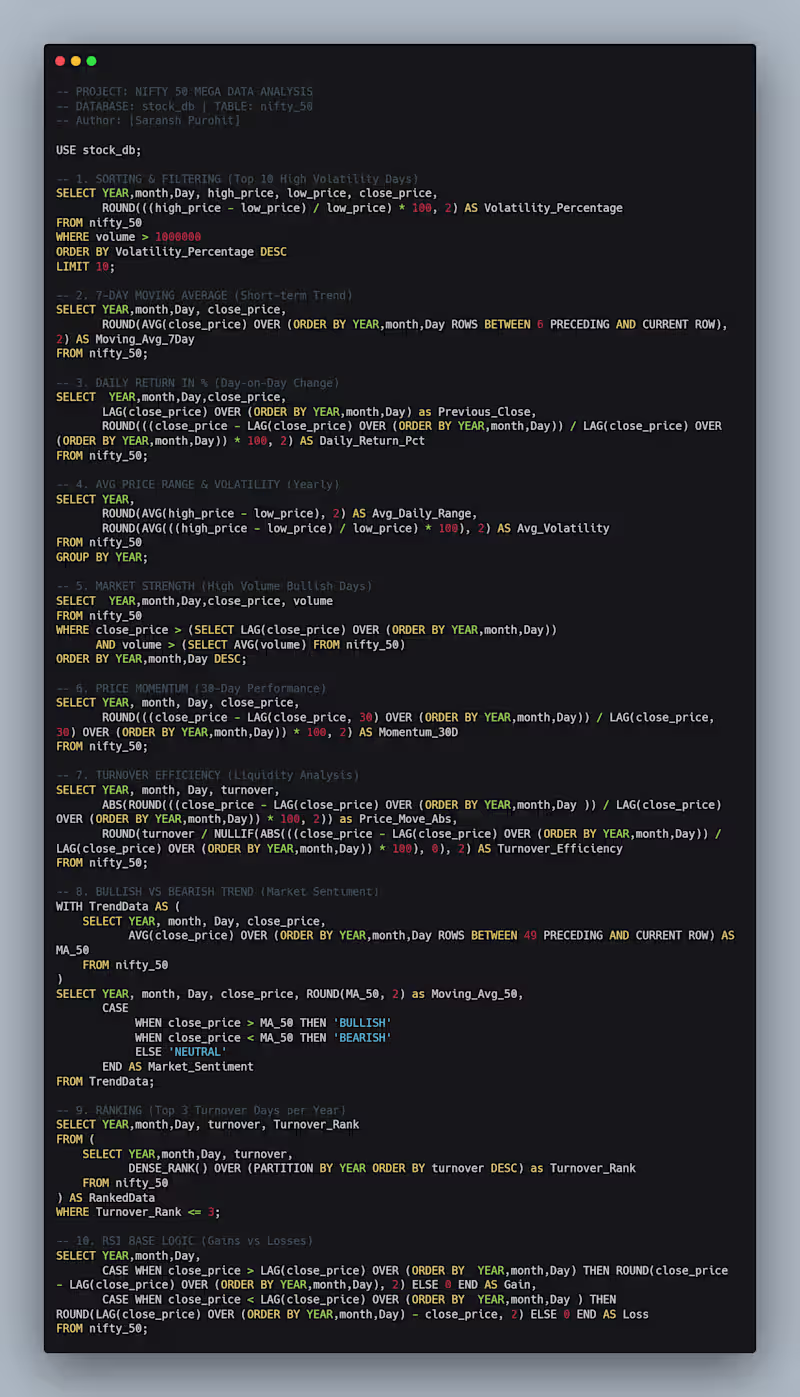
Data Analyst | SQL & Power BI Specialist
Business Intelligence Specialist | Power BI & Excel Expert
Business Intelligence Specialist | Power BI & Excel Expert
Chartered Accountant | IFRS, US GAAP | Data Analyst 📊
Chartered Accountant | IFRS, US GAAP | Data Analyst 📊


View more →