

content design & creative direction for modern brands
- $10k+
- Earned
- 12x
- Hired
- 5.0
- Rating
- 103
- Followers
content design & creative direction for modern brands



Premium Brand Designer for B2B SaaS Brands.
- $1k+
- Earned
- 1x
- Hired
- 5.0
- Rating
- 12
- Followers
Premium Brand Designer for B2B SaaS Brands.


Growth Hacker | Full-Stack Marketer | Creative Specialist
- 2x
- Hired
- 4.8
- Rating
- 8
- Followers
Growth Hacker | Full-Stack Marketer | Creative Specialist


Brand Designer | Product Photographer


Stand out with bold brand design!


Multidisciplinary UX/UI & Brand Designer
Multidisciplinary UX/UI & Brand Designer


Graphic Designer_Visual Artist_Painter_Illustrator_Editor
New to Contra
Graphic Designer_Visual Artist_Painter_Illustrator_Editor
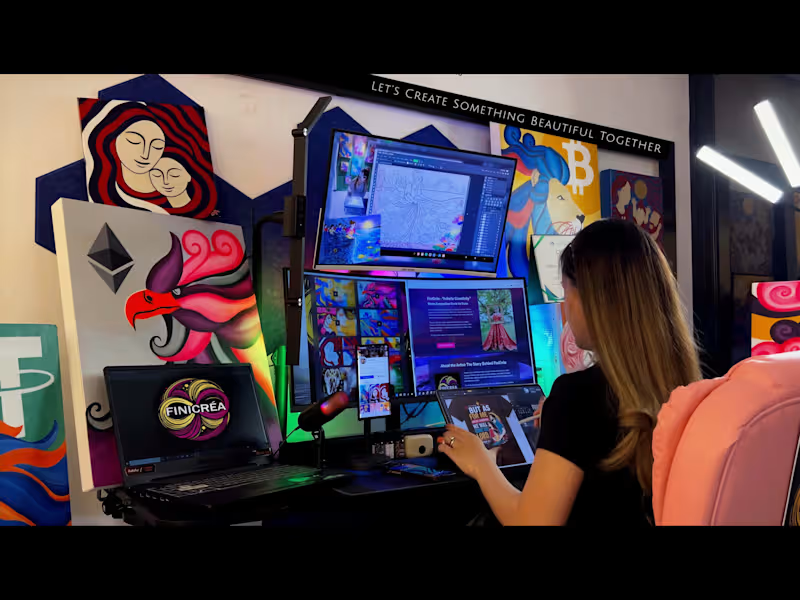
This project showcases my creative process as a multidisciplinary visual artist, combining traditional acrylic painting with digital illustration and graphic design. The video highlights my workspace, workflow, and the tools I use to transform ideas into meaningful visual experiences.
My expertise includes concept development, digital illustration, branding, and original artwork. Whether creating custom illustrations, visual identities, or fine art, I focus on delivering designs that are both visually compelling and purpose-driven.
This portfolio reflects my commitment to creativity, craftsmanship, and attention to detail in every project.
3
484
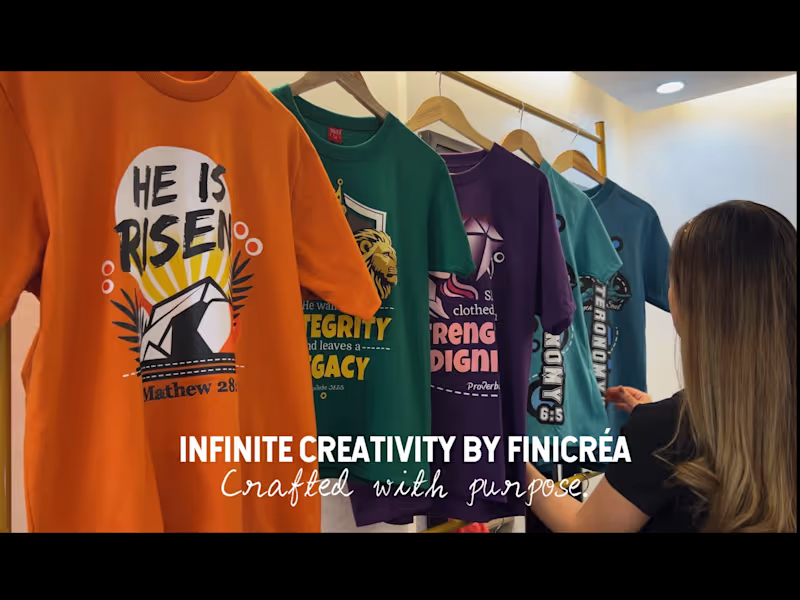
I don’t just design graphics, I build products from concept to creation. Every T-shirt represents hours of designing, production, quality control, and careful packaging. My passion is creating artwork that inspires while delivering professional-quality merchandise. Every piece is crafted with purpose.
Strengths of this video:
✅Original digital design process
✅Professional T-shirt mockups
✅DTF printing workflow
✅Heat pressing and production
✅Quality inspection
✅Careful packaging
✅Finished products
✅Strong brand presentation
✅End-to-end creative workflow
✅Attention to detail and craftsmanship
✅Faith-inspired apparel design
✅Creative direction from concept to completion
1
297
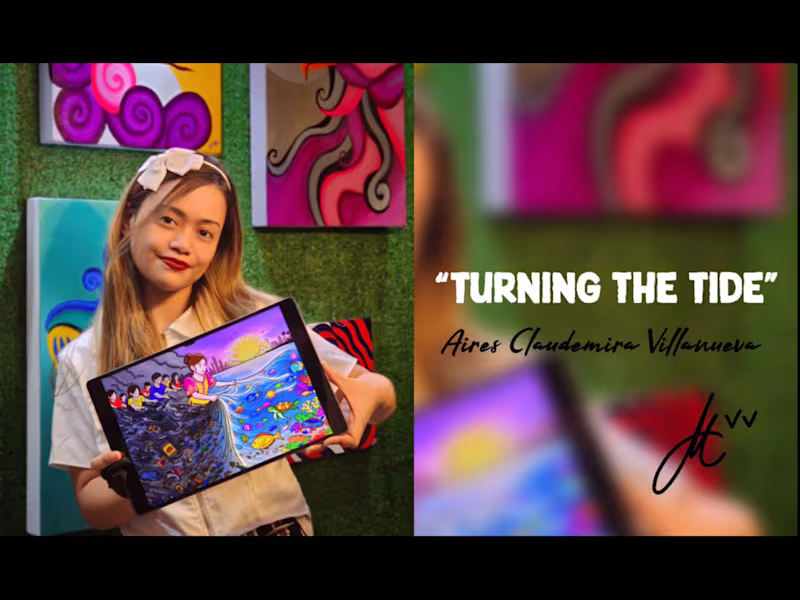
“Turning the Tide” is an original digital illustration created to raise awareness about marine conservation and the power of collective action. The artwork contrasts a polluted shoreline with a thriving underwater ecosystem, using visual storytelling to communicate hope, responsibility, and positive change.
From concept development to the final illustration, I managed every stage of the creative process, including research, composition, storytelling, color design, and digital painting. My focus was to create a compelling visual narrative that not only captures attention but also communicates a meaningful message.
This project was selected for exhibition in a regional digital art illustration competition, allowing the artwork to reach a wider audience and spark conversations about environmental responsibility.
This piece reflects my passion for creating illustrations that blend creativity, purposeful storytelling, and thoughtful design to leave a lasting impression.
My Role:
✅Concept Development
✅Digital Illustration
✅Visual Storytelling
✅Composition & Layout
✅Color Design
✅Creative Direction
1
356

“Majestic Aura” is an original acrylic painting that reflects my signature artistic style, characterized by expressive colors, flowing forms, and meaningful visual storytelling. Inspired by the quiet strength and grace found in Proverbs 31:25, this piece explores the beauty of confidence rooted in character rather than appearance.
From the initial concept to the final brushstroke, I carefully developed the composition, color harmony, and visual flow to create an artwork that is both emotionally engaging and visually distinctive. Every element was intentionally designed to evoke warmth, elegance, and a sense of timeless beauty.
This project demonstrates my ability to transform ideas into compelling works of art that connect with audiences, whether for personal collections, commissioned pieces, creative branding, or editorial projects.
My Role:
✅Concept Development
✅Acrylic Painting
✅Composition & Visual Storytelling
✅Color Theory & Harmony
✅Creative Direction
1
353

SAP MM/WM & Power BI Specialist | Inventory & Supply Chain
New to Contra
SAP MM/WM & Power BI Specialist | Inventory & Supply Chain
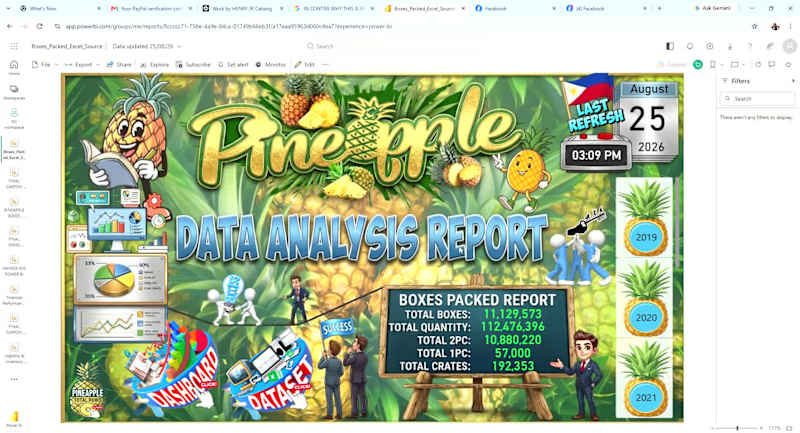
An interactive Power BI dashboard designed to monitor pineapple production and packing performance from 2019 to the present year.
The dashboard provides graphical insights into:
Total Pineapple Boxes Packed – overall production/packing volume
Daily, Weekly, Monthly, and Yearly KPIs – performance monitoring across different time periods
Packing Trends – identifies production trends and changes over time
Brand Distribution – boxes packed by brand
Tag Distribution – analysis of packing tags
Variant Distribution – comparison of different pineapple variants
Pack Size Distribution – analysis of boxes packed by pack size
Time-Based Analysis – allows users to drill into daily, weekly, monthly, and yearly performance
The dashboard helps management quickly understand packing volume, production trends, and product mix, while identifying changes in brand, tag, variant, and pack-size distribution.
Key value:
Production data → KPI analysis → Trend analysis → Product mix → Graphical insights → Better operational decisions
0
81
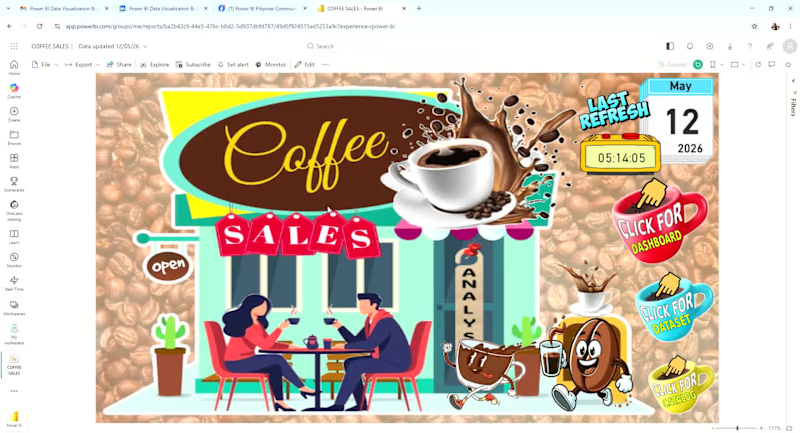
An interactive Power BI dashboard designed to provide clear graphical insights into coffee sales performance and customer purchasing patterns.
The dashboard analyzes:
Total Sales – overall coffee sales performance
Total Cups Sold – total number of cups sold
Monthly Sales KPI – tracks sales performance by month
Sales by Month – identifies monthly sales trends
Sales by Time of Day – compares morning, afternoon, and evening/night sales
Sales by Product – identifies which coffee products generate the highest sales
Product Performance by Time of Day – shows which coffee products perform best during morning, afternoon, or night
The interactive visuals make it easy to identify top-selling coffee products, peak sales periods, and monthly performance trends, helping management understand customer purchasing behavior and make better sales decisions.
Key value:
Sales data → KPI analysis → Interactive visualization → Customer insights → Better sales decisions
0
90
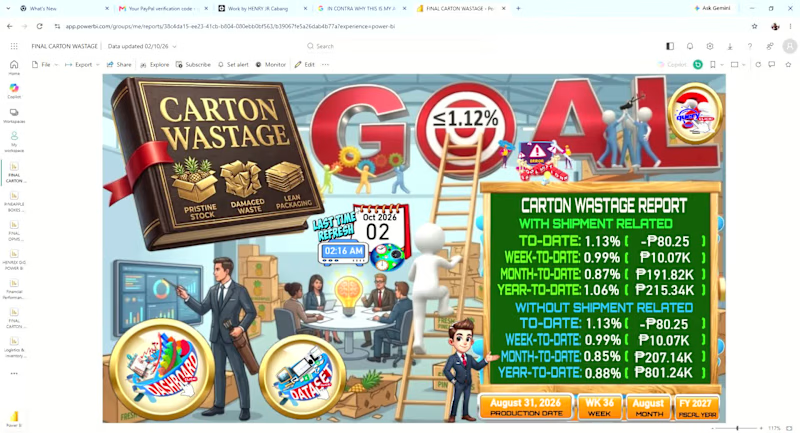
An interactive Power BI dashboard designed to monitor and analyze carton wastage and its cost impact against the Annual Operating Plan (AOP).
The dashboard provides daily, weekly, monthly, and yearly analysis of:
Carton wastage and quantity trends
Wastage cost impact vs. AOP
Causes of damage and their contribution to total wastage
Team performance, including the team with the highest damage
Daily, weekly, monthly, and yearly trends
Interactive buttons for easy navigation between different time periods
Power BI Q&A page for users to ask questions and explore the data interactively
The dashboard transforms raw operational data into clear graphical insights, helping management identify major wastage drivers, monitor trends, compare actual performance against AOP, and determine areas that require corrective action.
Key value:
From wastage data → KPI analysis → graphical visualization → business insights → actionable decisions.
0
88
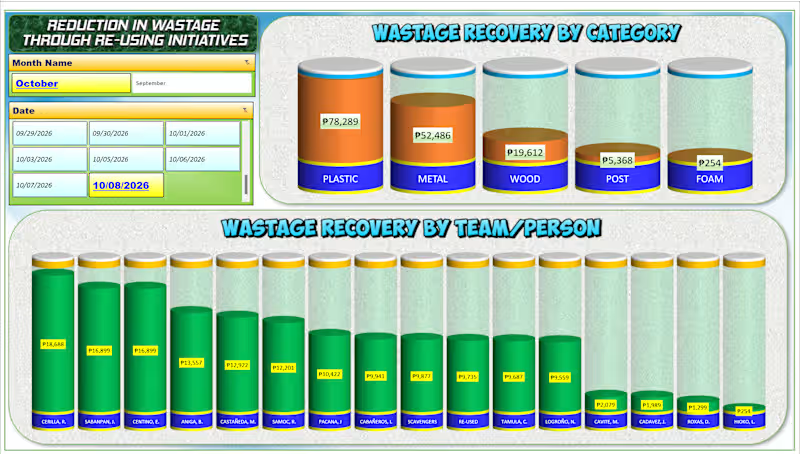
📊 Turning Data into Insights with Excel! 📊
I recently built this dynamic "Wastage Recovery Tracker" dashboard to help teams easily monitor costs, analyze categories, and track performance in real-time.
Good data analysis isn't just about the numbers—it's about making them clear, actionable, and visually engaging.
📩 Need a custom dashboard or data analysis design like this for your business? PM me directly, and let’s discuss how we can bring your data to life!
#DataAnalysis (https://www.linkedin.com/search/results/all/?keywords=%23dataanalysis&origin=HASH_TAG_FROM_FEED) #ExcelDashboard (https://www.linkedin.com/search/results/all/?keywords=%23exceldashboard&origin=HASH_TAG_FROM_FEED) #DataVisualization (https://www.linkedin.com/search/results/all/?keywords=%23datavisualization&origin=HASH_TAG_FROM_FEED) #ExcelTips (https://www.linkedin.com/search/results/all/?keywords=%23exceltips&origin=HASH_TAG_FROM_FEED) #BusinessIntelligence (https://www.linkedin.com/search/results/all/?keywords=%23businessintelligence&origin=HASH_TAG_FROM_FEED) #FreelanceDataAnalyst (https://www.linkedin.com/search/results/all/?keywords=%23freelancedataanalyst&origin=HASH_TAG_FROM_FEED)
0
75