Custom Software, AI & SaaS Built for Business
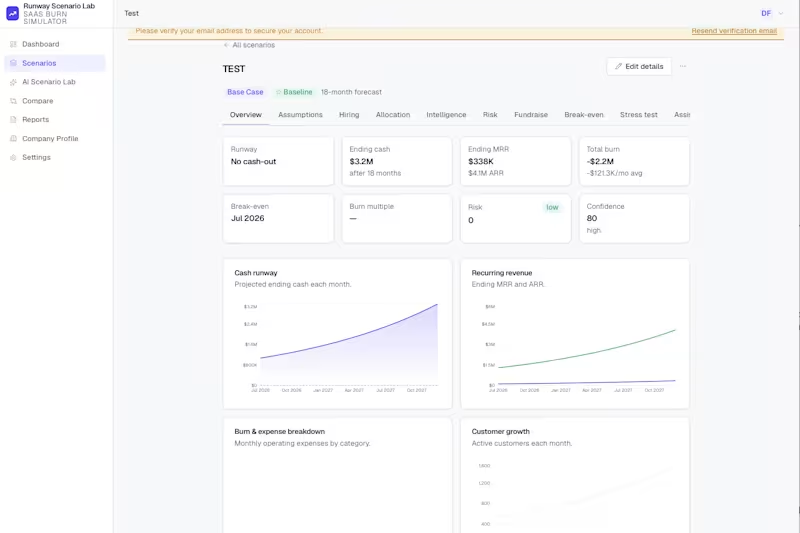
Users enter a SaaS financial baseline (cash, MRR/ARR, margin, expenses, churn, headcount) and generate baseline and custom scenarios across 12-36 month forecasts. A centralized engine computes monthly cash, MRR/ARR, burn, runway, CAC payback, LTV:CAC, burn multiple, and break-even for each scenario, with deterministic risk and confidence scores. Users adjust assumptions and hiring plans with live recalculation, compare 2-4 scenarios, run a fundraise-timing predictor, a break-even path finder, and stress-test mode, then generate editable board reports exportable to PDF or share links. An AI decision assistant explains scenarios using only calculated outputs.
0
58
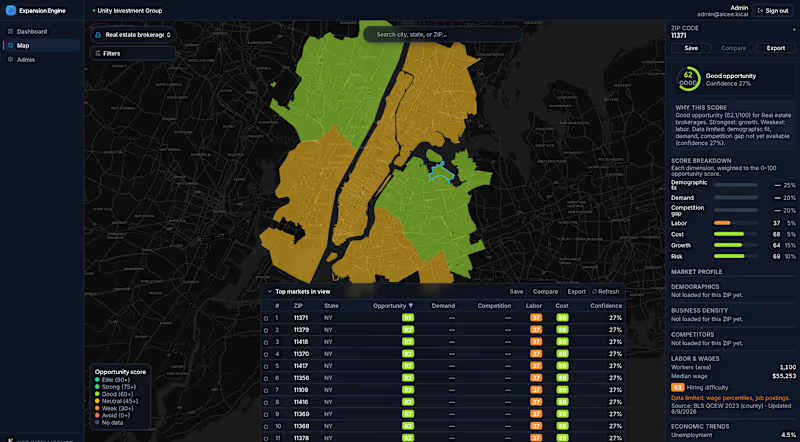
The platform turns fragmented location data into one industry-specific opportunity score per ZIP code. A user selects an industry, searches a region or scans nationwide, and sees color-coded ZIP opportunity zones on a map. Clicking a ZIP opens a breakdown across demographic fit, demand, competition gap, labor availability, cost, growth, and risk, each weighted per industry, plus an AI explanation grounded in the stored inputs. Users can filter, rank, save, compare markets, and export reports. Scores carry confidence levels so missing data lowers confidence instead of fabricating precision.
1
115
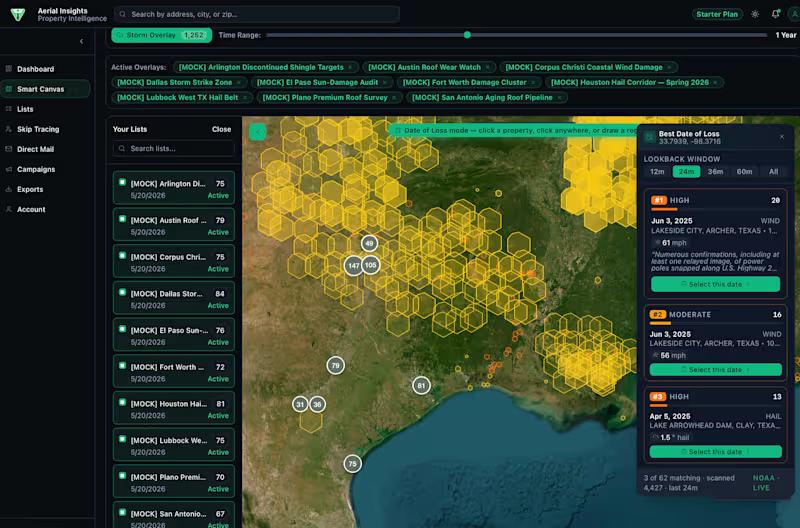
A lead-generation platform for exterior contractors. Draw an area on the map and it pulls street-view imagery, runs computer-vision detection to identify each property’s roof and exterior materials, and scores every roof against the hail and wind history that has already exceeded what those materials can take. The result is a ranked, filterable lead list that flows straight into skip tracing and direct-mail outreach — the same imagery serving field crews, office estimators, and marketing.
1
203
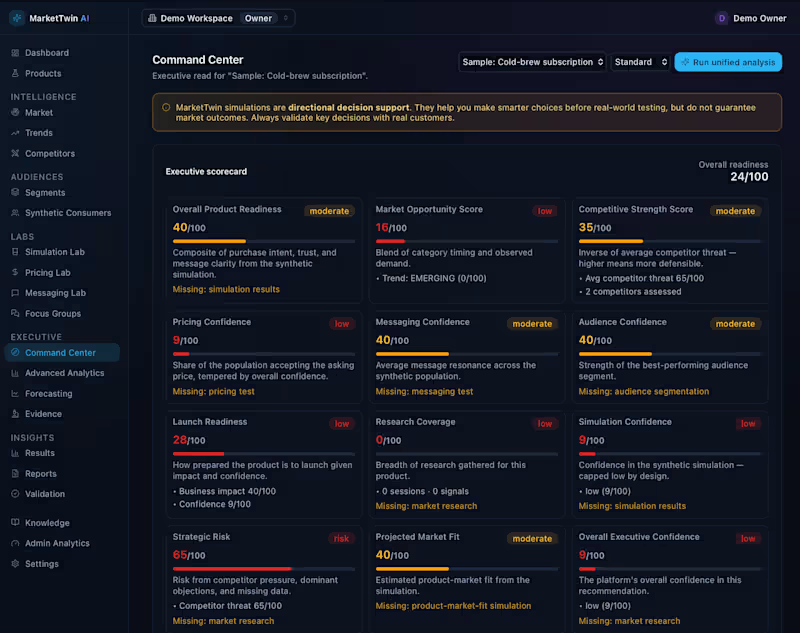
MarketTwin AI lets teams test a product idea, pricing, brand name, ad hook, landing-page copy, audience, or launch strategy inside an AI-generated market. It combines a market-intelligence layer (trend, competitor, review, and ad signals plus demographic and economic context) with audience segments and synthetic consumer personas, then runs agent-based simulations that produce purchase intent, objections, trust, price-fit, and market-readiness scores. Pricing and messaging labs, scenario comparison, confidence and assumptions tracking, and a calibration engine that compares simulations to real launch results round it out. Results feed a launch-strategy generator and exportable reports. The platform is explicit that results are directional decision support, not guaranteed predictions.
2
230

AI Interface designer and developer.

For this project, I had the chance to design a VR training system for soldiers, simulating real-world mission scenarios. My focus was on creating an interactive, efficient, and accessible experience, ensuring both learning effectiveness and user engagement.
Each screen was crafted to deliver essential information clearly and intuitively - from risk zone symbols to interactive mission progress charts. The integration of real-time feedback empowers soldiers to make swift tactical adjustments, ensuring quick decision-making during training.
This project blends cutting-edge VR technology with human-centered design, allowing soldiers to interact confidently with the system while preparing for any situation, all without the risks of traditional field training.
1
3
237

As a designer, I focused on crafting an experience that brings clarity to complexity. This project embodies the future of intelligent stadium management and sets a new standard in how we interact with data at scale.
This bird’s-eye view gives an effortless preview of how data flows across the venue, highlighting availability, network performance, and traffic patterns, helping managers ensure smooth operations for thousands of spectators.
Through motion-driven design, complex data is turned into meaningful insights. Dynamic, color-coded charts and intuitive visuals reduce cognitive load, offering clear, actionable information, like network status, crowd accessibility, and engagement - at a glance.
The real power of this animation lies in its ability to provide contextual insights at scale, enabling proactive decision-making.
2
2
218
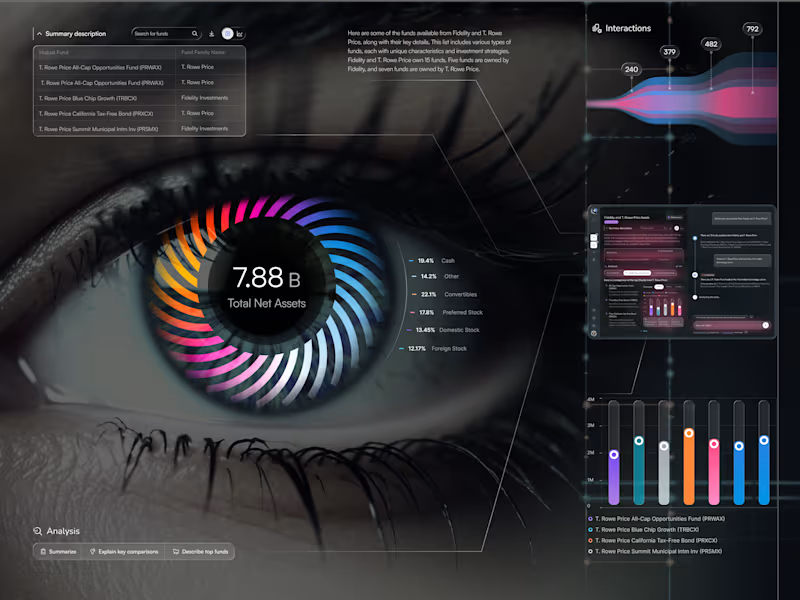
I’m excited to share EyeViz - a data-driven dashboard suite for exploring mutual funds through an artistic, human lens. ✨
👁️ Data You Can See (Eye Chart)
Meet the hero screen: a living iris where each colored blade maps an asset class, orbiting a bold KPI. It’s data-as-vision - instant clarity on allocation, balance, and momentum - with a slim Interactions stream and a built-in AI sidekick for quick explanations.
💡 Research Workspace
Search, compare, and understand — fast. Clean tables, smart chips, and a compact chart show stability, income focus, diversification, and risk side-by-side. The chat panel flags Unverified insights so trust stays front and center.
📱 Personal Workspace
Your everyday hub: activity tiles, pinned studies, and ongoing team chats - so you can jump back into work in seconds and keep insights reusable.
1
155
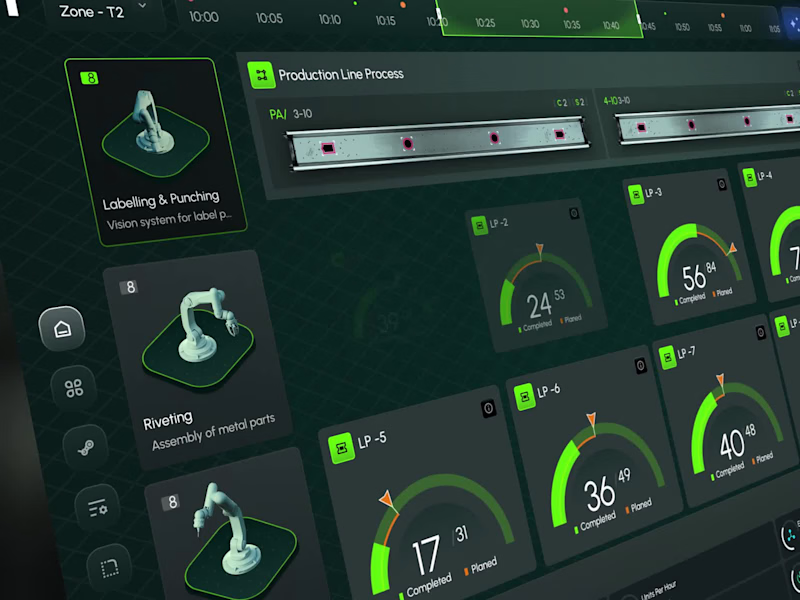
An animated interface designed to reflect the precision of industrial intelligence - a sleek, high-level dashboard built to orchestrate robotics, production analytics, and system-wide monitoring. From robot status indicators to real-time task flow and factory zone mapping, every visual layer is crafted for engineers who demand clarity at a glance and precision at scale.
Instant visibility across all production zones
Seamless integration of robotic systems
Performance insights delivered live
Designed for decisions - not just data
Welcome to the new standard in industrial UX: fast, focused, and fully connected.
22
375

Data analysis that wows through design
Data analysis that wows through design


View more →

Data Analyst | Clear Visuals, Clean Insights
Data Analyst | Clear Visuals, Clean Insights



View more →

Automating the boring stuff = better work/life balance.
- $5k+
- Earned
- 2x
- Hired
- 2
- Followers
Automating the boring stuff = better work/life balance.


View more →

Experienced Senior Global Data Scientist
Experienced Senior Global Data Scientist
View more →

Optimizing ops, boosting marketing impact, driving growth.
Optimizing ops, boosting marketing impact, driving growth.

View more →

Business Writing: Storytelling for Success