Data analysis that wows through design
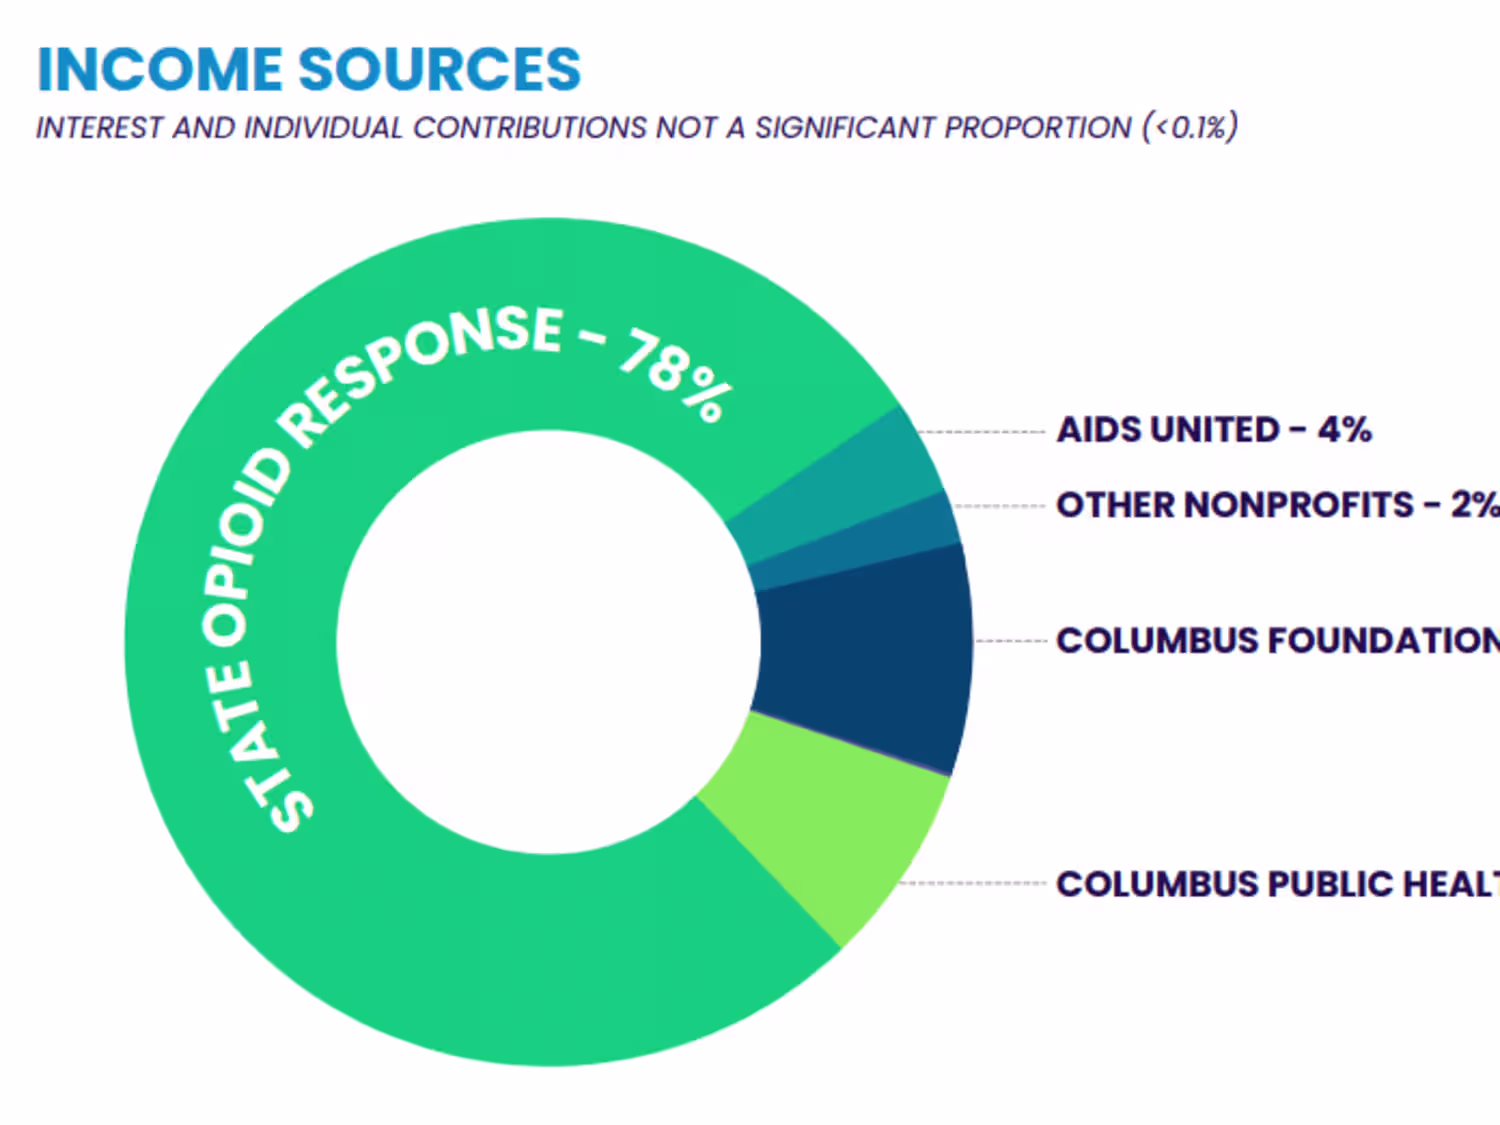
Annual Report for The SOAR Initiative

A data-driven annual report for an overdose prevention nonprofit. I analyzed all the data and designed compelling visualizations and page layouts. Check it out!

Data Visualizer
Graphic Designer
Data Analyst
Canva
Excel

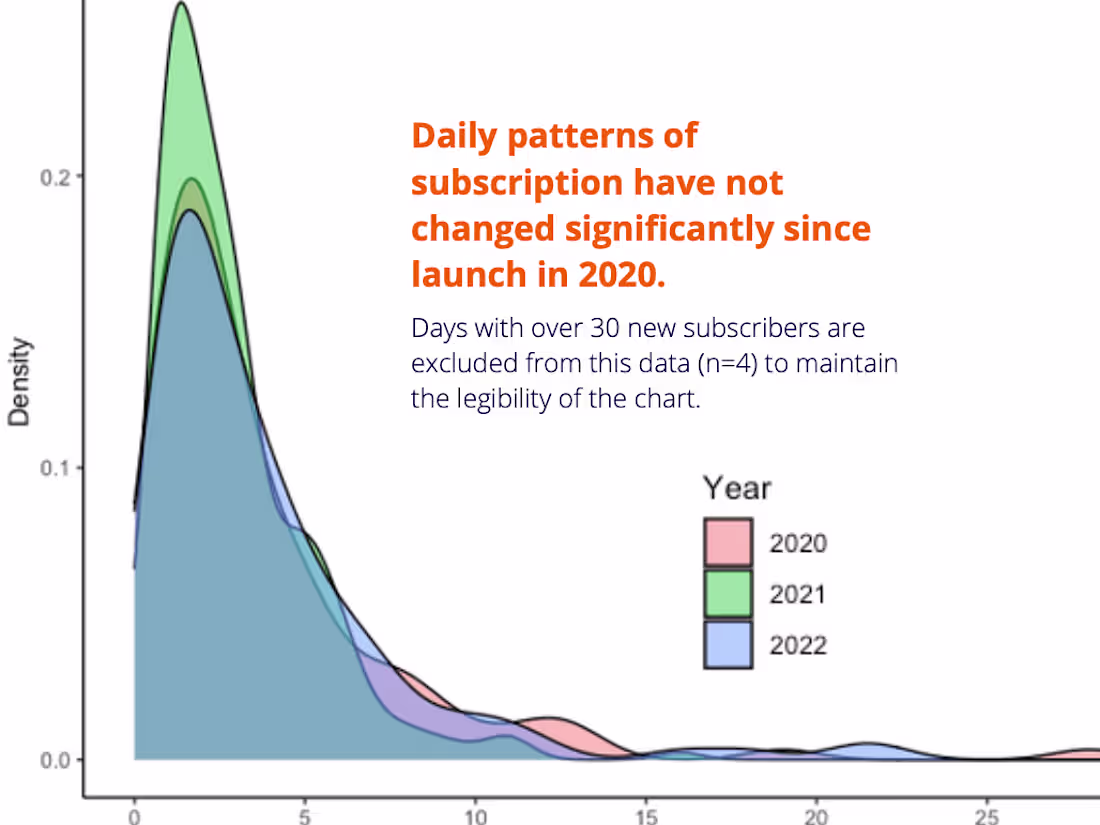
Email Subscriber Demographics Report

A science lab wanted to understand who was subscribed to their weekly email newsletter. Here are four different ways I helped them visualize their reach.

Data Visualizer
Graphic Designer
Data Analyst
Canva
Microsoft Excel
R

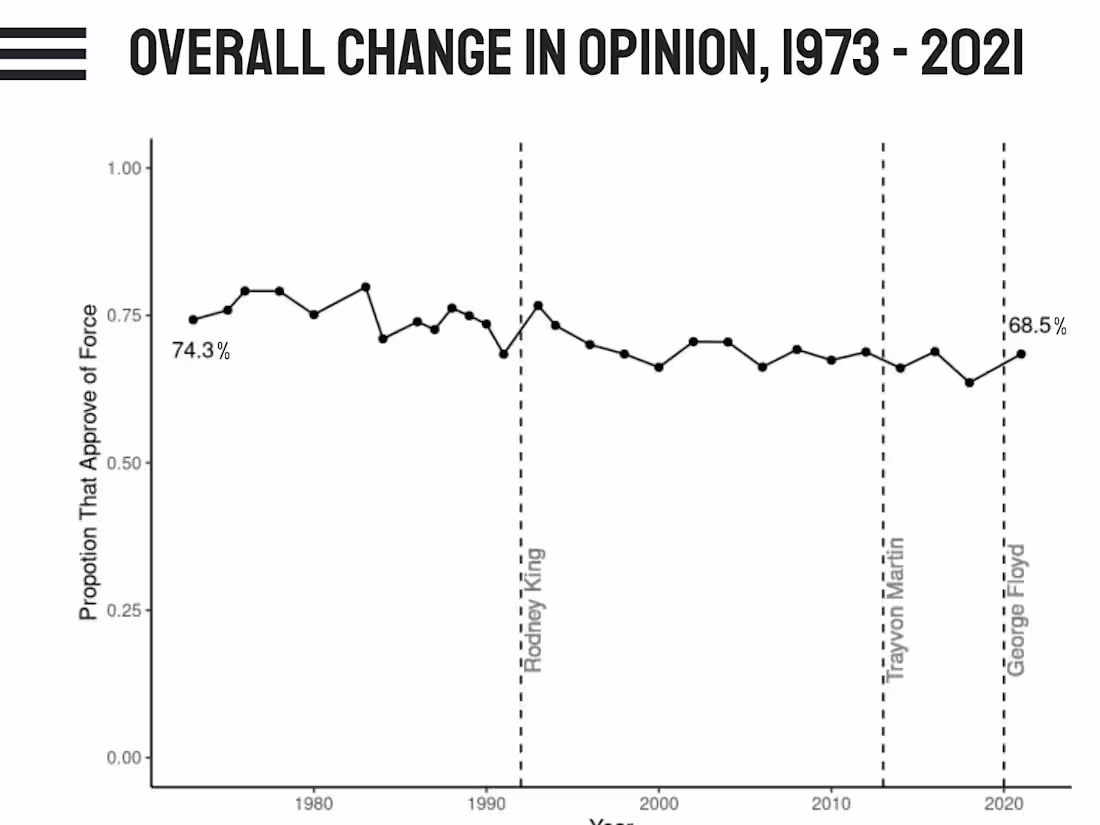
Public Opinion About Police in the US

How have Americans' attitudes about use of force by police officers changed over time? For my data visualization final class project, I found the answer.

Data Visualizer
Data Analyst
Researcher
Google Drive
Google Slides
R