Email Subscriber Demographics Report
Sydney Sauer
Project Overview
A research lab looking to expand the reach of their scientific discoveries had a wonderful weekly newsletter, but they had one problem—they had no idea who subscribed to it! My job was to create a report detailing subscriber demographics, helping them understand who they were missing and how they could target future campaigns to increase subscribership.
Since this is an internal report, I have redacted the agency's name and selected only a few screenshots to demonstrate the types of analysis I was able to conduct.
Highlights
Here are a few of the visualizations I created for the newsletter team. Their data was delivered to me as a raw CSV file exported from MailChimp, and I extracted every last bit of information to provide as much information as possible.
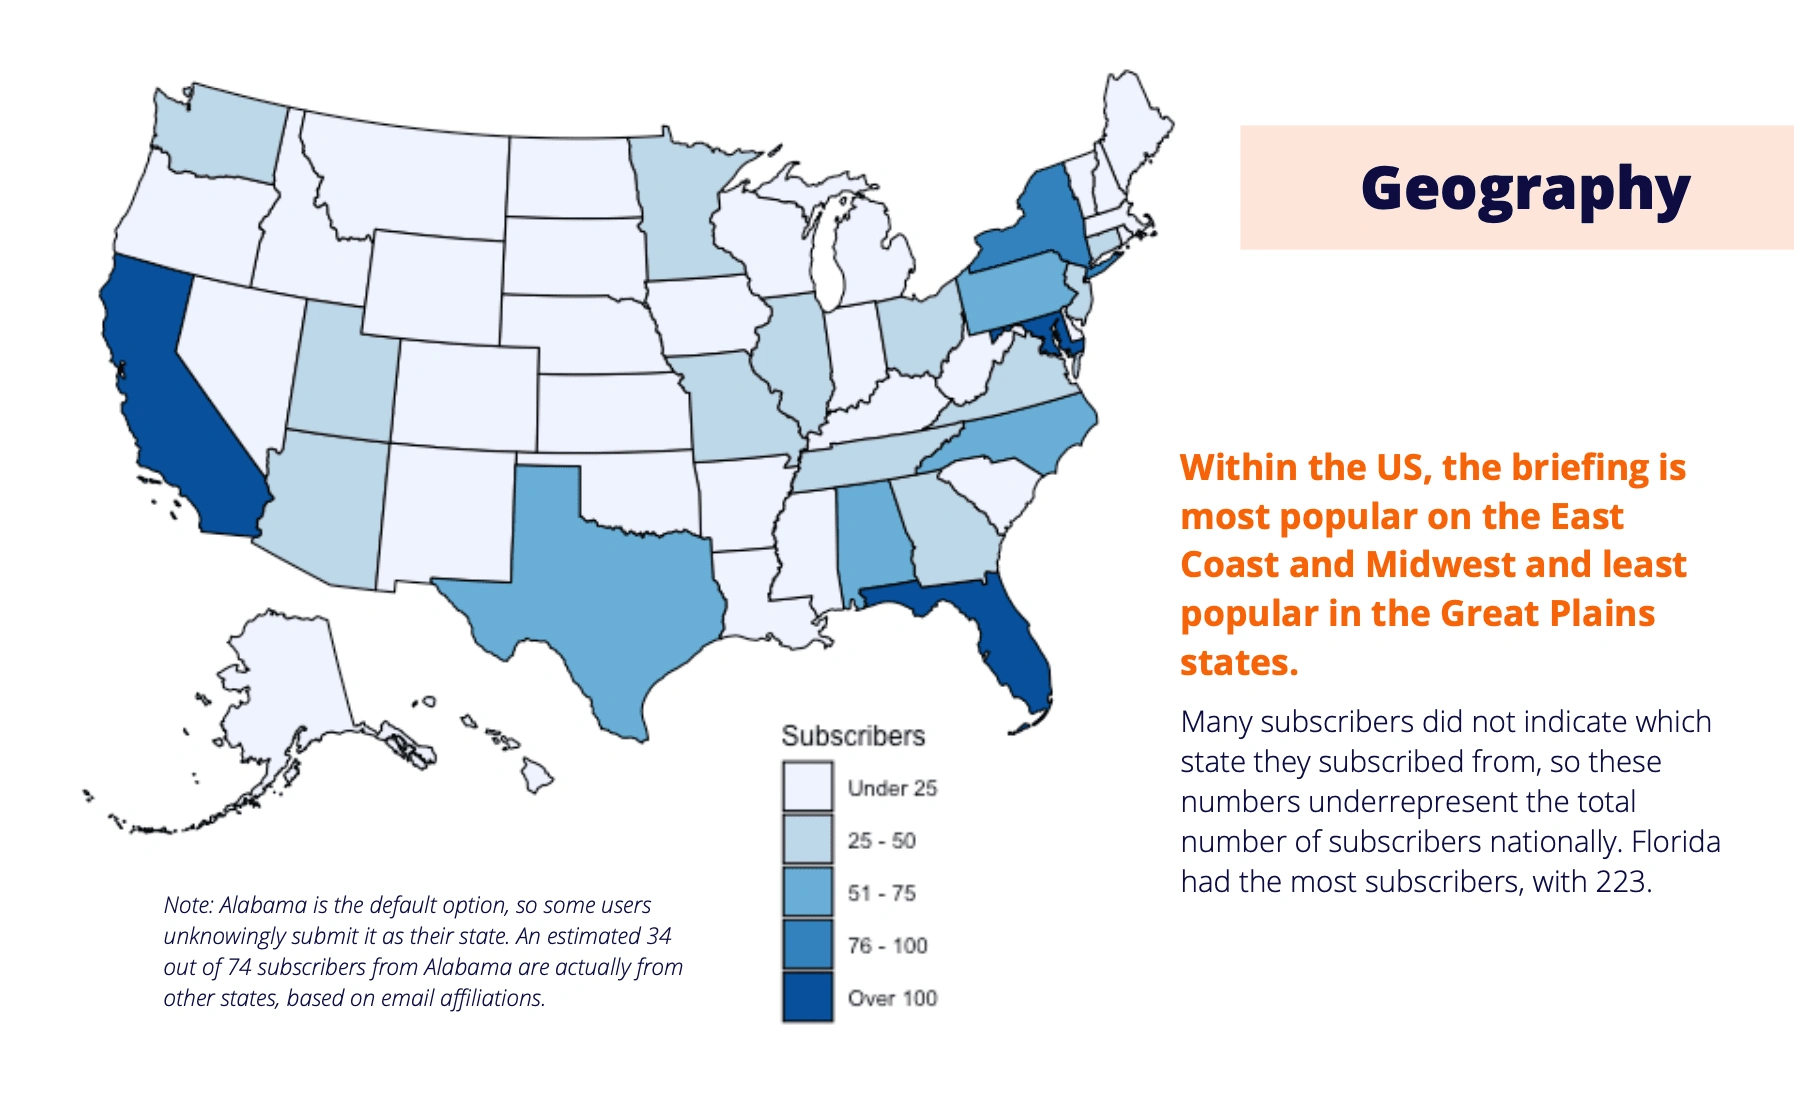
Geographic reach of the newsletter by state.
To simplify complex charts, I provide a description of the key takeaways and note any exceptions or data cleaning that may have impacted results:
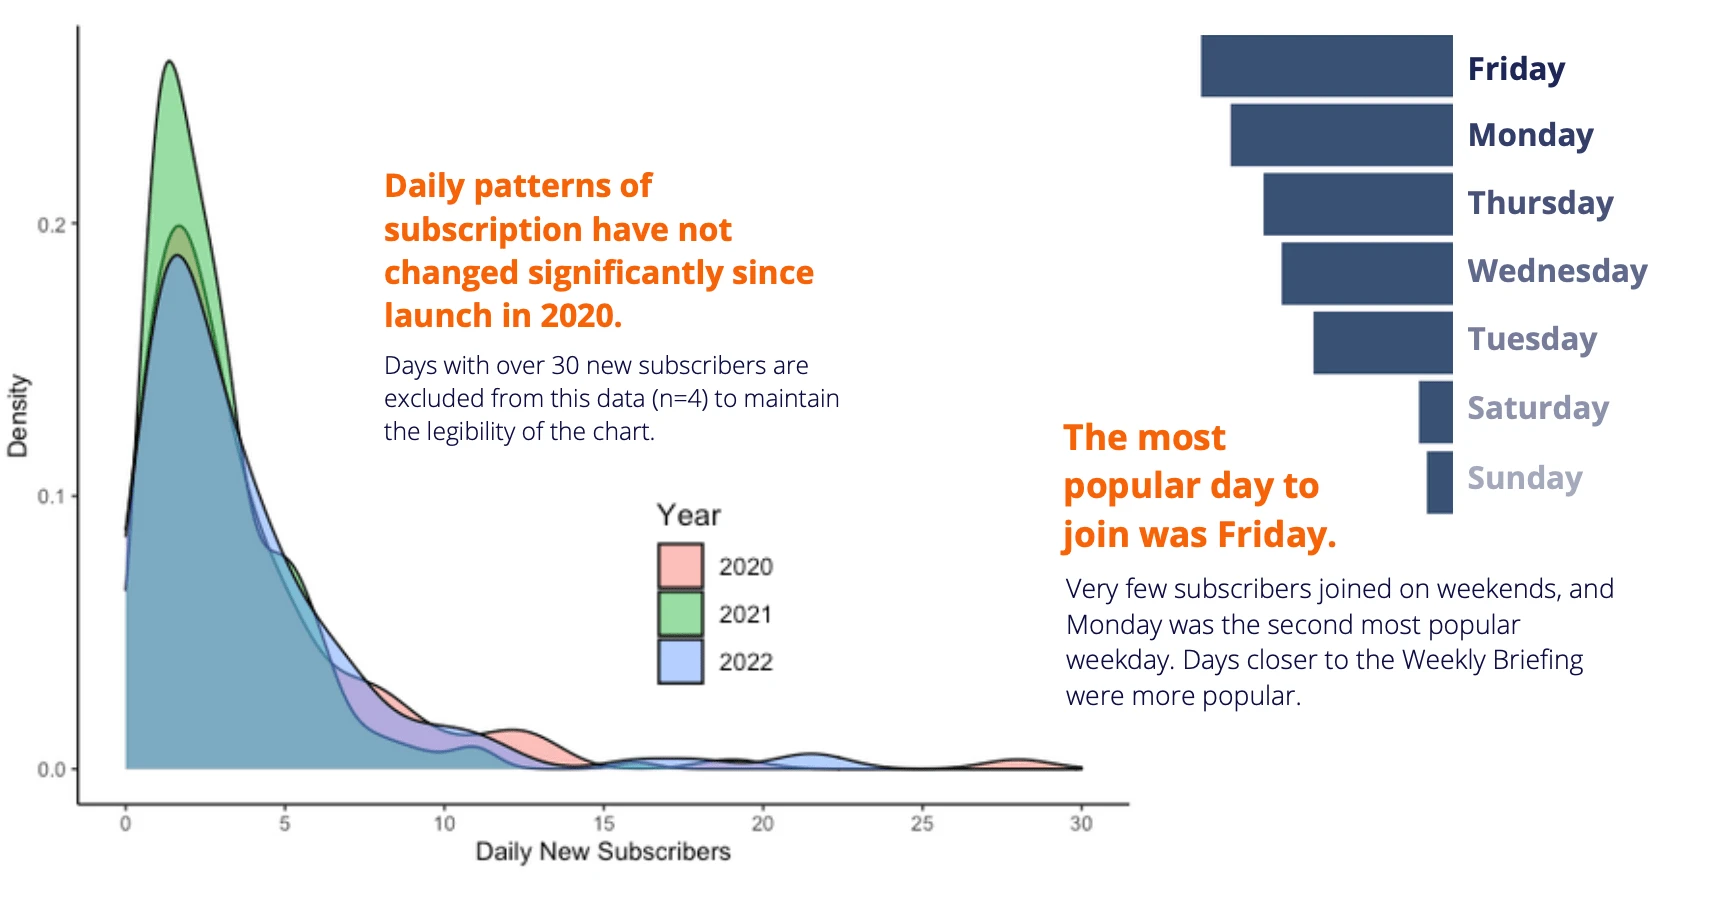
New subscriber patterns by year and day of the week.
Using text analysis in R, I created a word cloud of subscribers' job titles to help the newsletter team understand what types of people were subscribed:
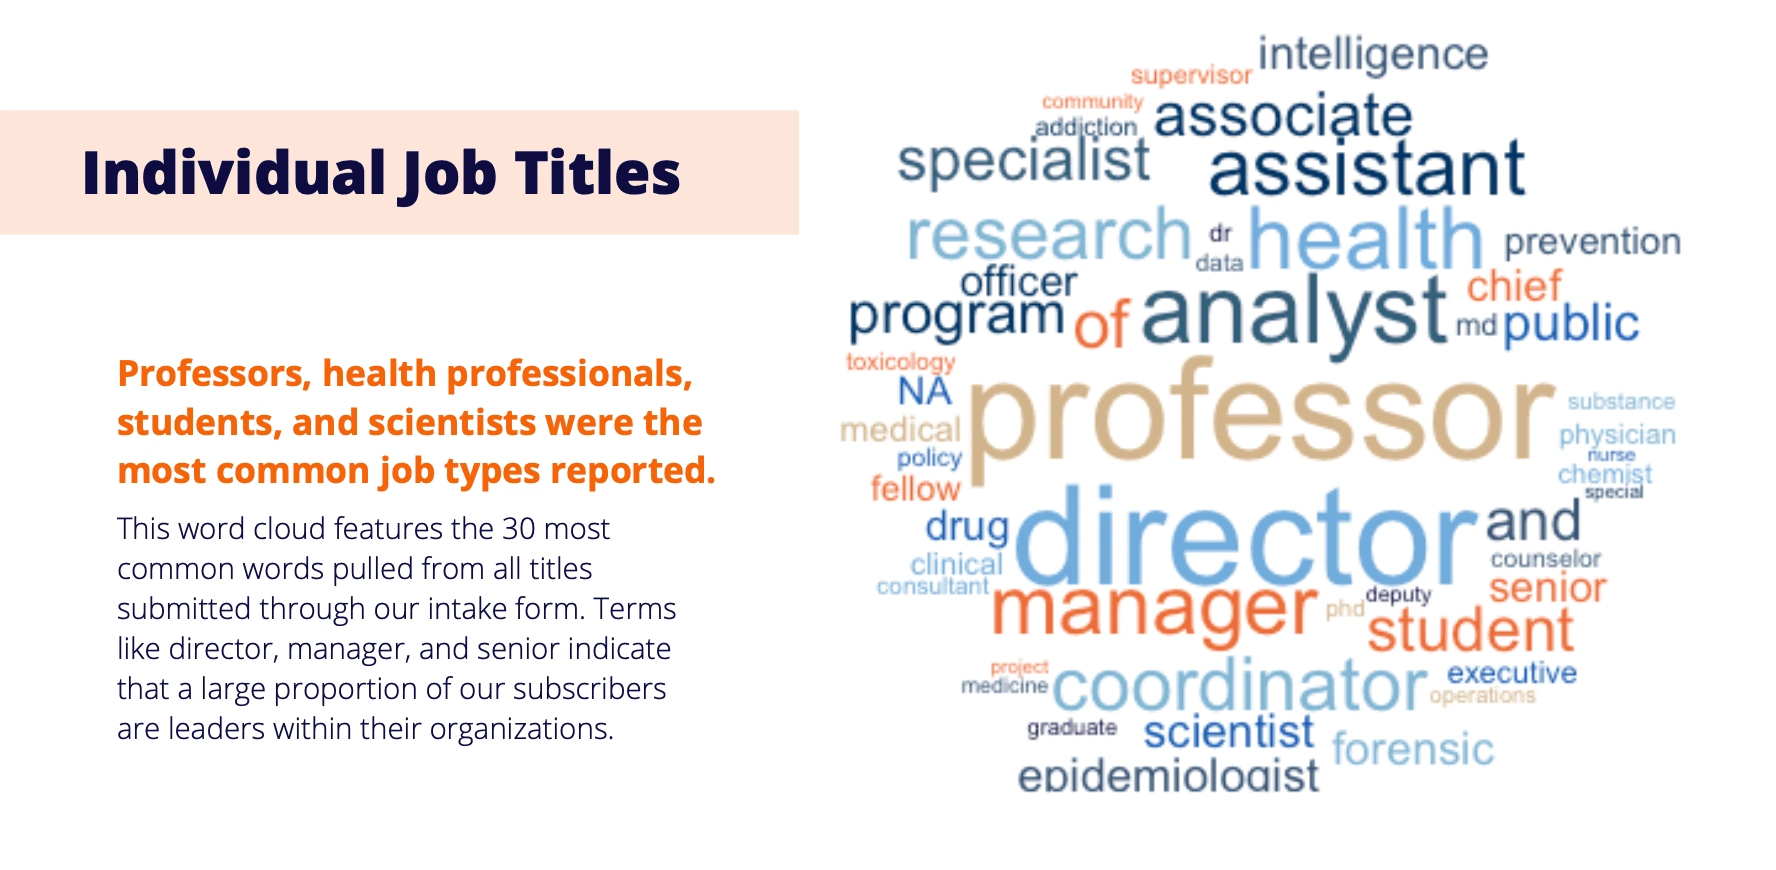
Word cloud of subscriber job titles.
Like this project
Posted Apr 24, 2024
A science lab wanted to understand who was subscribed to their weekly email newsletter. Here are four different ways I helped them visualize their reach.
Likes
0
Views
13