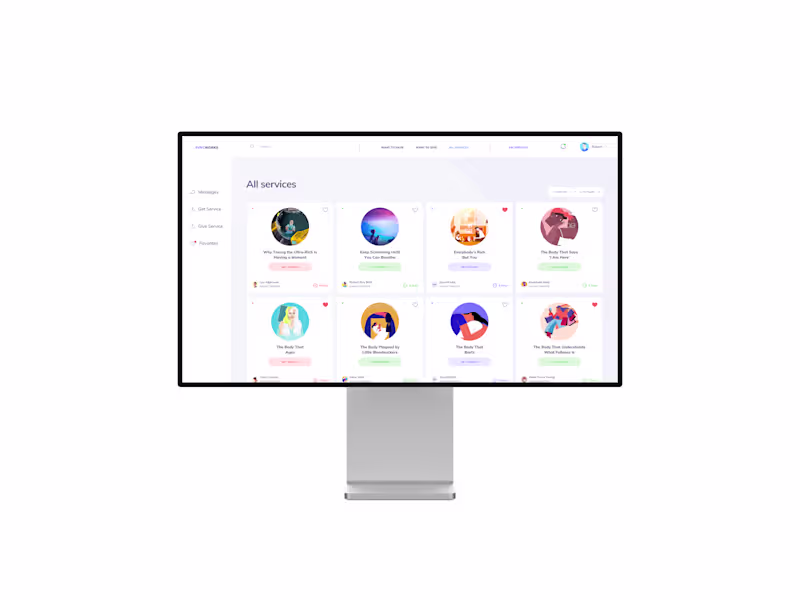
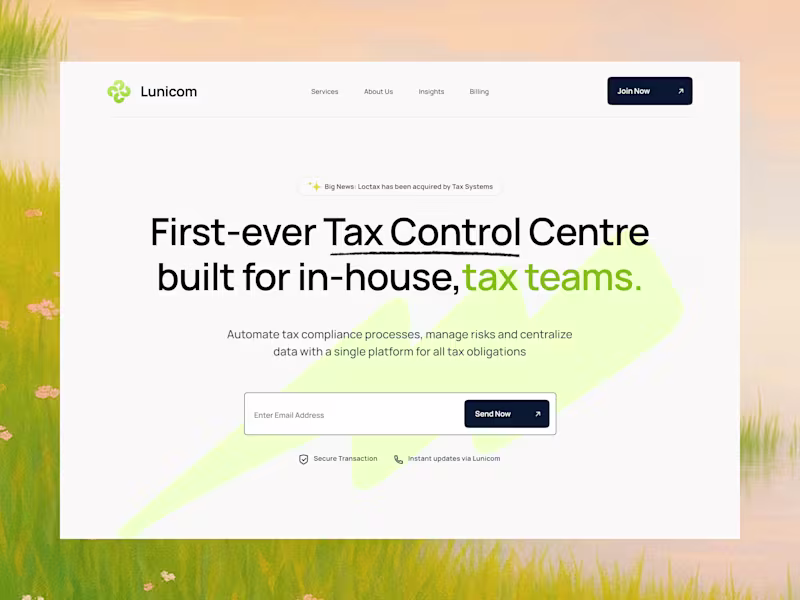
Conversion-focused UI/UX & Design Systems for SaaS
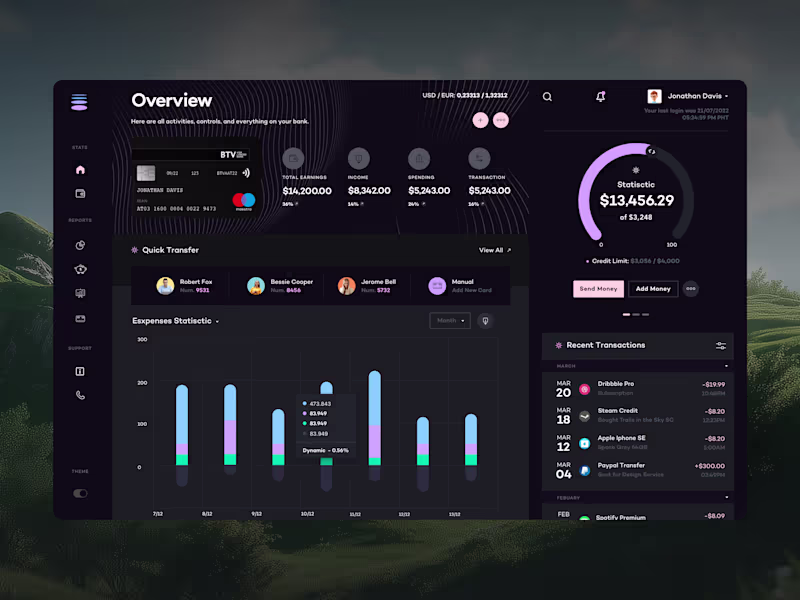
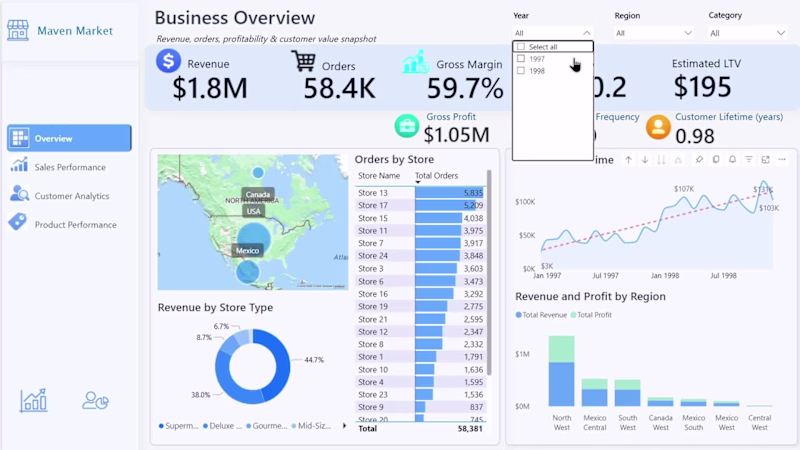
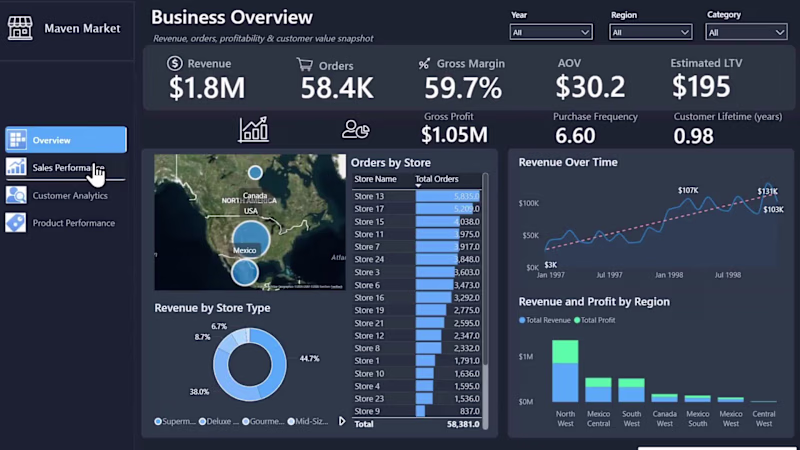
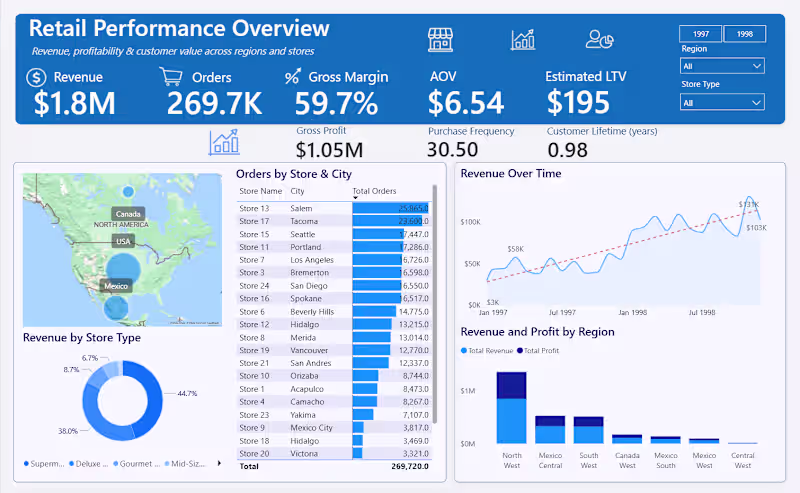
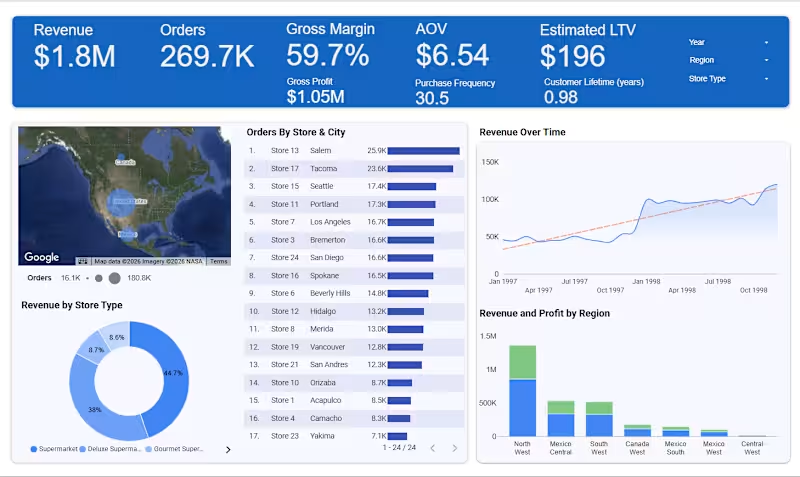
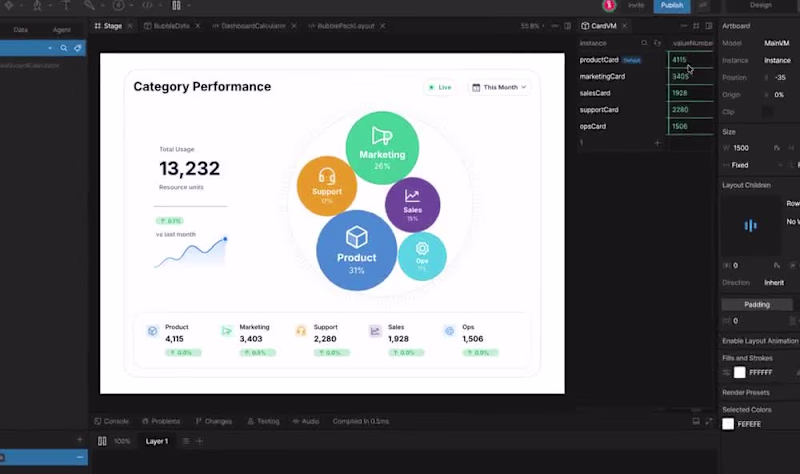
BI & Data Analyst | Power BI Expert, SQL, KPI Dashboards
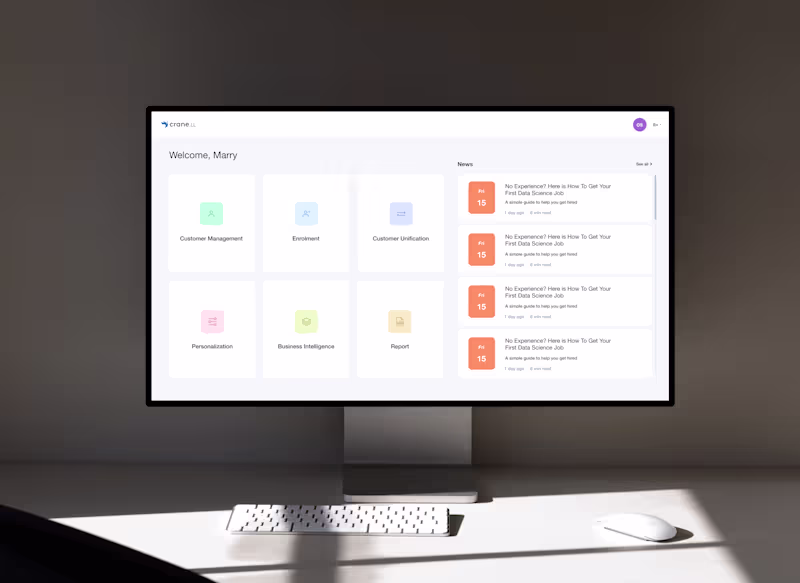
Low-Code/No-Code Specialist
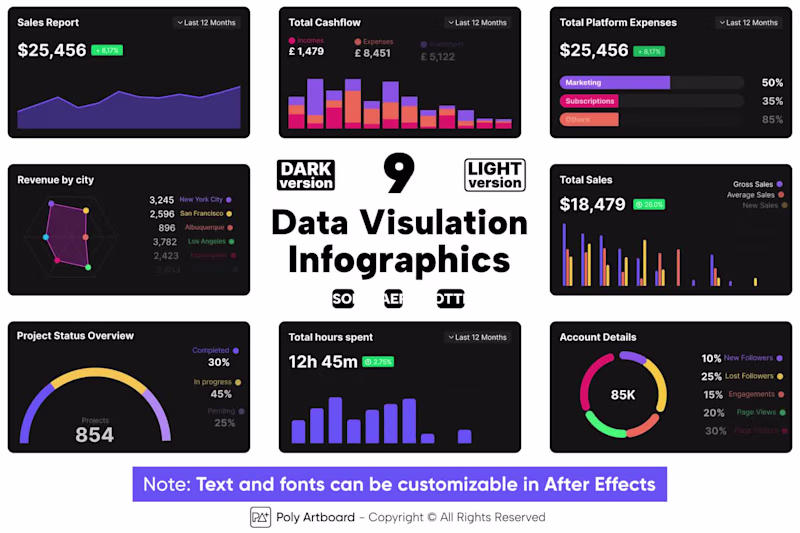
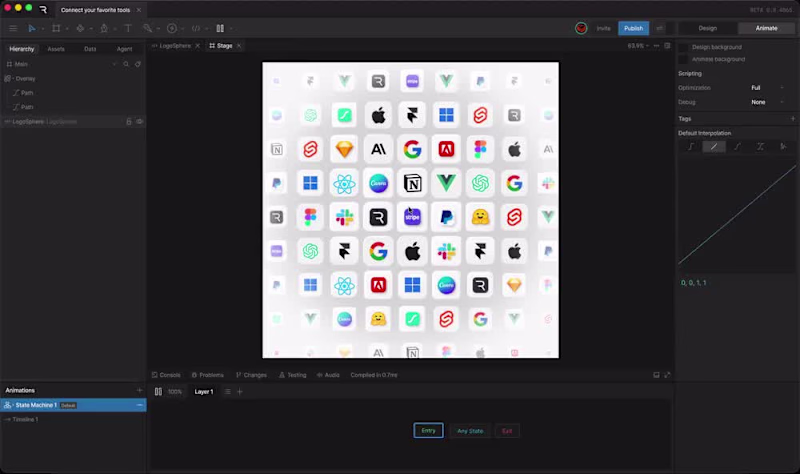
Sr. Motion Designer | Lottie, Rive, AE Templates and Scripts
Sr. Motion Designer | Lottie, Rive, AE Templates and Scripts
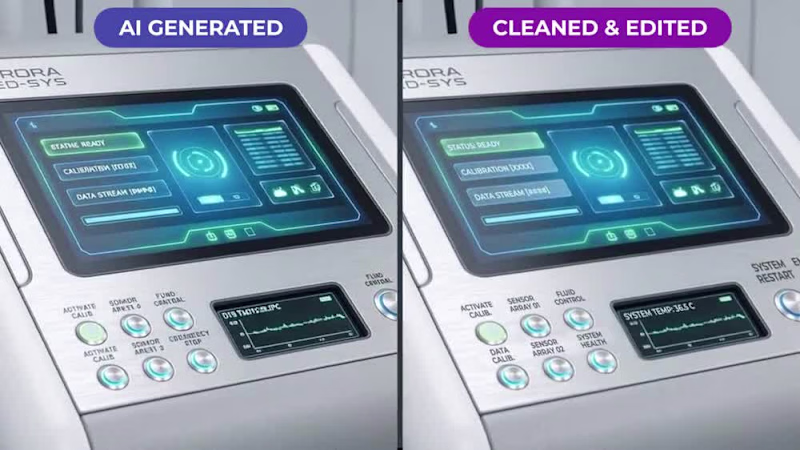
Senior Web3 Architect | Multimedia & Digital Ops

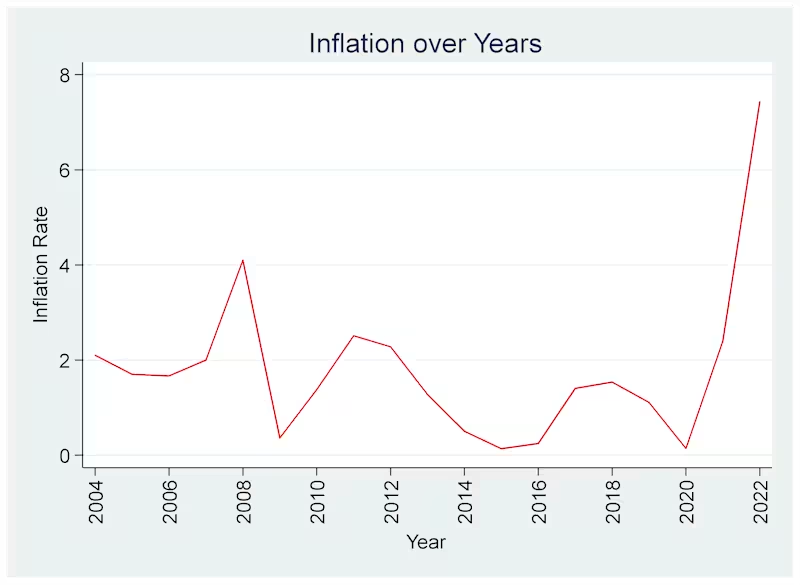
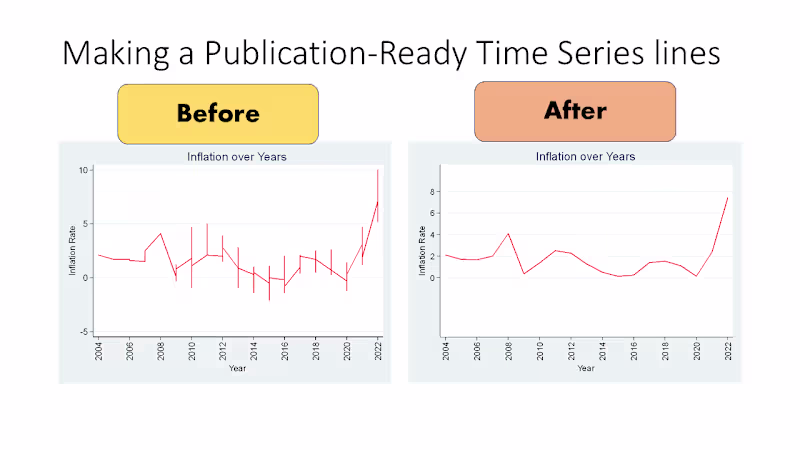
Advanced Statistical Analysis & Research Expert
Advanced Statistical Analysis & Research Expert
Graphic Designer specializing in corporate brand identity.