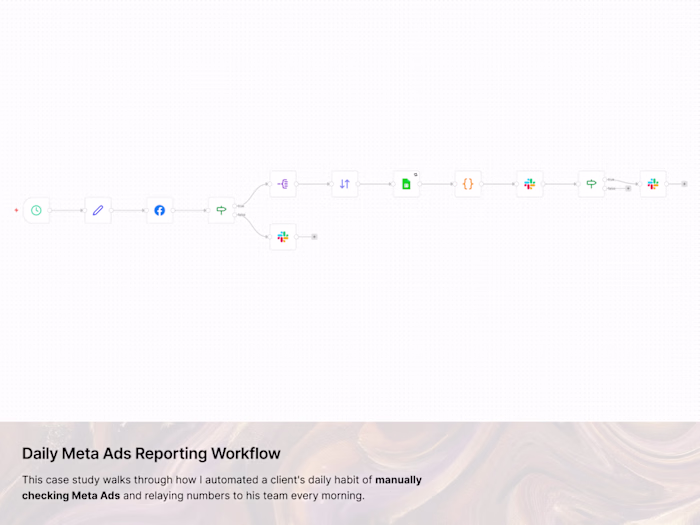
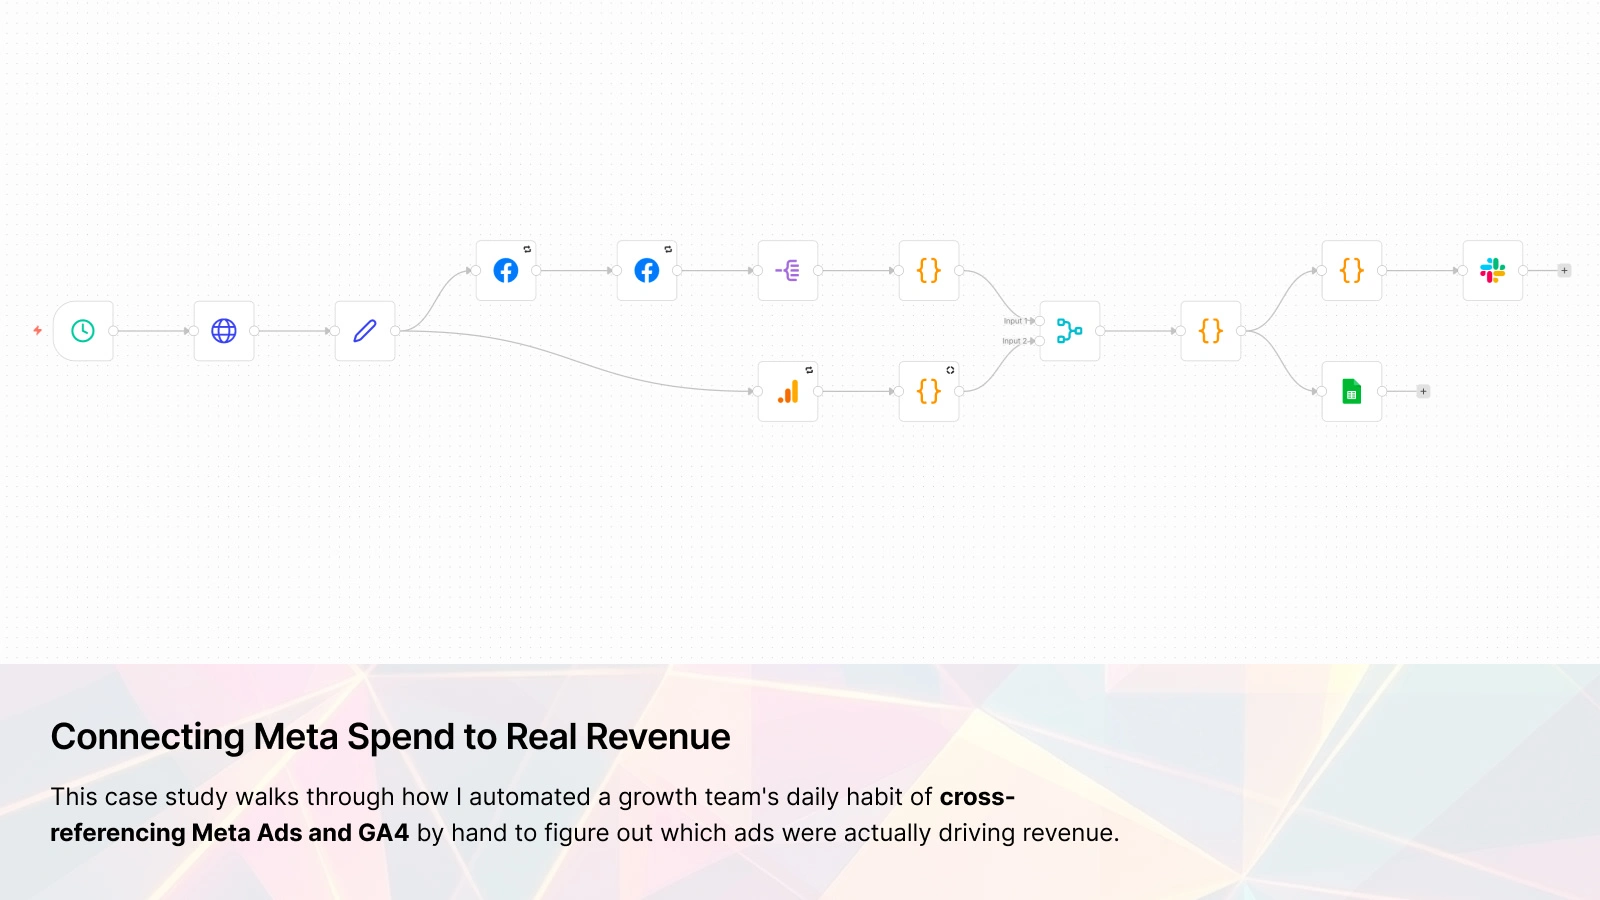
Connecting Meta Spend to Real Revenue
Uren Karakum
The Setup
A client I work with runs an online platform selling professional development courses online. Short-form, self-paced, priced between $49 and $149. Their primary acquisition channel is paid social, running campaigns across Facebook and Instagram simultaneously. The growth team is three people and two of them were spending the first thirty minutes of every morning doing the same thing: one pulling yesterday's numbers from Meta Ads Manager, the other opening GA4 in a separate tab, both trying to reconcile two datasets that had no shared language.
Meta would say an ad got 340 clicks. GA4 would say paid traffic brought 210 sessions. No one could tell which specific ad drove which sessions or whether any of those sessions turned into course purchases. They were optimizing spend based on Meta's own reporting, which stops at the click. What happened after the click was a separate investigation.
They asked me to build a daily report that combined the two. Something that would land in Slack before the team's morning standup. That was the brief.
Building It
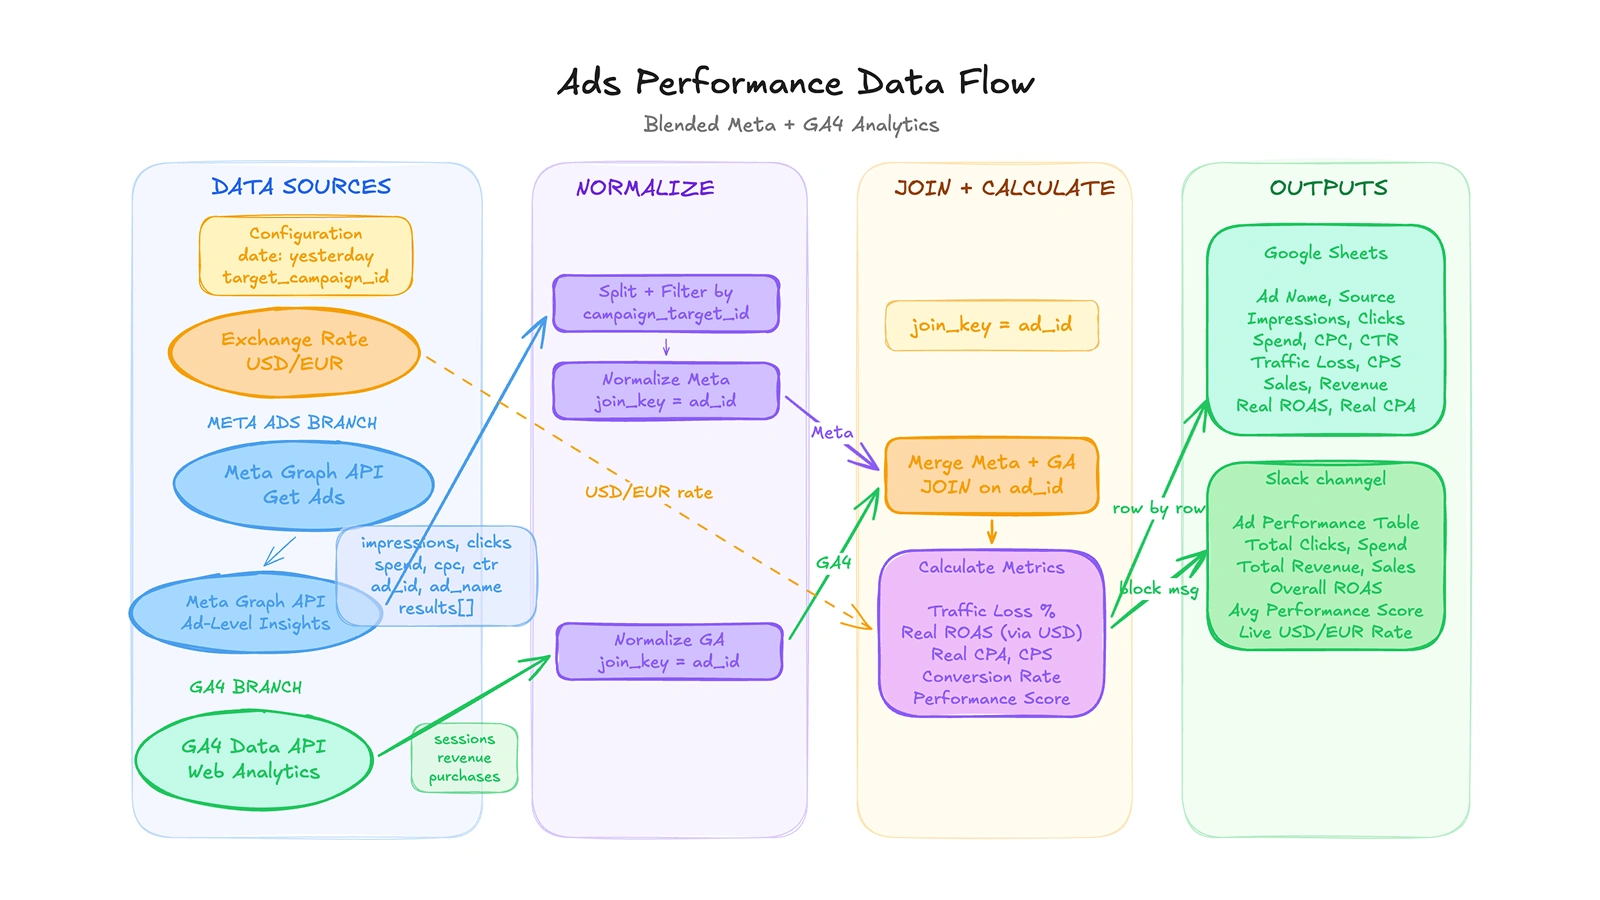
The first question was how to join the two datasets at the ad level. Meta identifies every ad with a numeric ID. GA4 has no native awareness of those IDs unless the tracking setup explicitly passes them through. Their developers had implemented this with a custom event parameter called
campaign_content, which they were populating with a value in the format [ad_id]_[placement] at click time: the ad ID, an underscore, then the placement name.I assumed it would arrive as a clean ID. It doesn't. The full string comes through, placement suffix and all. I had to split on the underscore and take the first segment before using it as the join key. That part was straightforward once I understood the format. What wasn't straightforward was a bug I hit immediately after: the join was producing zero output rows. Every row from Meta, every row from GA4, and nothing matched.
The cause was a type mismatch. Meta's insights endpoint returns
ad_id as a number in some response fields and as a string in others, depending on which edge you're hitting. GA4 always returns strings. The same number as a string does not equal the same number as an integer when n8n evaluates the join condition. Forcing both sides to toString() before the merge fixed it.There was a second metric problem that took longer to track down. I had configured the GA4 node to pull a user count using
newUsers and totalUsers as fallbacks. Both came back empty. Not zero, empty. The GA4 node in n8n doesn't surface those particular metric names in its response. The correct field is activeUsers, which is a distinct metric with a distinct name. Once I swapped to that, the column started populating.The workflow also fetches a live USD/EUR exchange rate before any calculations run. The client bills customers in euros but Meta bills in dollars. Without converting at the time of the report, the ROAS figures would be based on the wrong denominator. I added a static fallback rate so the workflow still produces a report if the exchange rate call fails.
Each ad ends up with a PerformanceScore between 0 and 100, weighting ROAS, CTR, and on-site engagement rate into a single number. That wasn't in the original scope at all. It came out of a conversation midway through the build, when I asked how the team would actually use the report. The answer was "we want to know which ads to scale and which to pause, but sometimes the ROAS is good and the CTR is terrible and we don't know what to do." A composite score that compresses three signals into one gave them a faster first filter.
A blended analytics pipeline that joins Meta Ads data with GA4 web analytics at the individual ad level, enriches it with live USD/EUR exchange rates, then calculates true ROAS, CPA, traffic loss, and a composite performance score before reporting to Google Sheets and Slack.
What It Looks Like in Practice
Before, the morning ritual took around thirty minutes and produced a manually updated spreadsheet that two people had to touch before anyone could act on it. The margin for error was real: a wrong campaign ID filter, a copy-paste mistake, a day where one person was out and the other skipped it.
Now, at 6 AM every morning, a Slack message arrives in the growth channel with a table showing every active ad: Meta spend, clicks, and CTR alongside GA4 sessions, user counts, and purchase revenue, plus a calculated traffic loss percentage, a real ROAS converted to a consistent currency, and the PerformanceScore. A summary row at the bottom shows totals and overall ROAS. A button links to the Google Sheet where every day's data is appended automatically.
The traffic loss column ended up being the part the team referenced most. It measures the gap between Meta's reported clicks and GA4's recorded sessions for each ad, expressed as a percentage. A high number on a specific ad usually points to a slow landing page on mobile, a broken UTM parameter, or a tracking misconfiguration. They hadn't had visibility into that at the ad level before. In the first six weeks after the workflow went live, it surfaced three broken links and one landing page that was timing out for mobile users in a specific region. None of those would have shown up in either dashboard alone.
Tools Used
n8n handled everything end to end: scheduling, API calls, transformation, join logic, score calculation, and delivery to both Slack and Google Sheets.
Meta Graph API v23.0 provided ad metadata and performance metrics at the ad level, scoped to a single campaign ID stored in a central configuration node so it doesn't require touching any code to update.
Google Analytics 4 provided session, purchase, user, and engagement data using custom event dimensions to carry ad attribution from click through to conversion.
Slack received the daily report as a structured block message in the team's growth channel, including a button linking directly to the historical data in Sheets.
Google Sheets stored every ad's daily metrics as an appended row, building a clean historical record without anyone having to maintain it.
Like this project
Posted Feb 21, 2026
A course platform's growth team was reading two dashboards every morning and guessing at the connection. Now they get one Slack message with the full picture.