The network for creativity
Join 1.25M professional creatives like you
Connect with clients, get discovered, and run your business 100% commission-free
Creatives on Contra have earned over $150M and we are just getting started
Back to feedPost

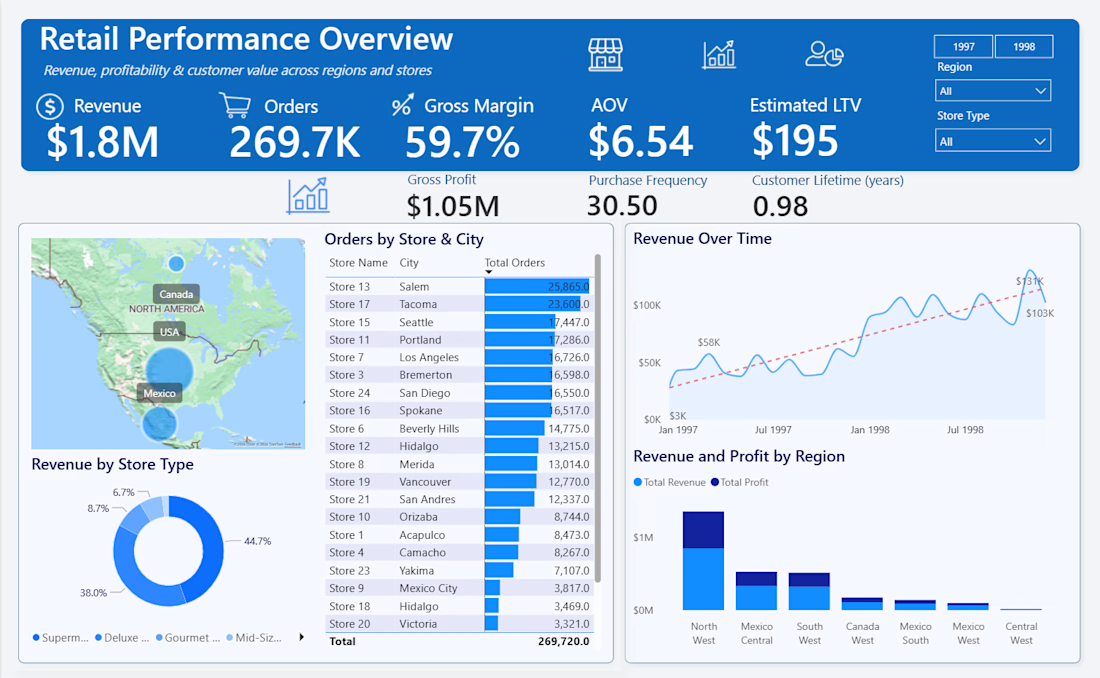
Retail Revenue & Customer Insights Dashboard (Power BI)
This Power BI dashboard provides a comprehensive view of retail performance, combining revenue, orders, margin, and customer value metrics in a single executive-ready report.
It enables stakeholders to track sales trends over time, analyze regional performance, and understand customer behavior through KPIs such as AOV, purchase frequency, and estimated lifetime value.
The report is designed for fast decision-making, featuring automated filtering, geographic insights, and clean visual hierarchy suitable for leadership and operational teams.
Built with scalable data modeling and designed to support automated refresh and alerting workflows.

The network for creativity
Join 1.25M professional creatives like you
Connect with clients, get discovered, and run your business 100% commission-free
Creatives on Contra have earned over $150M and we are just getting started





Related posts

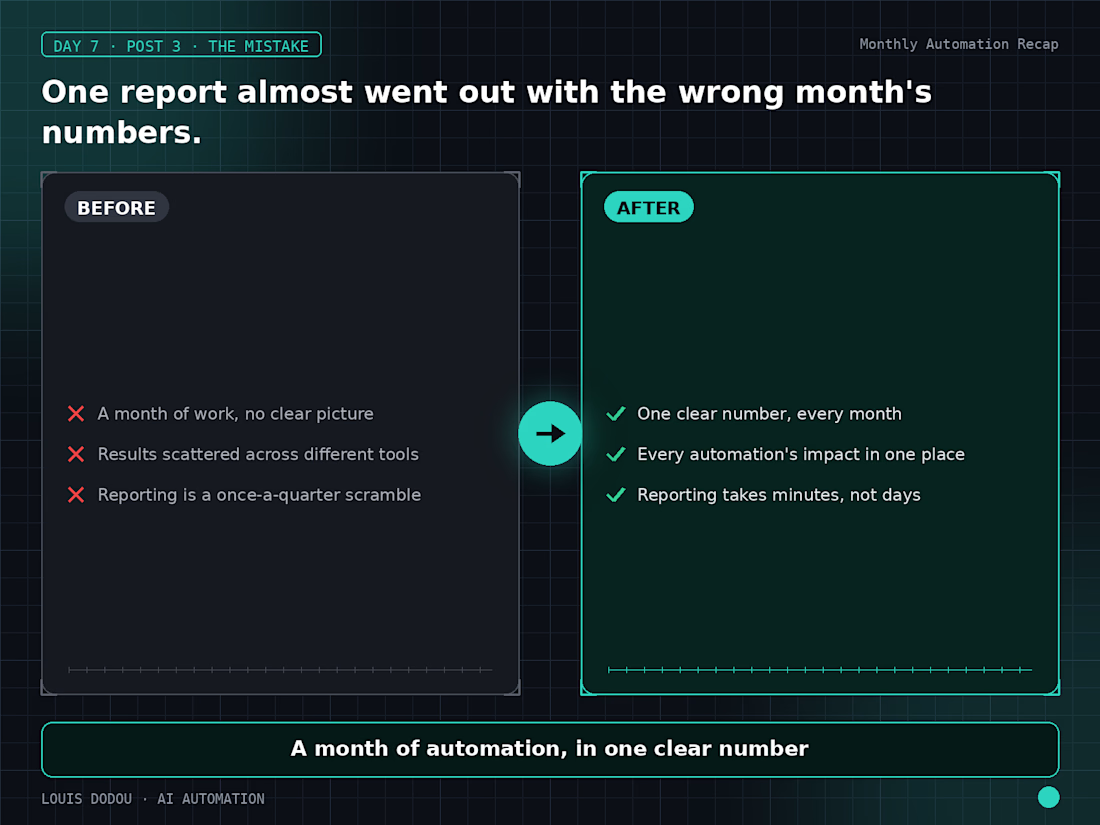
One report almost went out with the wrong month's numbers.
A dashboard hadn't refreshed before the export ran. Caught it before it sent now every report confirms the data's freshness before it goes out, not after.
→ Automating the report still needs one manual check: is this actually current?



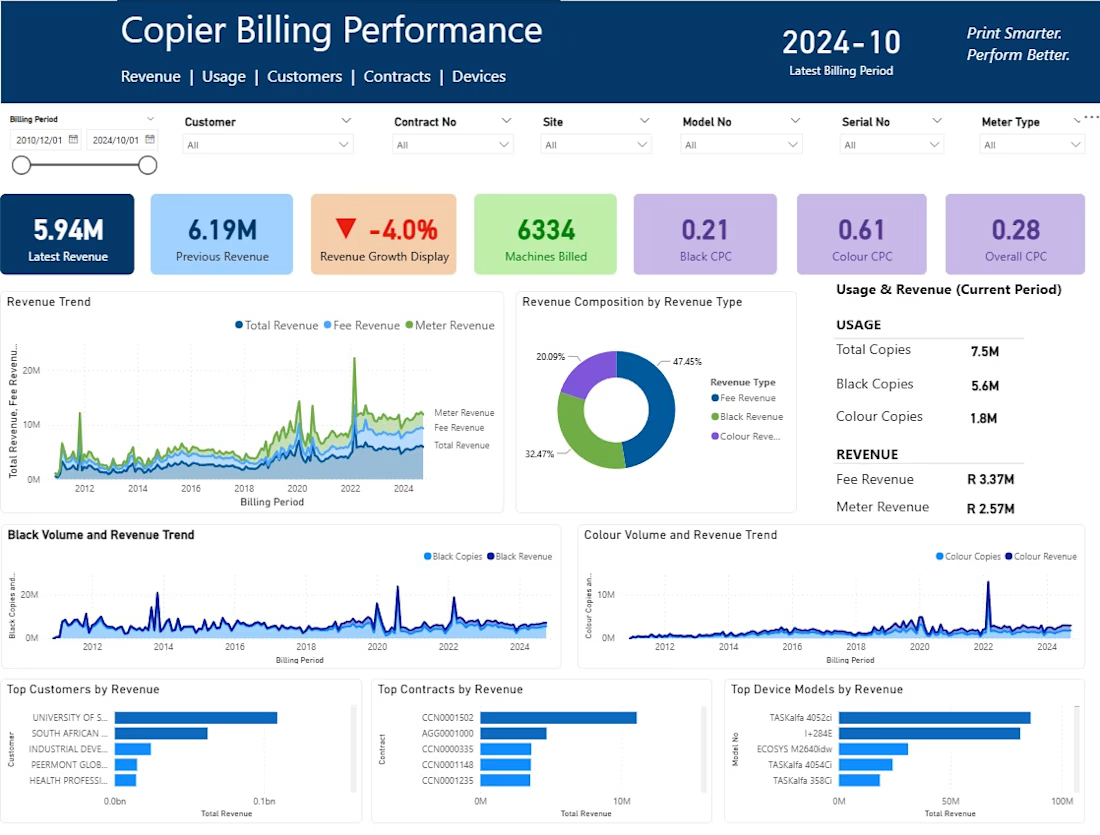
Power BI dashboard providing visibility into billing performance, revenue trends, customer activity, and operational KPIs. Built using SQL and ERP data to support proactive business decisions.



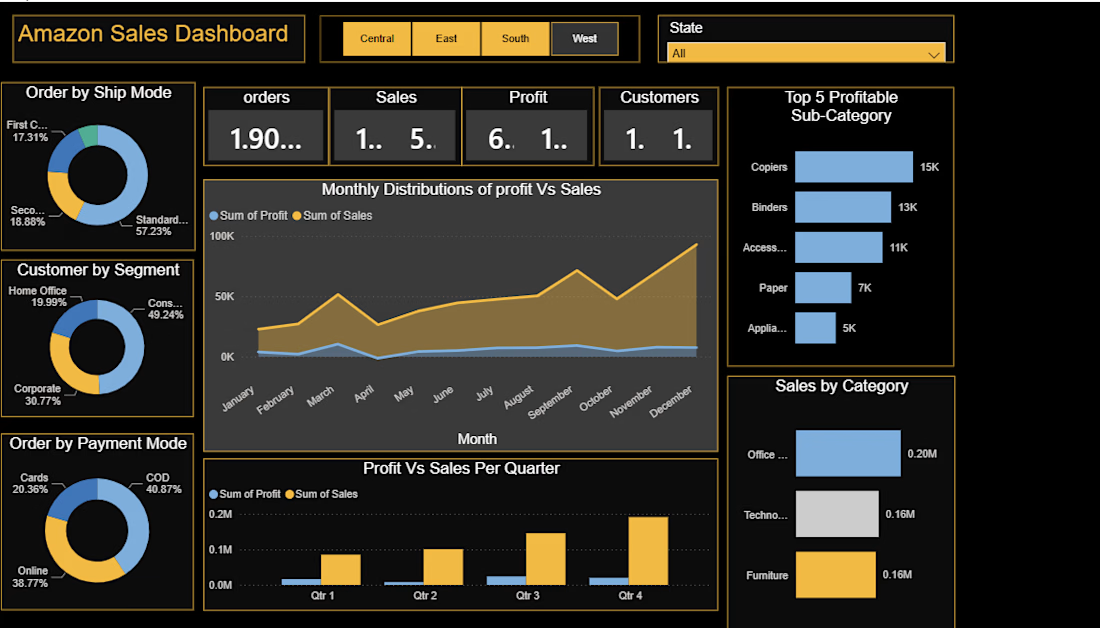
Built an interactive Power BI dashboard to analyze Amazon sales performance and key business metrics. Cleaned and transformed data using Power Query, created data relationships and DAX calculations, and developed interactive visualizations to identify sales trends, product performance, and actionable business insights.