The network for creativity
Join 1.25M professional creatives like you
Connect with clients, get discovered, and run your business 100% commission-free
Creatives on Contra have earned over $150M and we are just getting started
Back to feedPost

In this project, an IPL Statistics Dashboard was created with the help of PowerBI. This project focused on data visualisation and data analysis.
An interactive, Power BI dashboard analyzing 18 seasons of IPL data (2008–2025). Built using Power BI, DAX, Power Query, and SQL, the project explores team performance, player achievements, toss strategies, venue trends, playoff statistics, and iconic IPL rivalries through dynamic KPIs and interactive visualizations.
Focus: Data Analytics | Business Intelligence | Sports Analytics | Data Visualization


The network for creativity
Join 1.25M professional creatives like you
Connect with clients, get discovered, and run your business 100% commission-free
Creatives on Contra have earned over $150M and we are just getting started







Related posts

AI Video Generation Dashboard SaaS UI/UX Design
Designed a modern AI Video Generation Dashboard for a SaaS platform. The interface includes a prompt-based ge...


Crisp design!

Hi! Sharing my new project: a CRM dashboard for dental clinics 🦷
A day timeline for every chair, patient records with tooth charts, and a voice AI assistant for the front desk.
I’d really appreciate your support and feedback ❤️
Full project
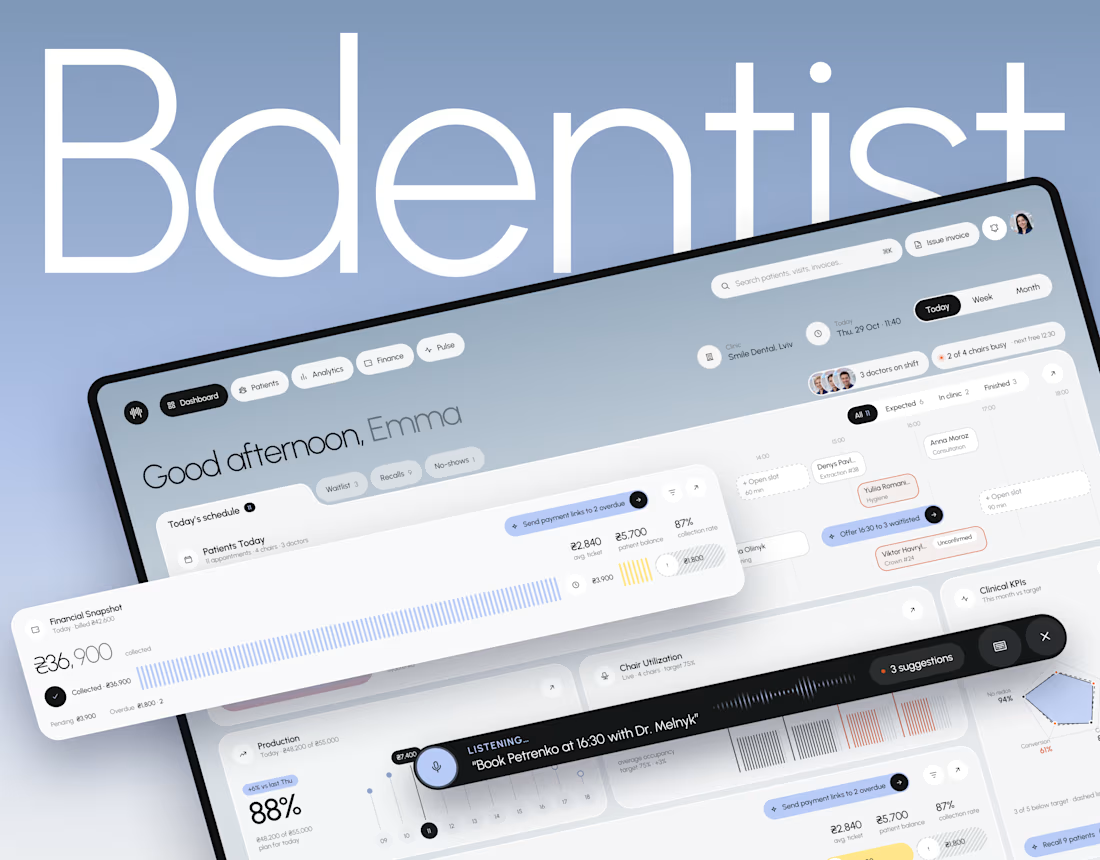

The blue-grey in the dashboard reminds me of Porsche's color. Looks elegant and powerful at the same time. Love this kind of minimal grey.

AI system that is capable of generating animated explainer videos including a script, voiceover, soundtrack, sound effects, scene components, camera control.


It will be very interesting if it can handle all the work flow, that means what I will be bringing to the table is my creativity. Great one there!