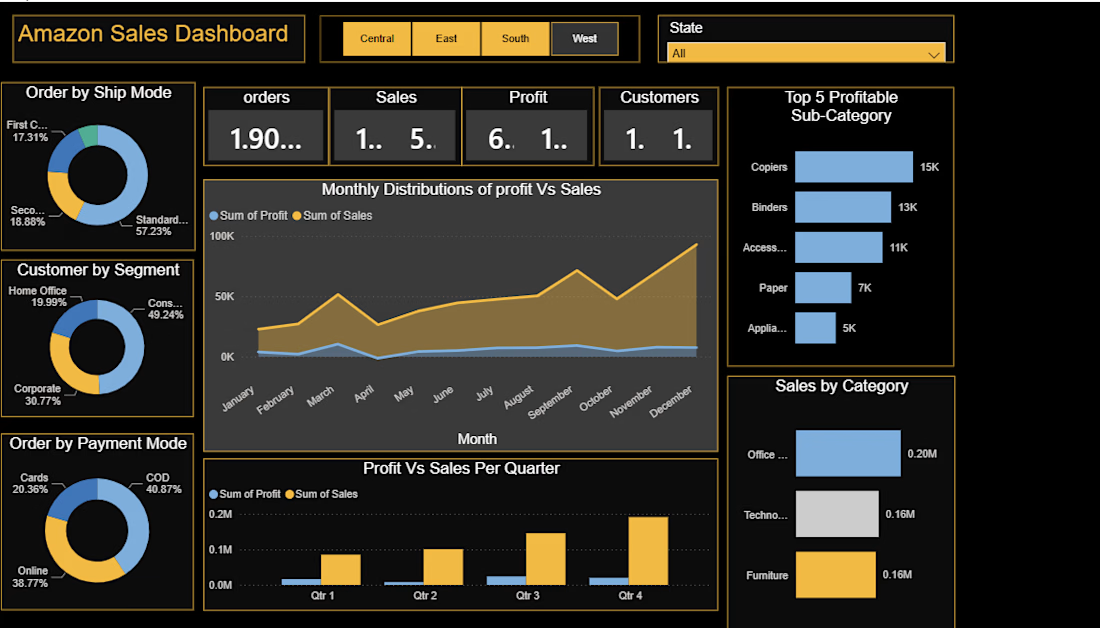
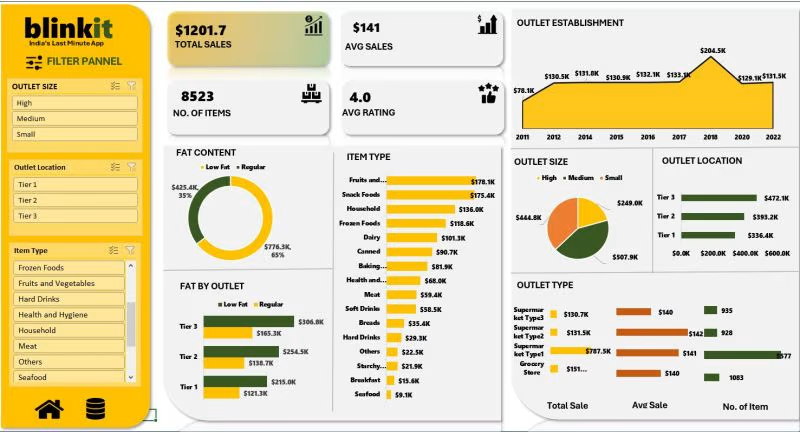
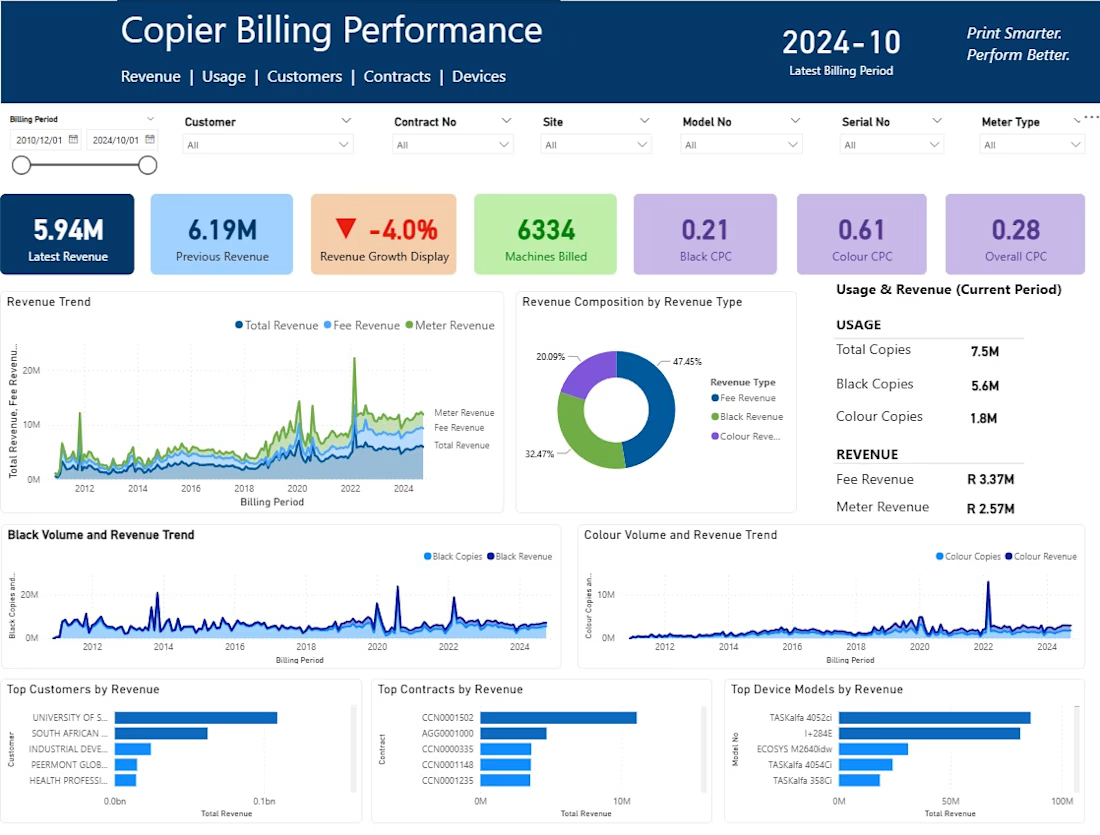
Designed to help you analyze revenue, sales performance, customer behavior, and product insights in one professional report. This editable template includes 4 interactive pages with modern visuals, KPI tracking, and dynamic filtering.
YOUR DASHBOARD MIGHT BE LYING TO YOU.
Not because Power BI is wrong.
Because the data underneath it is.
A beautiful dashboard built on messy data doesn't create better decisions.
It creates confident mistakes.
Then someone adds a few colorful charts, calls it "analytics," and moves on.
I don't work that way.
I take the mess first.
RAW DATA → CLEAN → TRANSFORM → MODEL → ANALYZE → POWER BI → INSIGHTS
I work with Excel, CSV and business datasets to:
→ Clean and validate messy data
→ Transform data using Power Query
→ Combine multiple files and sources
→ Build data models and DAX measures
→ Create interactive Power BI dashboards
→ Identify trends, KPIs and business insights
→ Build reporting workflows that are easier to refresh and maintain
Because a dashboard shouldn't just look impressive.
Every KPI should answer a question.
Every visual should have a purpose.
And every number should be trustworthy.
That's the service I'm offering.
If your business data is sitting across messy Excel files, CSVs or scattered spreadsheets, I can turn it into:
Clean Data → Clear Analysis → Interactive Power BI → Better Decisions
You bring the data.
I'll find what it's trying to say.
📊 Power BI Dashboard & Data Analytics
Now available for freelance projects on Contra.
I actually 99.99% agree,
Furthermore Outliers removal is part of cleaning datasets we choose to begin a project, Descriptive statistics is a key for detection
Your data isn't useless. Your dashboard probably is. 📊
I took a dataset full of messy, inconsistent raw data and turned it into a Power BI dashboard that makes the story behind the numbers impossible to miss. This wasn't just about making charts look good. I built the project end-to-end:
Data Cleaning - handled duplicates, missing values, inconsistencies and messy fields
Data Transformation - structured raw data using Excel & Power Query
Data Modeling - created an analysis-ready data model
DAX - built calculated measures and business KPIs
Dashboard Design - interactive visuals, filters, KPIs and drill-downs
Analysis - transformed numbers into meaningful business insights
The workflow:
Raw & Messy Data
↓
Clean & Reliable Data
↓
Transformation & Modeling
↓
DAX & Analysis
↓
Interactive Power BI Dashboard
↓
Actionable Business Insights
The goal wasn't to create another pretty dashboard. The goal was to answer the questions that actually matter: What is happening? Why is it happening? And where should we focus next? This project represents how I approach data analytics:
Clean it. Understand it. Visualize it. Turn it into decisions.
I recently worked on a retail sales dataset to demonstrate how raw business data can be transformed into useful insights.
My process included:
✅ Data cleaning and validation
✅ Revenue calculations
✅ Sales performance analysis
✅ Product and store analysis
✅ Excel/Power BI visualization
✅ Identifying actionable business insights
The analysis answers questions such as:
• Which store generates the most revenue?
• Which products drive sales?
• Which products sell the most units?
• Which salesperson performs best?
• How do sales change over time?
Tools: Excel | Power BI | Python/Pandas | SQL
Clean data is the foundation. Good analysis turns that data into decisions.