ASK4 | Infographics and Data Visualisation

Cara Ellis


ASK4 deliver specialist managed internet to the multi-tenant sector. I produced a number of infographics and data visualisations for their research documents.
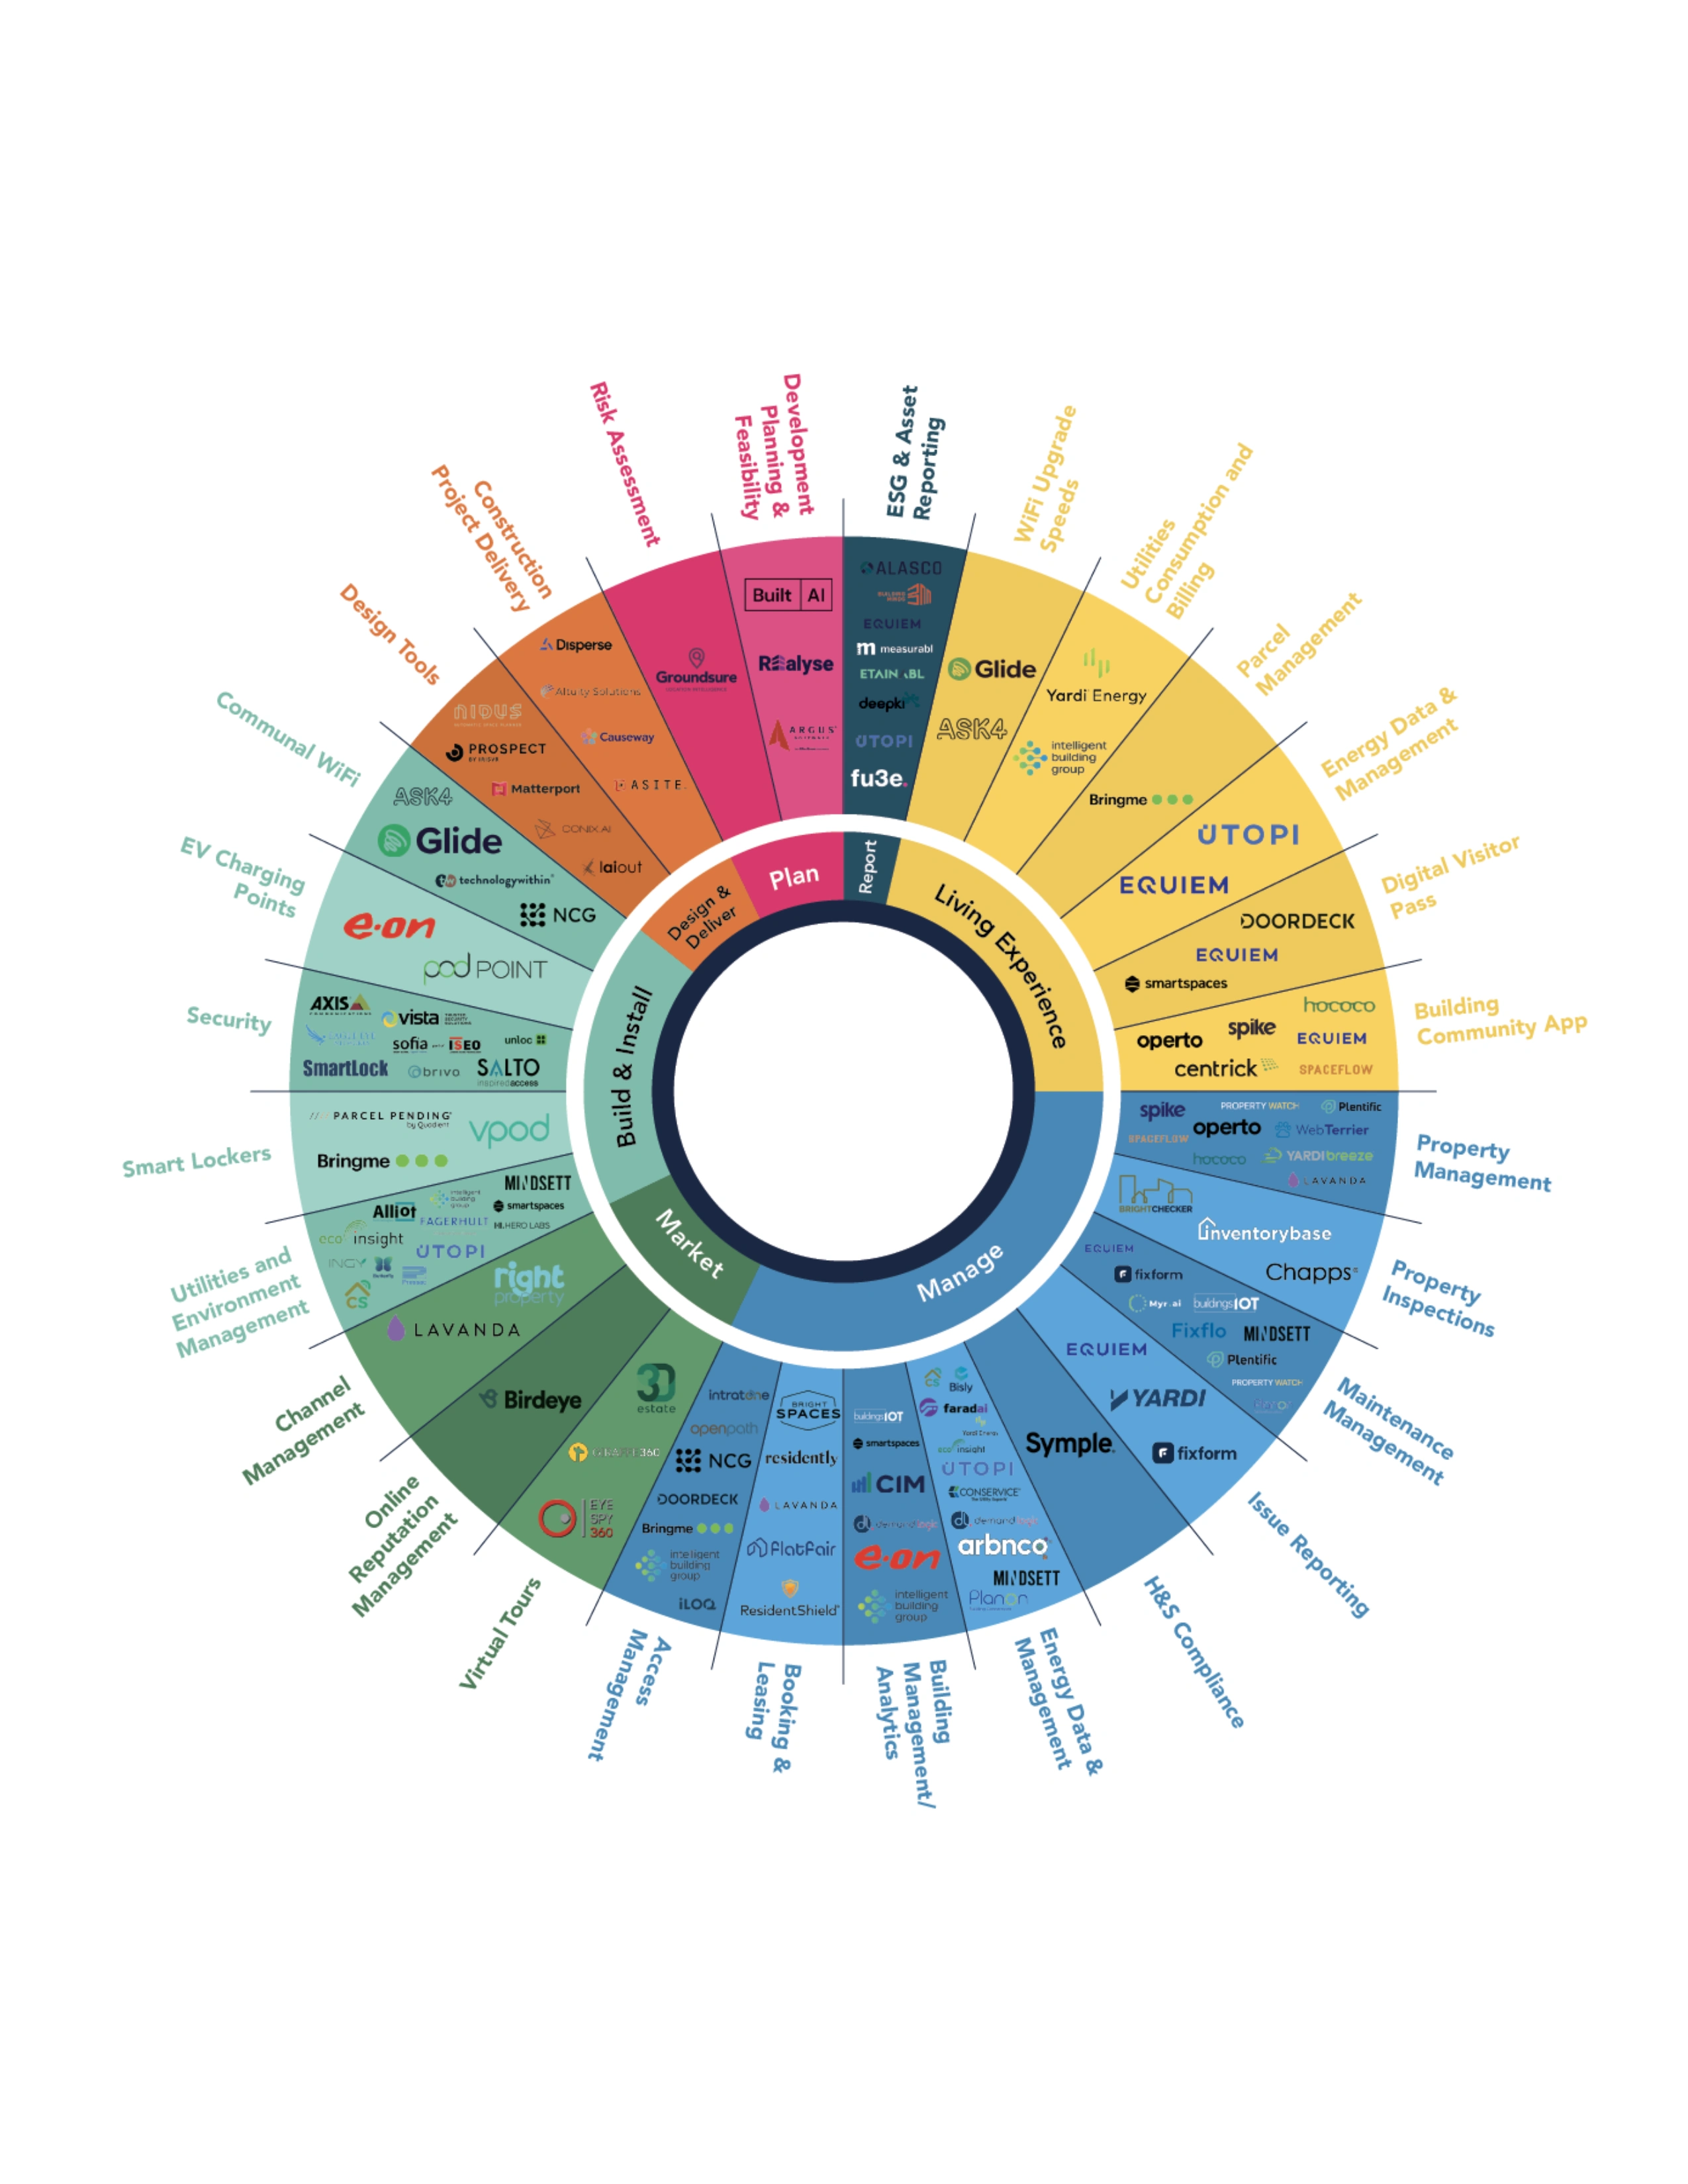
Proptech Stack Infographic
The below infographic was created to visualise the software that plays a part in ASK4's property and distribution processes.
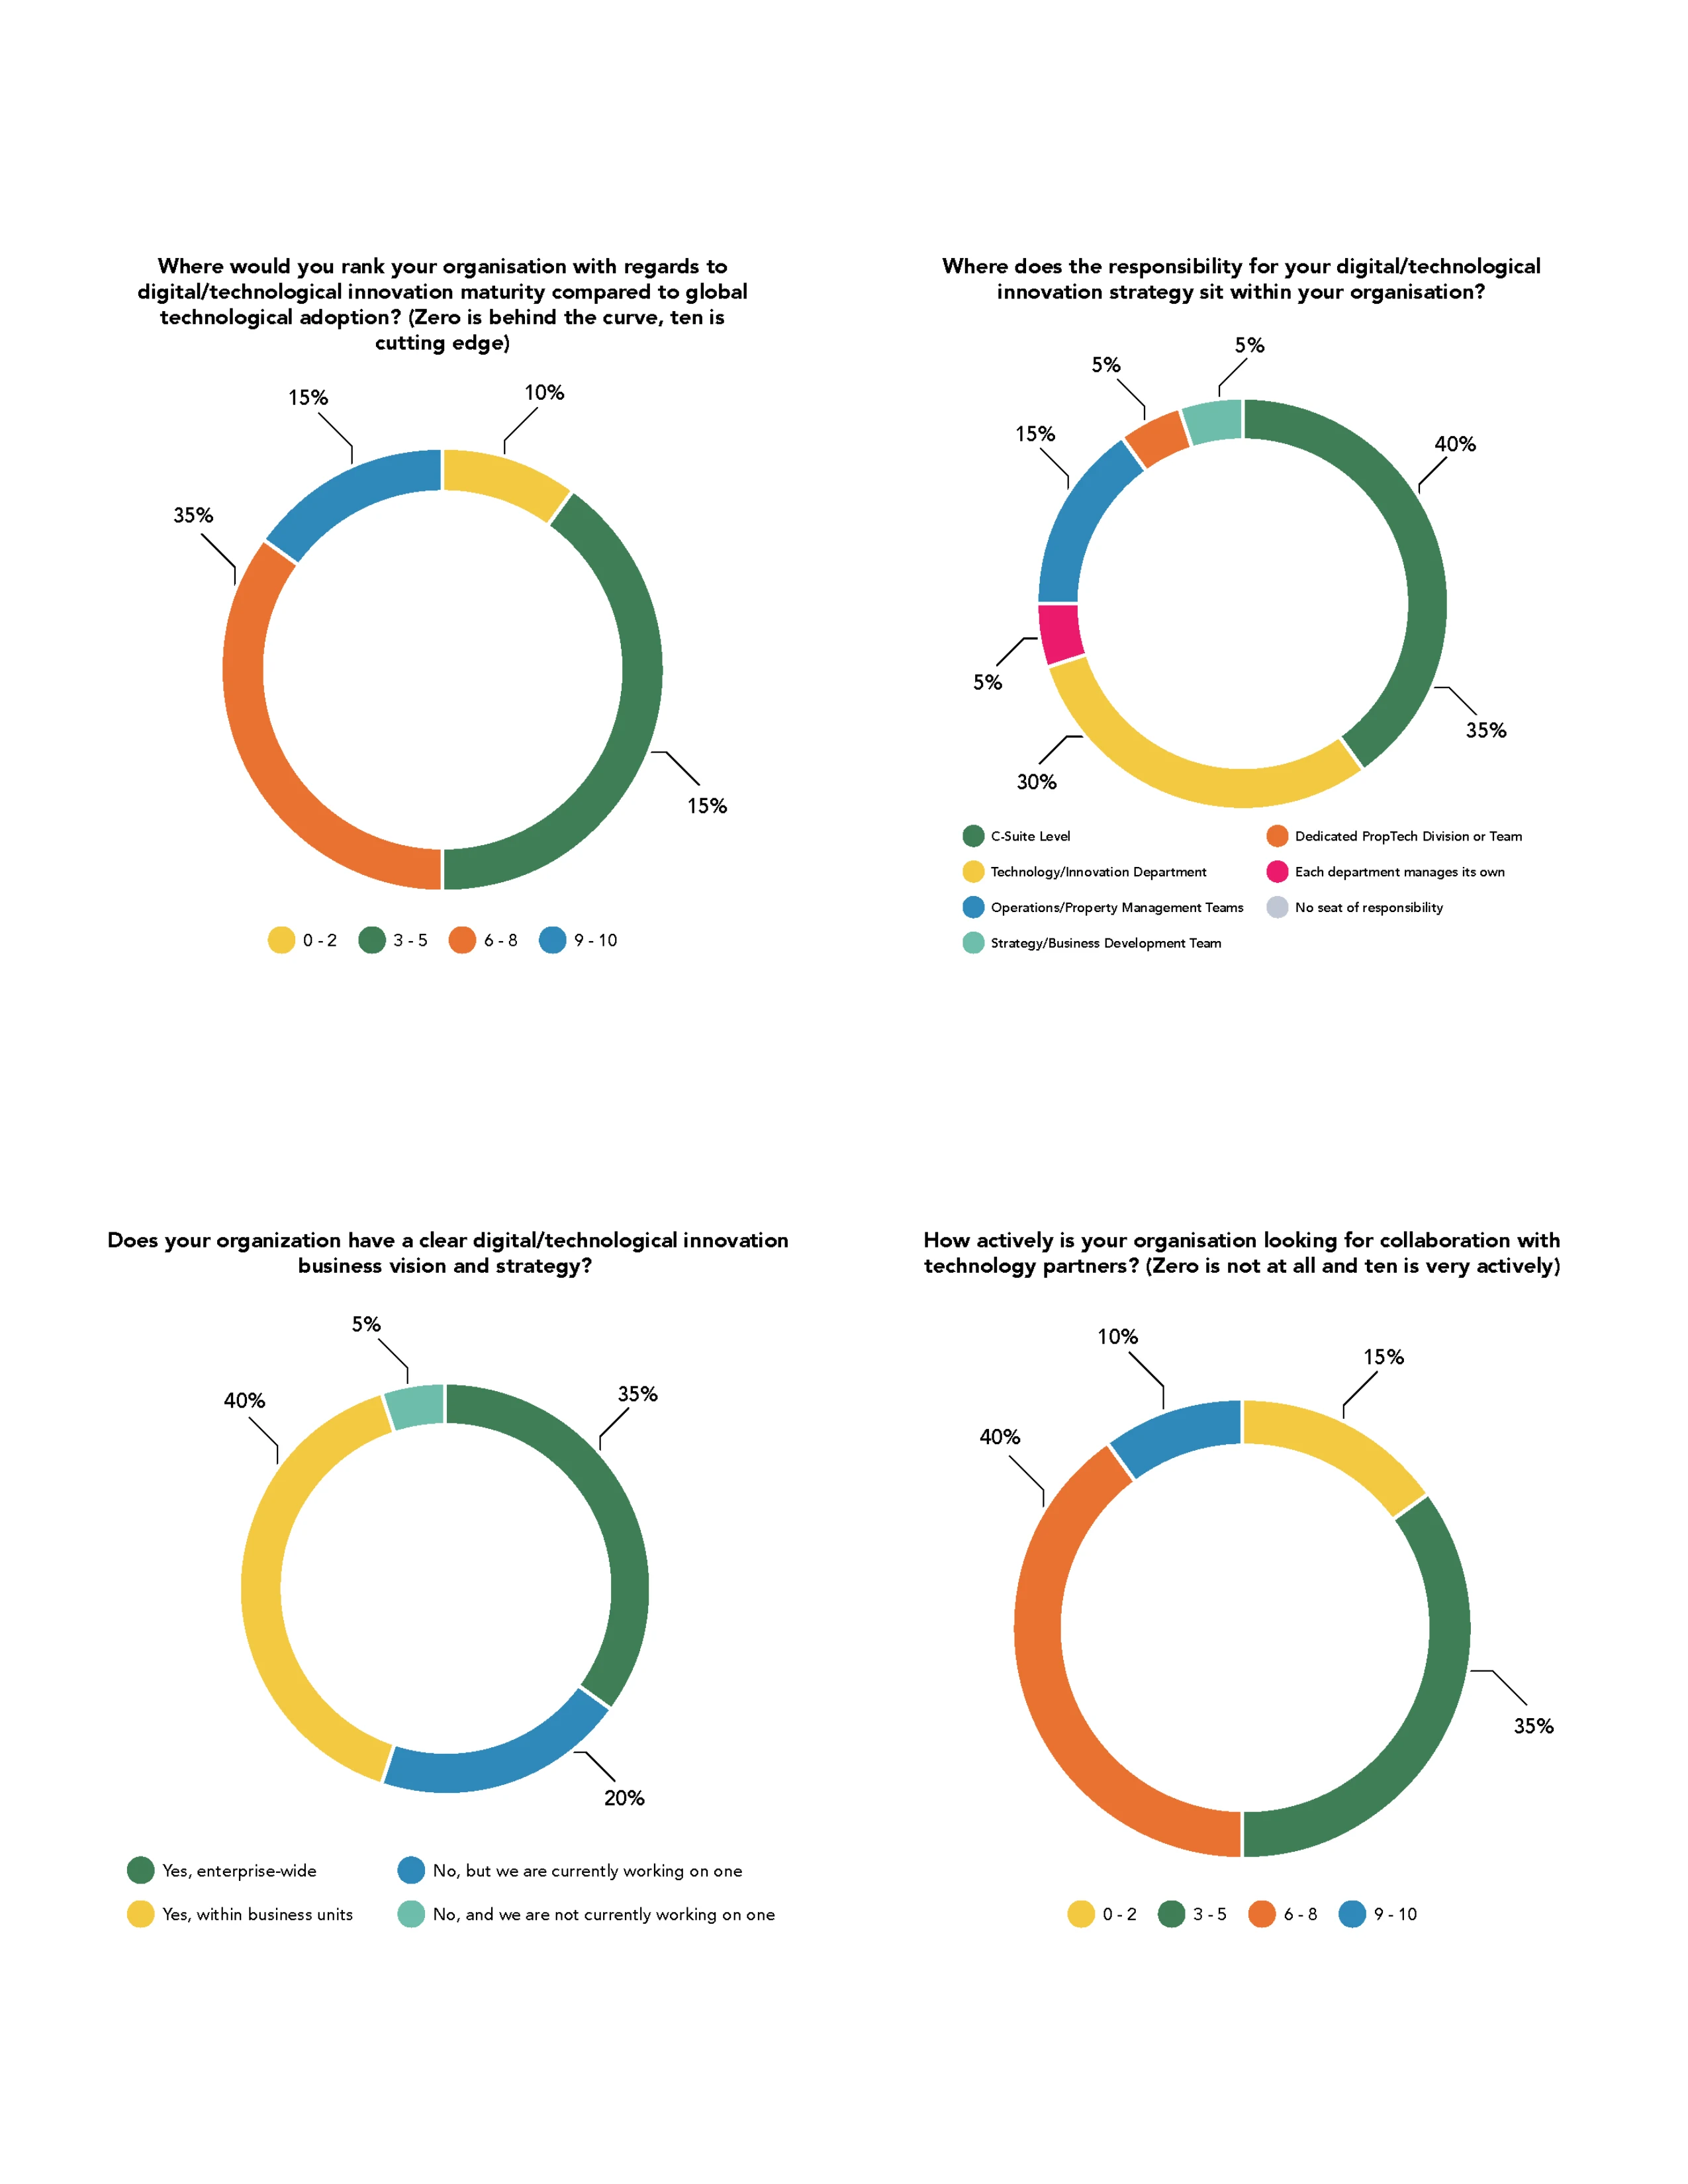
Pie Chart Visualisations
We used simple, considerately designed pie charts to visualise relevant data in an accessible and cohesive way, inline with the brand's visual identity.
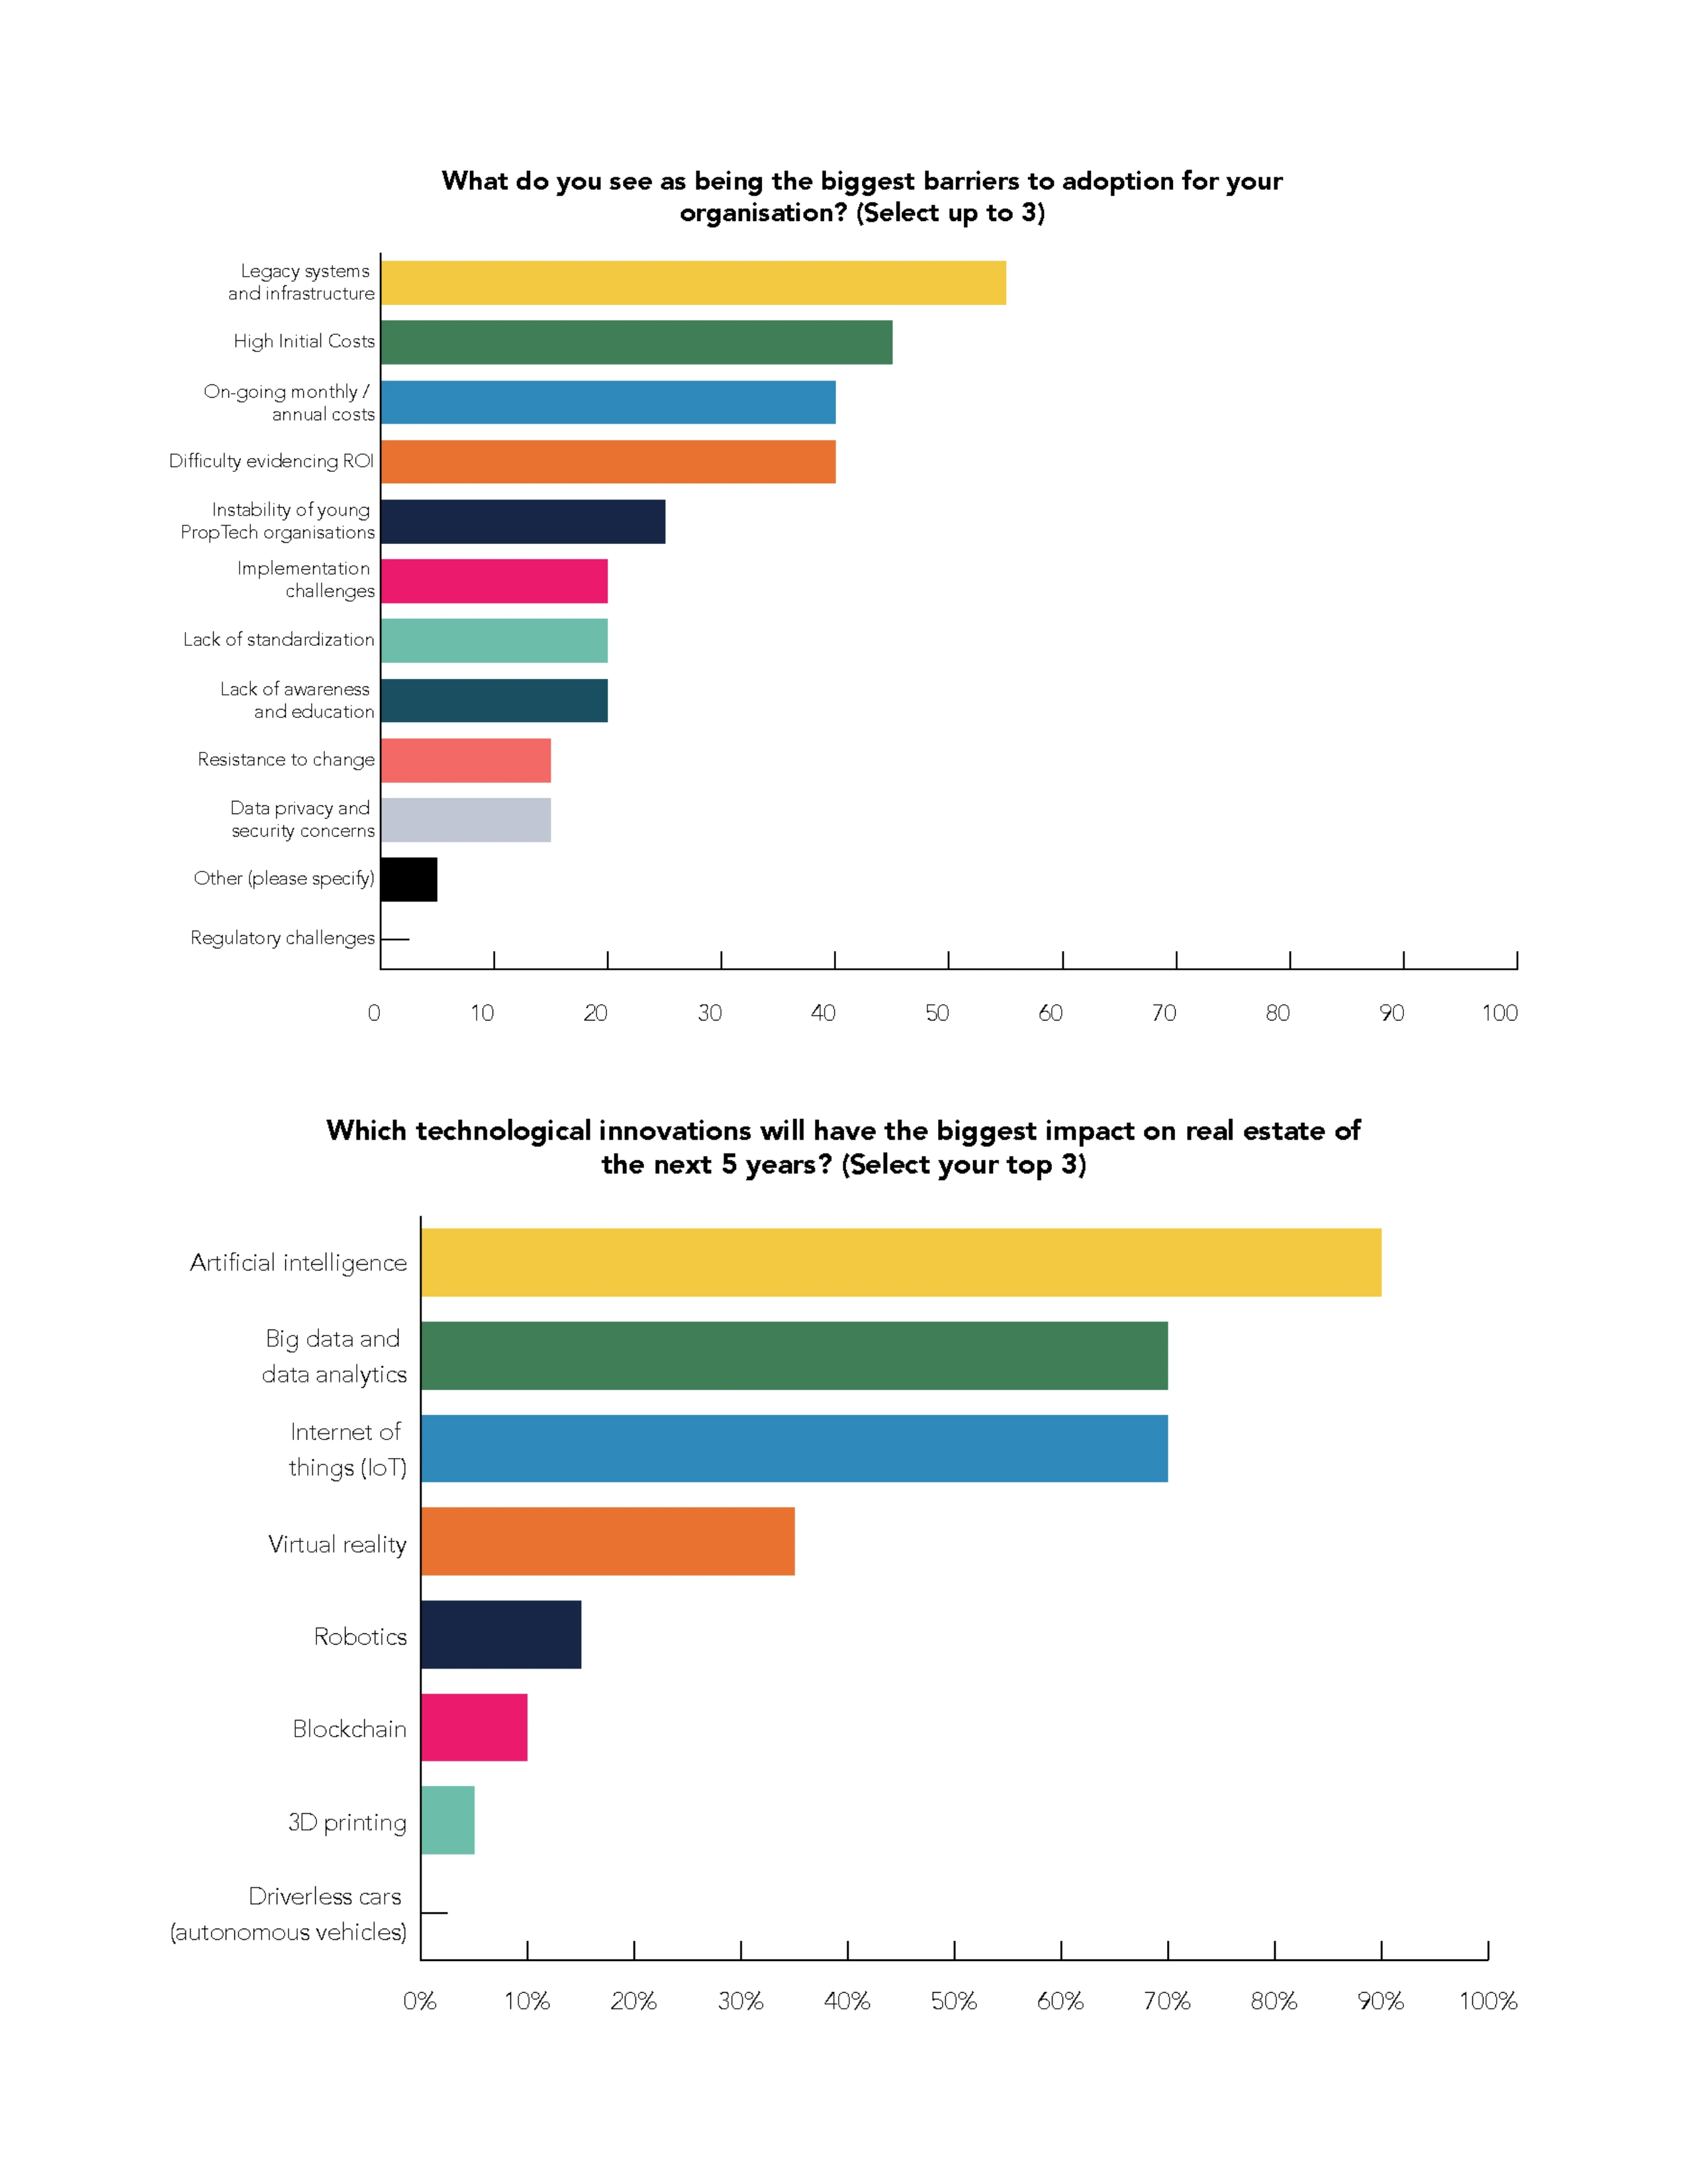
Bar Chart Visualisations
When it made sense for data to be more size-comparable, I visualised the data as branded, accessible bar charts.
Like this project
Posted Aug 2, 2024
ASK4 deliver specialist managed internet to the multi-tenant sector. I produced a number of infographics and data visualisations for their research documents.
Likes
0
Views
57
Clients
ASK4


The Unlistenables | Brand Identity
PAVOI | Social Media Content

Sugar Skull | Brand Identity Design
KEISH | Social Media Content