Survey Redesign
Overview
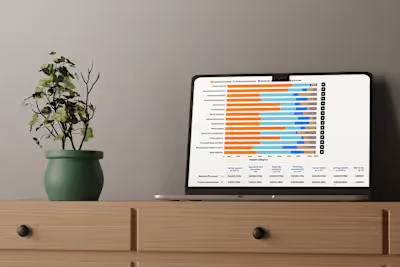
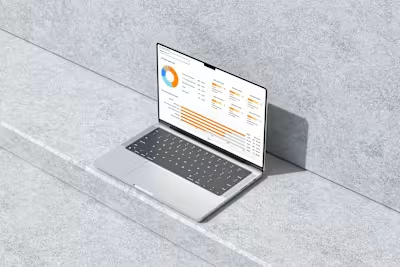
Surveys is a software tool designed to help companies assess and manage their distributors’ carbon footprints and CO2 emissions. By enabling users to create, distribute, and analyze surveys, the platform provides actionable insights to identify improvement areas, generate reports, and track progress over time. Its ultimate goal is to support companies in reducing their supply chain’s environmental impact and ensuring compliance with sustainability regulations.
However, the previous version of Surveys faced significant usability challenges that hindered user satisfaction and productivity. Users reported confusion when creating surveys, difficulties in analyzing data, and inefficiencies in generating reports. These issues made it harder for companies to achieve their environmental goals and regulatory compliance effectively.
I was tasked with redesigning the platform to address these pain points, with a focus on improving usability, enhancing functionality, and creating a seamless experience for users. The redesign aimed to simplify survey creation, streamline data visualization, and make reporting tools intuitive and actionable, ensuring Surveys could better support its users in their sustainability efforts.
Old design


Problem with existing designs
Outdated Design and Navigation:
The interface featured a linear layout for survey cards, leading to a cluttered and overwhelming user experience.
The navigation system was confusing, incorporating both a standard navigation menu and a breadcrumb trail, which often disoriented users.
Limited Reporting and Data Tracking:
Users were unable to track progress or compare data across different distributors over time, hindering effective analysis and decision-making.
Inefficient Survey Setup Process:
The process for initiating and configuring surveys did not align with user expectations, often presenting steps in an illogical order.
Surveys with multiple sections lacked clear time management cues, making it difficult for users to allocate their time effectively.
Inconsistent Instruction Page Design:
While users could create custom instruction pages, there was no control over the design, leading to inconsistencies and potential confusion.
Counterintuitive Survey Initiation:
Users were required to enter the target website for the survey before starting, a sequence that felt unnatural and counterintuitive, akin to paying for shopping before selecting items.
Engagement Issues with Survey Sections:
Survey sections displayed only the percentage of optional questions, which failed to engage users or motivate them to complete the survey.
Ambiguous ‘More’ Button Functionality:
The ‘More’ button’s functionality was inconsistent; before starting a survey, it revealed a duplicate button, and after starting, it added a share button. This inconsistency led to user confusion, as they might not realize additional options became available after initiating the survey.
Business needs
Enhance Customer Retention and Satisfaction
Problem: Frustrated users are less likely to continue using the software or recommend it to others.
Need: Improve the user experience to ensure customers find the tool intuitive, efficient, and effective.
Impact: Higher user satisfaction, increased customer retention, and positive word-of-mouth recommendations.
Expand Market Reach
Problem: Limited usability and outdated design make the product less appealing to new customers.
Need: Modernize the design and functionality to attract a broader audience, including environmentally conscious companies and large-scale distributors.
Impact: Greater market penetration and increased revenue opportunities.
Support Compliance with Environmental Regulations
Problem: Companies rely on the software to help meet sustainability goals and regulatory requirements, but limited reporting and tracking features hinder their efforts.
Need: Enhance reporting capabilities to provide clear, actionable insights and ensure users can demonstrate compliance with regulations.
Impact: Position the software as a trusted partner in environmental compliance, driving customer loyalty and trust.
Streamline Operations and Reduce Support Costs
Problem: Confusing navigation and workflows lead to increased customer support requests and training needs.
Need: Redesign the interface and workflows to minimize user confusion and errors, reducing dependency on customer support.
Impact: Lower operational costs and improved scalability for the business.
Differentiate from Competitors
Problem: The software risks falling behind competitors offering more user-friendly and advanced features.
Need: Deliver a redesigned product with standout features, such as intuitive navigation, engaging survey completion, and robust progress tracking.
Impact: Strengthen competitive advantage and establish the software as a leader in sustainability tools.
Drive Revenue Growth
Problem: Limited functionality and poor usability reduce the software’s value proposition.
Need: Add features like enhanced progress tracking, better survey setup workflows, and advanced data visualization tools to justify subscription or licensing costs.
Impact: Increased willingness to pay among customers and higher revenue from renewals or upgrades.
Align Product with Sustainability Goals
Problem: Companies are under increasing pressure to reduce their environmental impact, and they need tools that make this process easier and more effective.
Need: Ensure the software actively supports sustainability efforts by simplifying carbon footprint assessments and identifying actionable improvements.
Impact: Build a reputation as a vital tool for companies focused on sustainability, strengthening the brand’s mission and market relevance.
User needs
An intuitive and logical workflow for starting and setting up surveys.
Progress indicators that motivate and guide users through the survey completion process.
A simplified and cohesive navigation system that avoids redundancy and confusion.
Easy-to-generate reports with actionable insights, clear visualizations, and historical data for comparison.
Tools to track progress over time and compare data across different distributors or periods.
Control over the design of custom instruction pages to ensure clarity and consistency.
A smooth and logical process for survey participants to start and complete surveys without unnecessary steps.
Buttons with predictable and consistent functionality to avoid confusion.
Clear visual indicators for optional and required questions in survey sections.
A fast and seamless process from survey setup to submission with minimal friction.
User interviews
We conducted one-on-one interviews with current users of Surveys to gather feedback on the areas for improvement.
Interview Questions:
Can you describe your overall experience using Surveys?
What specific challenges or frustrations have you encountered while using the software?
Are there any features or capabilities you feel are missing that would make the software more valuable to you?
How do you currently measure and track the environmental performance of your distributors?
What methods do you use to identify areas for improvement in your distributors’ environmental performance?
How important are ease of use and efficiency in the software tools you rely on for your work?
Have you faced any challenges when sharing or collaborating on survey results with your team or other stakeholders? If so, can you elaborate?
Key outcomes from interviews
Understanding Pain Points
Clear identification of the challenges users face with the current software, such as:
Difficulty navigating the system.
Inefficient survey setup workflows.
Frustration with limited reporting capabilities.
Lack of tools for tracking progress or comparing distributor data over time.
Prioritization of Features
A prioritized list of features or enhancements users want to see in the redesigned software, such as:
Intuitive dashboards for data visualization and reporting.
Improved collaboration tools for sharing survey results.
Simplified and flexible survey setup options.
Validation of Design Goals
Confirmation that key redesign objectives align with user expectations:
Ease of use and efficiency as top priorities.
The need for actionable insights to support sustainability efforts.
Insights into Current Workflows
A better understanding of how users currently measure and track the environmental performance of their distributors:
Common tools or methods they use.
Challenges in integrating these processes with the current software.
Specific Usability Challenges
Detailed feedback on what users find confusing or inefficient, such as:
Redundant navigation menus.
Unclear instructions or progress indicators.
Misalignment of survey setup workflows with user expectations.
User Collaboration Needs
Insights into how users collaborate and share survey results with their teams or stakeholders:
Pain points in the sharing process.
Desired features for improving collaboration (e.g., role-based access, comment systems, or automated report sharing).
Benchmarking Success
User-defined criteria for what a successful redesign would look like, such as:
Faster survey setup and distribution.
Clearer, more engaging interfaces.
Reduced effort in analyzing and reporting data.
User Expectations for Sustainability Tracking
Specific needs related to tracking and improving distributors’ environmental performance:
How users define “improvement areas.”
Preferred metrics or visualizations for tracking progress over time.
User persona
Name: Rachel Carter
Age: 38
Occupation: Sustainability Manager at a multinational company
Location: Urban area with a large distributor network across multiple regions
Education: Master’s degree in Environmental Science
Tech Proficiency: Moderate to high; comfortable with data analysis and reporting tools but prefers intuitive interfaces.
Goals
Efficient Survey Setup:
Quickly create and distribute surveys to distributors with minimal back-and-forth.
Accurate Data Analysis:
Easily compare performance across distributors and identify high-impact improvement areas.
Seamless Reporting:
Generate visually clear and actionable reports for internal and external stakeholders.
Progress Tracking:
Monitor and communicate progress toward sustainability goals over time.
Regulatory Compliance:
Ensure the supply chain meets all environmental regulations without manual tracking.
Pain Points
Struggles with inefficient survey setup workflows that feel cumbersome and time-consuming.
Finds it difficult to track progress or compare data across different time periods.
Reporting tools are too rigid, requiring additional manual effort to create usable reports.
Confusion caused by inconsistent navigation and unclear workflows in the current system.
Collaboration with team members and stakeholders is hindered by limited sharing options.
Motivations
Achieving tangible sustainability results that align with company goals and values.
Streamlining processes to save time and reduce operational friction.
Gaining trust and buy-in from leadership through clear, actionable reporting.
Enhancing collaboration with distributors to drive measurable improvements.
User scenario
Rachel needs to create a survey to gather data on CO2 emissions from 50 distributors. She has one week to analyze the data, identify top improvement areas, and prepare a presentation for the executive team. She expects the software to guide her through setup efficiently, help her compare performance metrics across distributors, and deliver a visually compelling report to support her recommendations.
User flow

Low fidelity design
Designing the surveys to align with the business’s requirements while incorporating user needs required extensive collaboration, involving multiple meetings over a two-month period. After numerous iterations and adjustments based on feedback, we finalized the layout and design. The result is a solution that effectively addresses both business goals and user expectations.

When setting up a survey, the user is prompted to first provide a name for the survey, assign it to a specific user, and add an introductory message. Next, the user selects a start date and end date for when the survey will be active. Finally, if desired, the user can upload images to customize the introductory page.
The introductory page allows the survey creator to include an unlimited amount of information, providing flexibility to convey all necessary details about the survey. When a participant starts the survey, they are first directed to the introductory page, which informs them about the survey’s purpose and any specific data they may need to prepare to answer certain questions.
Once a survey has been assigned to a user, they can begin it immediately. If the survey needs to be reassigned to someone else for data input, the process has been streamlined. Instead of clicking multiple buttons, the user can now simply use a dropdown menu to select from a list of users assigned to their account. They can easily send the survey to anyone within their organization. The card also displays the information the original user entered during setup. Additionally, from the dashboard, users have the option to create a new survey if needed.
Surveys can include multiple sections, allowing questions to be organized into manageable groups. This separation ensures that users are not overwhelmed by having to navigate through hundreds of questions at once. A key challenge previously identified was that users often failed to complete surveys before the deadline. To address this, the deadline date is prominently highlighted at the top of the survey. As the deadline approaches, this visual cue draws the user’s attention and encourages them to complete the survey on time.

Once the user enters a section of the survey, they can respond to various types of questions, including single-input fields, radio buttons, checkboxes, descriptive text fields, date selectors, or measurement inputs, depending on the survey’s requirements. After answering all the questions in a section, the user has the option to save and continue to the next section or navigate to the report page to print the survey questions if needed.
When setting up a survey, users can add as many questions as they like. Upon clicking to add a new question, a dialog box appears, prompting them to select the type of question they want to create. For example:
If the question is a radio button or checkbox, the user must input the available options.
If the question is a description field, they only need to enter the question text.
Once the question is created, the user can choose to save it or cancel, which will discard any changes made.
Final designs


Conclusion
The redesign of the Surveys software successfully addressed critical usability and functionality challenges, resulting in a more intuitive and efficient user experience. By incorporating user feedback and aligning with business goals, the new design enables users to seamlessly create, distribute, and analyze surveys while improving their ability to track progress and generate actionable insights.
Key features such as streamlined survey setup workflows, enhanced reporting capabilities, and engaging progress indicators have significantly improved user satisfaction and productivity. The updated interface not only simplifies complex tasks but also encourages timely survey completion, ultimately supporting businesses in reducing their environmental impact and meeting regulatory compliance.
This project demonstrates the value of a user-centered design approach, where continuous collaboration, iterative testing, and alignment with real-world workflows drive measurable outcomes. The redesigned Surveys software is now a powerful tool that empowers organizations to make data-driven decisions for a more sustainable future.
Like this project
Posted Nov 25, 2024
Surveys is a software tool that helps companies manage distributors’ carbon footprints and CO2 emissions by creating, distributing, and analyzing surveys.
Likes
0
Views
0


