Portfolio Report design
Overview
The LCA calculator’s goal is to launch by the end of September 2024. To achieve this, the portfolio section is the only flow that is still missing from the basic tool.
The requirements for this include creating a portfolio view where clients can consolidate all of their assessments into a single portfolio, if needed, and observe how this impacts the overall valuation when combining all of their products together.

Business requirements
Comprehensive Environmental Footprint Analysis:
The system must generate portfolio reports that provide a detailed and comprehensive view of the collective environmental footprint across all products and processes within the portfolio.
Impact Identification:
The system must have the capability to identify and highlight products or processes within the portfolio that contribute most significantly to the overall environmental impact. This should assist in prioritizing areas for improvement.
Improvement Focus:
The system must enable organizations to focus their efforts on areas with the greatest potential for environmental impact reduction, based on the insights provided by the portfolio reports.
Performance Measurement:
The system must measure the performance of the portfolio against relevant industry standards and regulatory requirements, providing benchmarks for comparison.
Progress Tracking:
The system must facilitate the tracking of progress over time by comparing current and historical portfolio performance, allowing organizations to monitor improvements and ensure ongoing compliance with industry standards and regulations.
User goals
Understand Environmental Impact:
Users aim to gain a clear understanding of the overall environmental impact of the products or processes within their portfolio. This includes identifying the most significant contributors to the portfolio’s footprint.
Prioritize Improvement Efforts:
Users seek to identify which areas or products within the portfolio require the most attention for reducing environmental impact, helping them focus their resources on initiatives that will have the greatest effect.
Ensure Compliance:
Users want to ensure that their portfolio meets or exceeds industry standards and regulatory requirements. This includes monitoring compliance and making necessary adjustments to maintain or improve their standing.
Communicate with Stakeholders:
Users need to communicate the environmental performance of their portfolio to various stakeholders, including management, investors, customers, and regulatory bodies. Clear and concise reports that illustrate the portfolio’s impact and improvements are essential for this purpose.
Support Strategic Decision-Making:
Users aim to use the insights from the portfolio reports to inform strategic decisions, such as product development, process optimization, or investment in sustainability initiatives. The goal is to align business practices with environmental goals.
Competitor research
Since this feature is part of the LCA Calculator, additional competitive research was unnecessary, as it was already conducted during the development of the assessment setup for the tool
Ecochain Helix
Ecochain Helix is aimed at manufacturing companies to measure and improve the environmental footprint of large-scale production facilities and product portfolios. It is best for experienced LCA practitioners and offers support for bulk LCA creation and environmental performance dashboards.
Sphera GaBi
Sphera GaBi is a well-established LCA tool known for its extensive capabilities and suitability for LCA experts. It provides comprehensive tools for sustainable product development and supports various standards for LCA, life cycle costing, and reporting. GaBi is particularly favoured in its home market of Germany and offers numerous add-ons for detailed analyses.
OneClickLCA
OneClickLCA is specialized for the construction industry, providing tailored functionalities for building materials and construction projects. It supports certifications like LEED, DGNB, and BREEAM, making it a strong choice for experienced practitioners in the construction sector. The tool excels in modelling, reporting, and analysing the environmental impact of construction activities.
OpenLCA
OpenLCA is a free, open-source LCA software suitable for users with a technical background. It offers deep-dive functionalities, including the ability to adjust LCI datasets to match specific production processes. OpenLCA is versatile and allows for extensive environmental impact assessments, making it a good option for those seeking a cost-effective solution.
Empathy map

Problem Statement
Clients using the LCA Calculator currently lack a way to consolidate multiple assessments into a single portfolio, limiting their ability to analyze the cumulative impact and valuation of their products as a whole. This gap makes it challenging to gain a holistic understanding of their portfolio’s overall performance, hindering data-driven decision-making and strategic planning. A solution is needed to enable seamless aggregation and comprehensive analysis to better support client objectives.
User Persona
Profile
Name: Emily Thompson
Role: Sustainability Manager
Industry: Consumer Goods
Age: 38
Location: Seattle, WA
Experience: 10+ years in sustainability and corporate responsibility
Background
Emily works for a mid-sized consumer goods company that prioritizes sustainable practices. She oversees the company’s life cycle assessments (LCAs) to ensure compliance with environmental standards and to identify opportunities for reducing their environmental impact. Emily frequently collaborates with product managers, supply chain teams, and external auditors.
Goals
Holistic Insights: Understand the environmental impact of the entire product portfolio, not just individual products.
Streamlined Workflow: Minimize time spent consolidating reports from multiple assessments.
Actionable Data: Leverage aggregated data to inform sustainability strategies and share insights with stakeholders.
Frustrations
Manual effort required to combine individual assessments into a portfolio for comprehensive analysis.
Difficulty communicating the cumulative environmental impact to non-technical stakeholders.
Limited tools for visualizing and comparing combined data across the product range.
Needs
A tool that enables her to consolidate multiple assessments into a single, cohesive portfolio.
Clear, user-friendly visualizations and insights that can be shared with both technical and non-technical audiences.
Features that support quick analysis of overall product portfolio performance.
Behaviour
Tech-Savvy: Comfortable using digital tools but values intuitive and efficient interfaces.
Data-Driven: Relies heavily on accurate data for reporting and strategy development.
Collaborative: Often shares findings and insights with cross-functional teams and senior management.
User flow
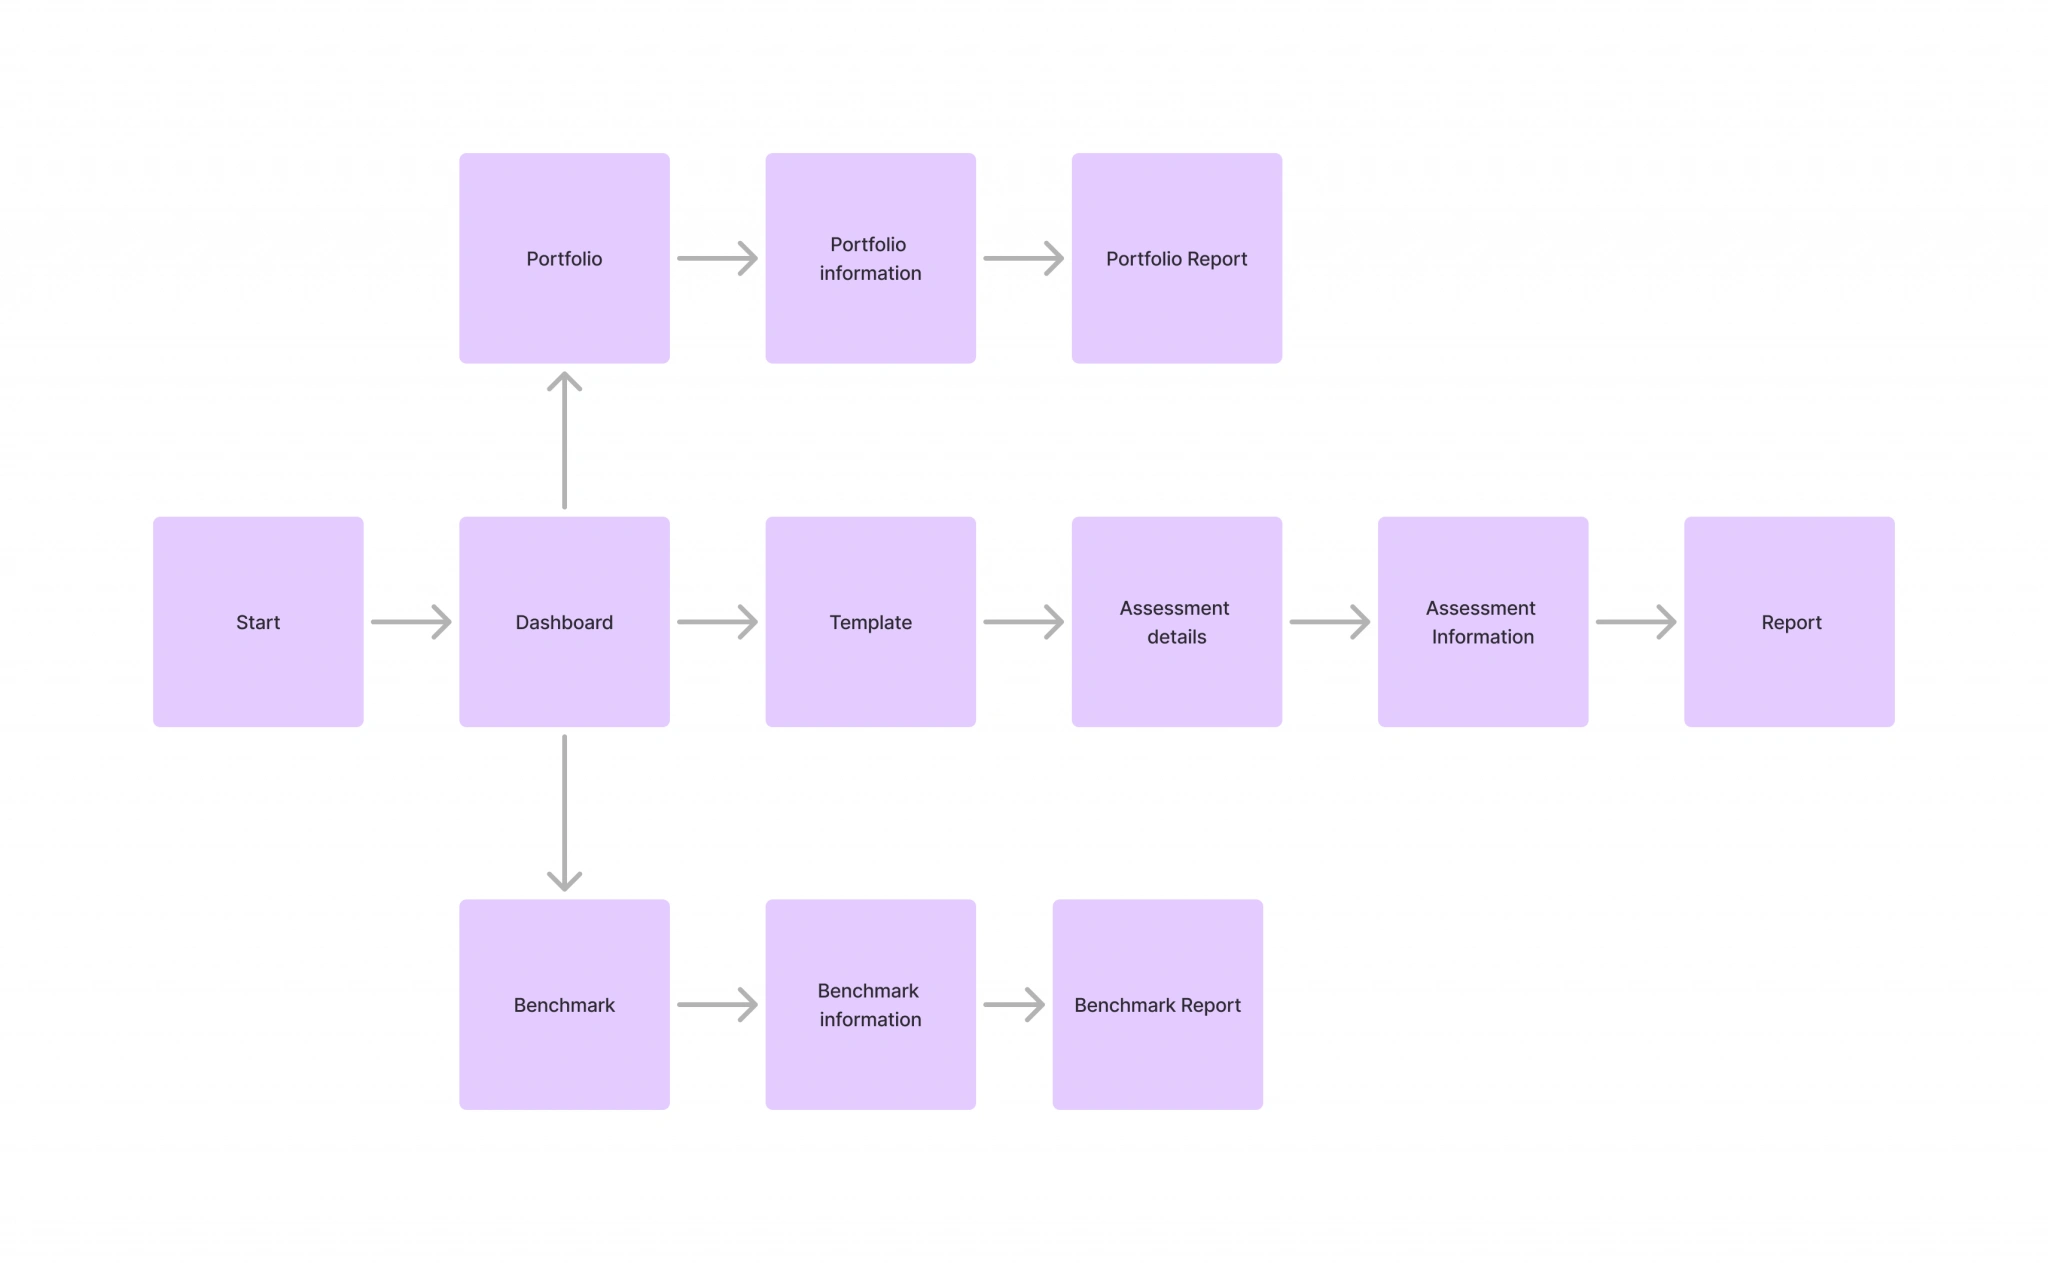
The setup process for Portfolio Pro should follow the same steps used for setting up individual assessments since the portfolio feature is fundamentally about combining those assessments. The goal is to use the same framework so that if a user knows how to set up an assessment, they can easily set up a portfolio. Since a portfolio requires completed assessments, it’s essential that users can successfully complete assessments before creating a portfolio. Given that users are already familiar with the flow and steps involved in setting up an assessment, it makes sense to replicate that exact process for creating a portfolio.
Design
After establishing user flows, I conducted ideation workshops to explore page design, functionality, and content. Collaborating closely with the Development team, we ensured ideas were technically feasible within the existing technology stack or brainstormed “how might we” solutions to overcome any potential limitations.
The workshop primarily focused on defining the requirements for the portfolio report. Within the first 10 minutes, it became evident that a one-size-fits-all approach wouldn’t work—different claims required different chart types. Recognizing this, I decided to pivot, splitting the portfolio report development into a Minimum Viable Product (MVP) with future updates planned to enhance functionality over time.
Workshop
To streamline the MVP, I asked participants to identify the essential charts needed. We approached the design like a newspaper, prioritizing the “headline” or most important chart at the top. Consensus was reached to feature life cycle stages prominently, displaying both percentages and absolute numbers.
We then prioritized additional charts for the MVP, starting with:
Materials used across all assessments.
Sales by country.
Production by country.
Impact by supplier.
Impact by business unit.
Impact by brand.
For the “impact by brand” chart, flexibility was key—its data could vary depending on the tags applied to assessments. Regardless of the specific tag groups, the data presentation would remain consistent across charts.
One chart, “transport progression over time,” was discussed but deferred. Given the project’s launch timeline (end of September 2024), tracking progression over such a short period would not provide meaningful insights. Typically, this metric requires years of data to reflect changes in materials and transport trends.
The MVP charts are designed to meet most client needs, with future updates planned to introduce more customizable charts. This customization will allow clients to toggle charts on or off, tailoring reports to align with their organization’s specific goals and objectives.
Low fidelity design
The portfolio Dashboard: The dashboard for the portfolio view shares the same layout as the assessment view. This consistency is intentional; if users are familiar with navigating the assessment flow, they will easily understand how to access the portfolio view. Since building a portfolio requires completed assessments, users can be confident that they will be able to create a portfolio, as it’s impossible to do so without having assessments in place.
Adding assessments to your portfolio:
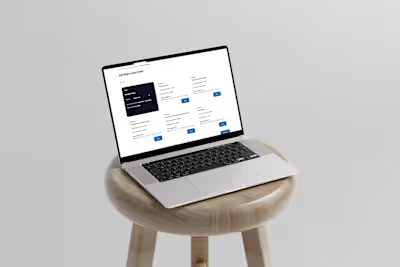
When adding assessments to your portfolio, the process mirrors setting up an assessment. You�’ll need to provide your portfolio with a name and a description. If you wish, you can upload an image. If you choose not to upload an image, we will use the image from the first assessment you add to your portfolio. If none of the assessments have an image, we’ll use the default image from the first assessment.
Transferring your assessments into the portfolio is straightforward. You can filter assessments by the tags you’ve applied to them. Once you’ve selected a filter (if you choose to apply one), simply select the assessments associated with that tag and transfer them into the target box on the right side of the page. If you accidentally transfer the wrong assessment, you can easily move it back to the source, and it won’t be included in your portfolio.
If you don’t apply a filter, you can transfer all your assessments into one portfolio, helping you consolidate your work effectively.

For the main assessment page:
In the final design, I moved the impact categories to the right-hand side to improve the layout. Previously, they were on the left under the portfolio name, which required users to scroll down further to access the content. By relocating them to the right, users can view the content immediately without extensive scrolling. The default impact category will be set to “Carbon” as it is the most frequently viewed category.
The main chart for the portfolio displays the life cycle stages, allowing users to see the impact across their entire portfolio. This view helps identify which life cycle stage has the most significant impact. The chart shows both the percentage and absolute numbers, allowing users to compare these values in a single view rather than using two separate charts.
The six boxes on the right-hand side display the different tags applied within the portfolio. These tags can indicate whether their associated values are positive or negative, depending on how the user has configured them.
The next section of the portfolio focuses on the impact of materials used. It shows the materials across the entire portfolio, including their weight, the percentage they contribute to the portfolio, and their absolute numbers. This chart highlights the material with the most significant impact, allowing users to consider changes. The weight metric helps determine whether the material’s contribution is due to its volume.
The following section covers sales and production countries. Sales and production locations might differ; for example, you might purchase materials from China but sell the products in the U.S. Displaying these locations side by side allows for beneficial comparisons, potentially revealing opportunities to enter new markets.
Next is the “Impact by Supplier” chart, where users can identify which supplier has the most significant environmental impact within their portfolio. This insight might prompt users to consider switching to a supplier with a better environmental record. The chart shows the percentage and absolute contribution of each supplier to the company.
The final two charts focus on business units and brands, which are the primary tags applied to the portfolio. For business units, users can see how sales by country relate to specific business units and determine if changes to products or suppliers would reduce environmental impact. The “Impact by Brands” chart shows which brand has the most significant environmental impact, guiding users to consider changes in their manufacturing processes.
Additional charts can be included as needed. However, clients can choose to turn these charts on or off based on the portfolio’s requirements.
Final Designs


Conclusion
On the client feedback from clients, I believe the portfolio report design went very well. Moving forward, the key areas we should focus on include adding transport modes, implementing progress tracking, and enhancing the customization options for the portfolio. These features will be significant advantages as we continue to develop the tool. However, due to time constraints, we were unable to include them in the MVP if we want to meet the September launch deadline for Portfolio Pro.
Copyright © UX designer Paul James 2024
Like this project
Posted Nov 25, 2024
Clients using the LCA Calculator currently lack a way to consolidate multiple assessments into a single portfolio


