Paid media expert scaling SaaS, e-com & B2B
Pitch Deck & Presentation Expert


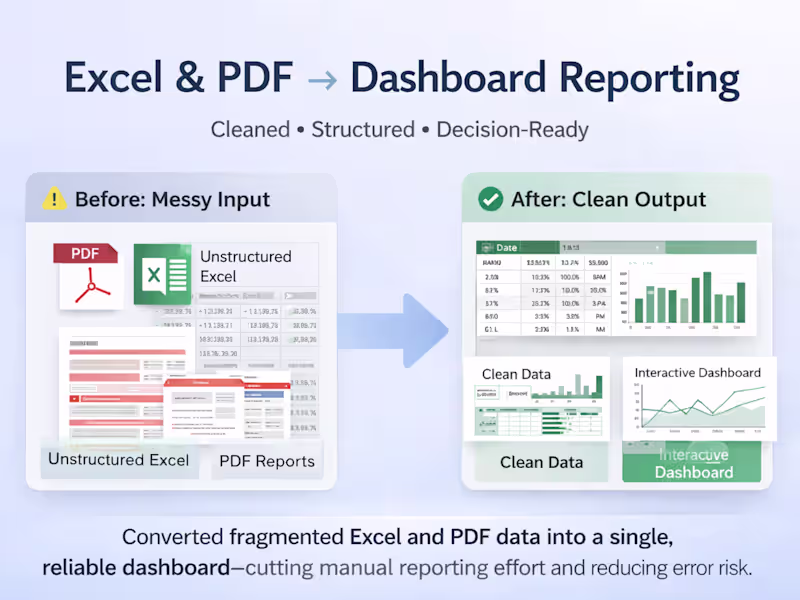
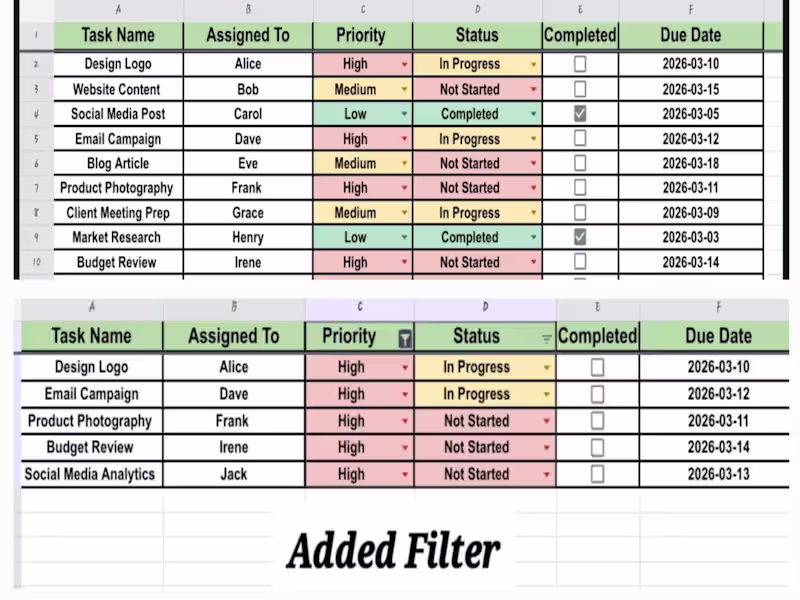
Excel & KPI Dashboards for Small Business Decisions
- 101
- Followers
Excel & KPI Dashboards for Small Business Decisions
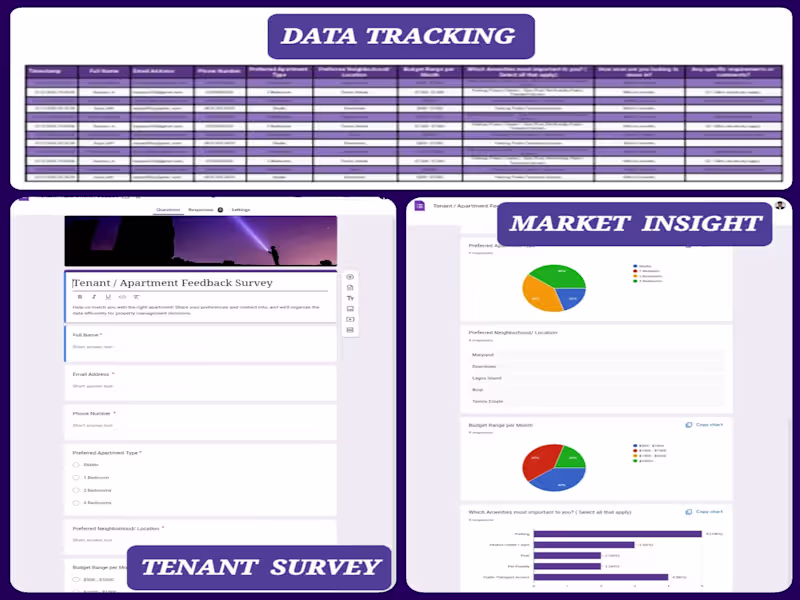
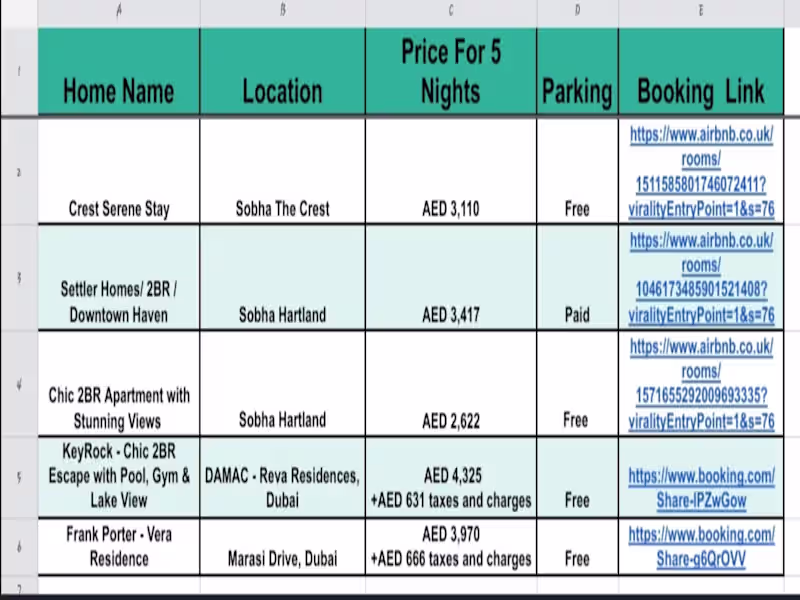
Operations & Systems Support for Airbnb Hosts & Businesses
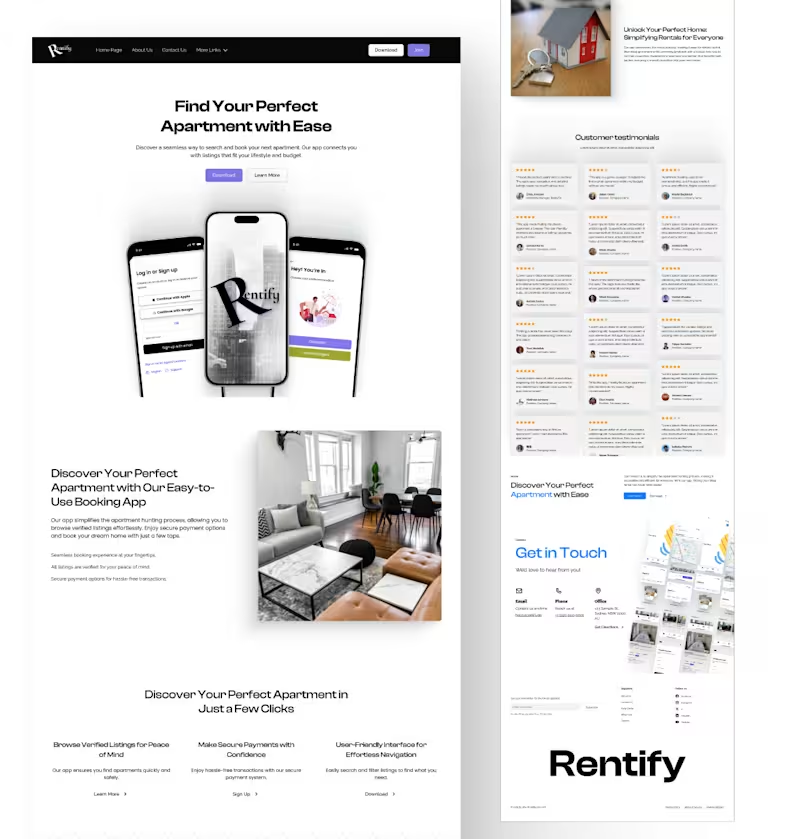
UI Designer | Aspiring Data Analyst
UI Designer | Aspiring Data Analyst
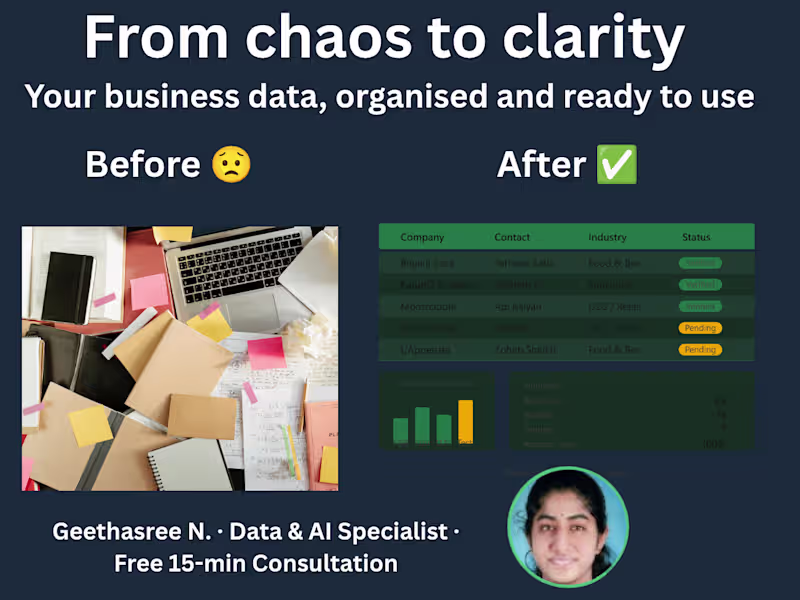
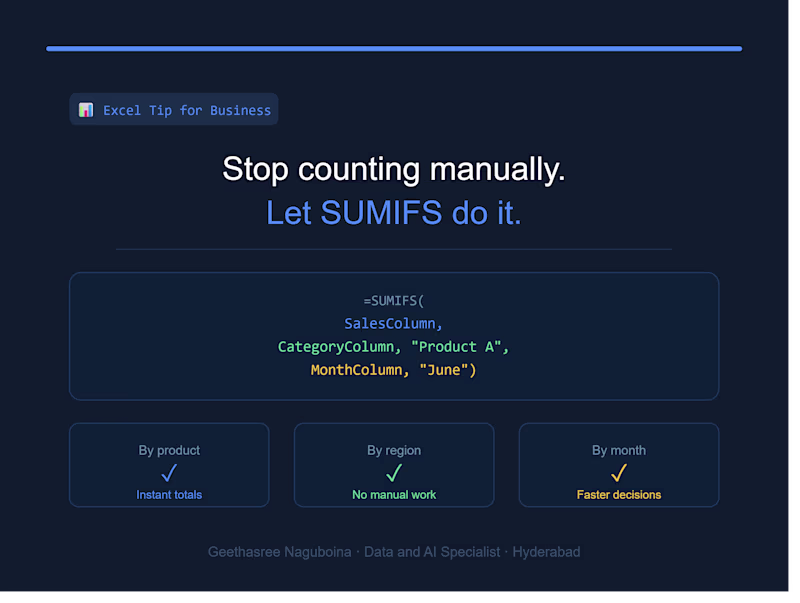
Helping teams leverage data and AI-driven solutions to solve
Helping teams leverage data and AI-driven solutions to solve

View more →
CS Alumna from Rutgers University
CS Alumna from Rutgers University

View more →
Building AI agents & apps · MSc Queen Mary of London