Bike Buyers Data Analysis and Dashboard Creation
Victor Akehinmi
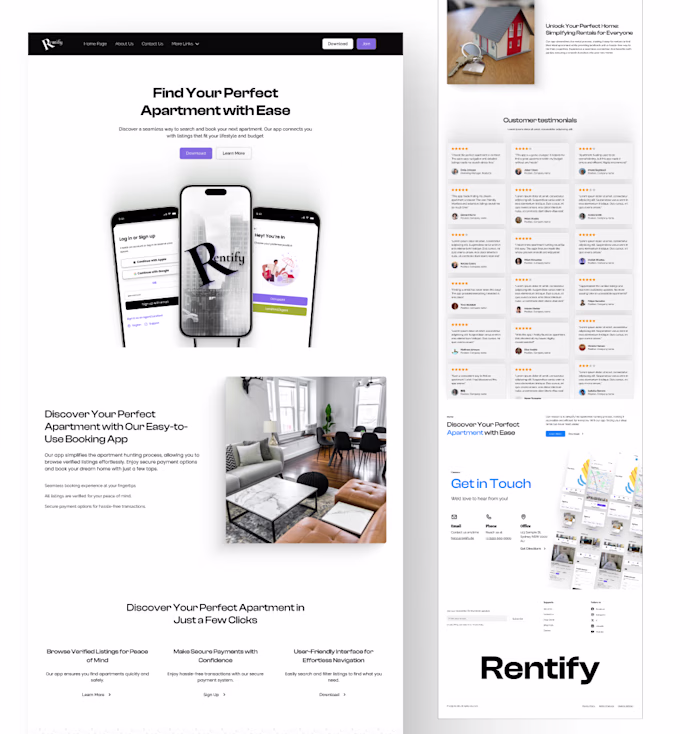
Bike-Buyers-Data-Analysis-Project
Excel & Data Analytics Project
Executive Summary
Business Problem:
A retail company selling bikes wants to understand the key factors influencing bike purchases. They have a dataset of customer demographics, income, commute distance, and lifestyle attributes but lack clear insights into who their target customers are and how to improve bike sales.
Solution:
Performed a full data analysis in Excel — from data cleaning and exploration to building an interactive dashboard that visualizes customer profiles, regional performance, and purchase patterns. The dashboard helps stakeholders quickly identify the ideal customer profile (ICP) and make data-driven marketing decisions.
Impact:
Improved understanding of customer demographics by visualizing key buying patterns.
Identified regions and customer groups with the highest purchase potential.
Built a reusable Excel dashboard template that updates automatically with new data.
Next Steps:
Extend the project using SQL or Python for deeper analysis.
Build a Power BI / Tableau version for dynamic business reporting.
Business Problem
The company has observed fluctuating sales performance across regions and demographics. Management needs answers to questions such as:
Who is more likely to buy a bike — by gender, income, age, or region?
How does car ownership or commute distance affect bike purchases?
What is the average income and age of bike buyers vs. non-buyers?
Which regions or customer types should be targeted for better sales?
Without this knowledge, marketing campaigns and sales strategies remain broad and inefficient.
Methodology
Data Collection
Source: “Bike Buyers Dataset” (provided as an Excel file).
Contains demographic, lifestyle, and purchasing information.
Data Cleaning
Removed duplicates and standardized text fields.
Fixed categorical inconsistencies (“M/F”, “Yes/No”).
Verified numeric columns (Income, Age, Cars).
Exploratory Data Analysis (EDA)
Analyzed trends using Excel formulas, filters, and PivotTables.
Visualized insights using Pie, Bar, Column, and Line charts.
Built Key Performance Indicators (KPIs) for total income, purchase rate, and averages.
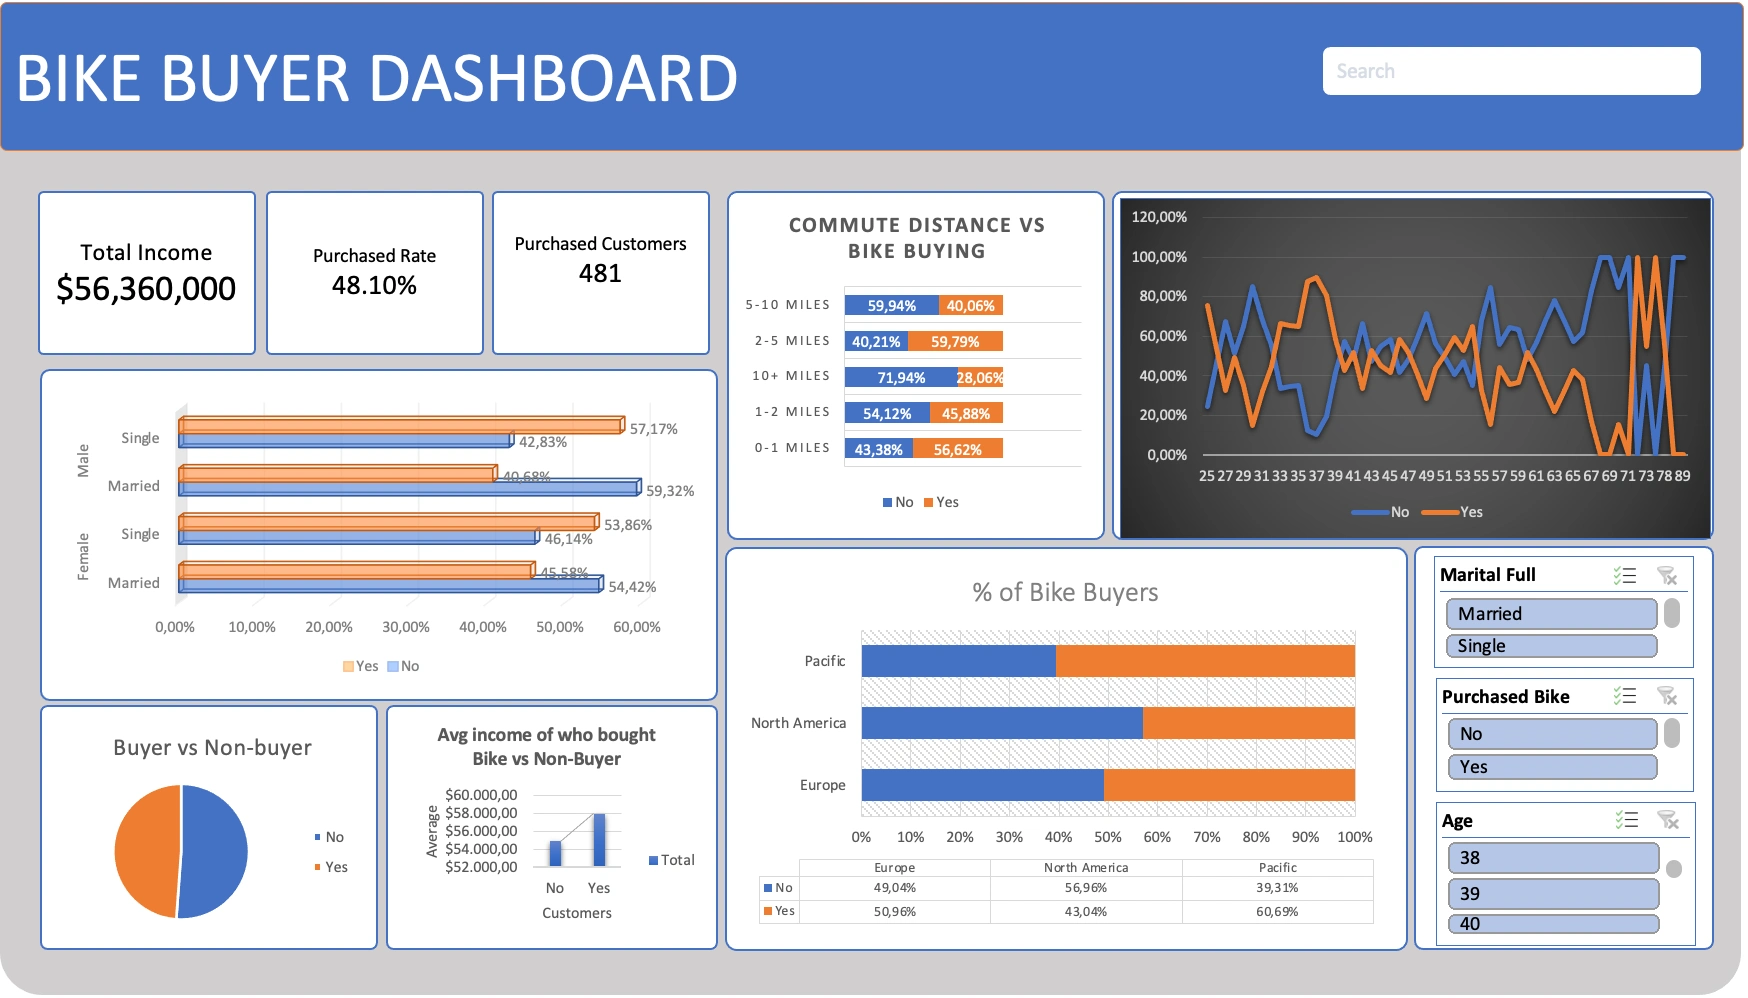
Dashboard Design
Professional theme for business readability.
Interactive slicers for filtering by Gender, Region, and Education.
KPI Cards + Charts:
Pie: Purchase % Overall
Bar: Purchases by Region
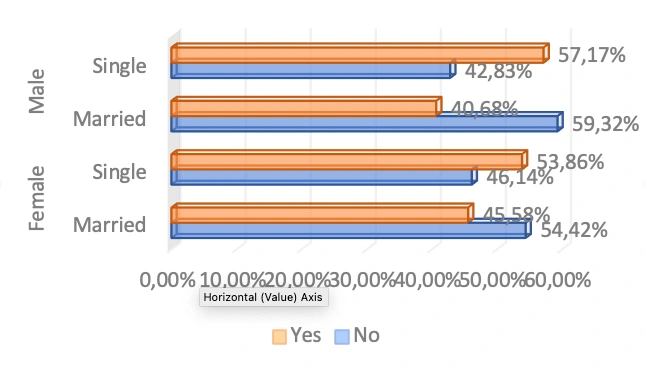
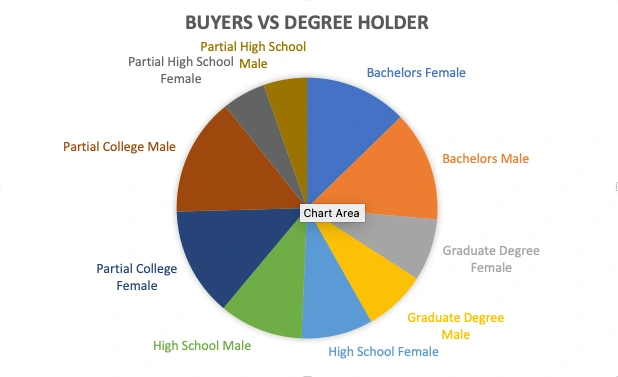
Column: Purchases by Education or Gender
Line: Cars vs. Purchase %
Skills & Tools Used
Data Analysis Skills
Data Cleaning
Data Aggregation (AVERAGEIFS, COUNTIFS)
Descriptive Statistics (Mean, Median, Mode)
Exploratory Data Analysis (EDA)
Dashboard Design & Visualization
Tools & Technologies
Microsoft Excel – main analysis and visualization
Formulas – AVERAGEIFS, COUNTIFS etc.
PivotTables – summarizing and grouping data
Charts – Pie, Bar, Column, and Line
Optional Extensions:SQL (for future scalability)
Results & Business Recommendations
Key Findings:
Majority of bike buyers are Females with 49% rate.
Average buyer income: ≈ $57,962.
Most buyers hold a Bachelor’s degree and also with Partial College.
The Pacific region shows the highest bike purchases.
Business Recommendations:
Target marketing campaigns at middle-aged married professionals.
Focus advertising in the Pacific and North American regions.
Offer discounts or trade-in promotions for customers owning multiple cars.
Promote eco-friendly commuting among young professionals with shorter commute distances.
Consider partnerships with local gyms and eco-friendly transport initiatives.
Like this project
Posted Jan 15, 2026
Analyzed bike sales data to identify customer profiles, using Excel for dashboards.