The network for creativity
Join 1.25M professional creatives like you
Connect with clients, get discovered, and run your business 100% commission-free
Creatives on Contra have earned over $150M and we are just getting started
Back to feedPost

What actually drives sneaker purchases?
Is it the brand, the season, discounts, or the type of customer buying?
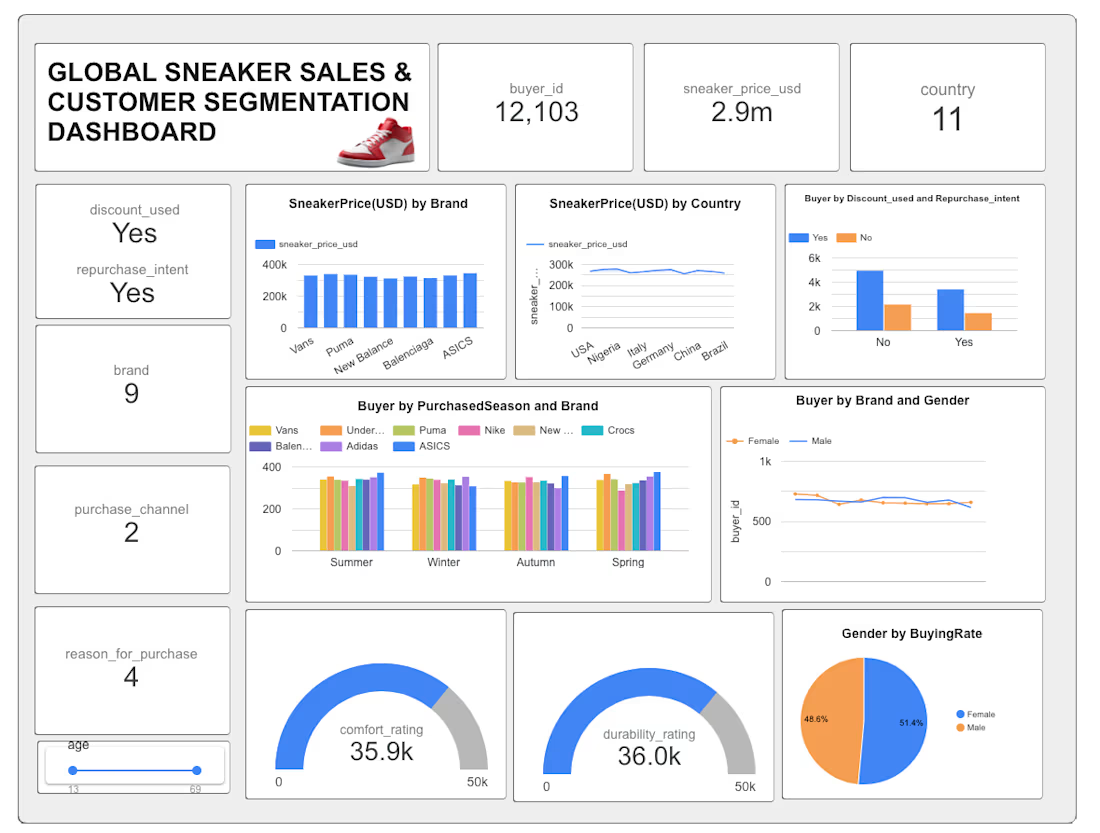
To explore this, I built an interactive Global Sneaker Sales & Customer Segmentation Dashboard to turn raw consumer data into insights businesses can use for better decision-making.
• Analyzed 12,000+ sneaker purchases
• Covered 9 major sneaker brands across 11 countries
• Examined $2.9M+ in sneaker sales data
Key Questions
• Which brands generate most revenue?
• When are they purchased?
• Do discounts influence repeat purchases?
• How do demographics affect buying behavior?
Insights
• Sneaker demand shows clear seasonal patterns
• Discounts influence repurchase behavior
• Brand performance varies across countries and demographics
Curious to hear your thoughts:
👉 What do u think influences sneaker purchases the most?

The network for creativity
Join 1.25M professional creatives like you
Connect with clients, get discovered, and run your business 100% commission-free
Creatives on Contra have earned over $150M and we are just getting started







Related posts

One business problem. Three analytical routes. One data-driven story. ☕📊
I turned raw business data into actionable decisions—not just another Power BI dashboard.
For the Onyx Data October 2026 Challenge, I worked on the Sunrise Coffee Chain analytics project, analyzing store performance, profitability, customer loyalty, revenue mix, and trading patterns across 60 UK stores (2023–2024).
🔹 My Analytical Approach
1️⃣ Python — Data Preparation
Cleaned and prepared the source datasets to establish a reliable foundation for analysis.
2️⃣ SQL — Business Analysis
Investigated store-level profitability, cost pressure, customer loyalty, revenue contribution, and trading patterns.
3️⃣ Power BI — Interactive Dashboards
Built a 3-page interactive report featuring advanced DAX measures, KPI cards, YoY comparisons, profitability analysis, and business-focused visualizations.
📊 Key Findings
• £89.7M Revenue | £16.9M Net Profit
The business recorded an aggregate net profit margin of 18.8% across the analysis period.
• Store Location Matters
Transport-Hub stores achieved a 25.1% aggregate net profit margin, compared with 18.6% for High-Street stores.
• An Area Requiring Attention
South London Corner recorded a £50.5K net loss over 24 months.
• Product Revenue Contribution
Espresso contributed 45.7% of daily revenue, while food contributed 26.1%.
• Trading Patterns
Average daily revenue was approximately 24% lower on weekends and 33% lower on UK bank holidays than on regular trading days.
💡 My Biggest Takeaway
Revenue alone does not tell the whole story. Understanding profitability, cost pressure, product contribution, and trading patterns helps businesses identify where to improve performance and make better decisions.
🔗 Explore the Complete Project
GitHub: https://github.com/SajeebTheAnalyst/sunrise-coffee-chain-analytics
If you were advising the management team, which finding would you investigate first—and why?
#DataAnalytics #SQL #PowerBI #Python #DAX #BusinessIntelligence #DataVisualization #OnyxData


I would investigate South London Corner first. Break the 24-month loss into store-month revenue, direct costs and allocated costs, then compare it with similar stores over matched trading periods. Reconcile at store-month grain before joining product or loyalty tables so a...

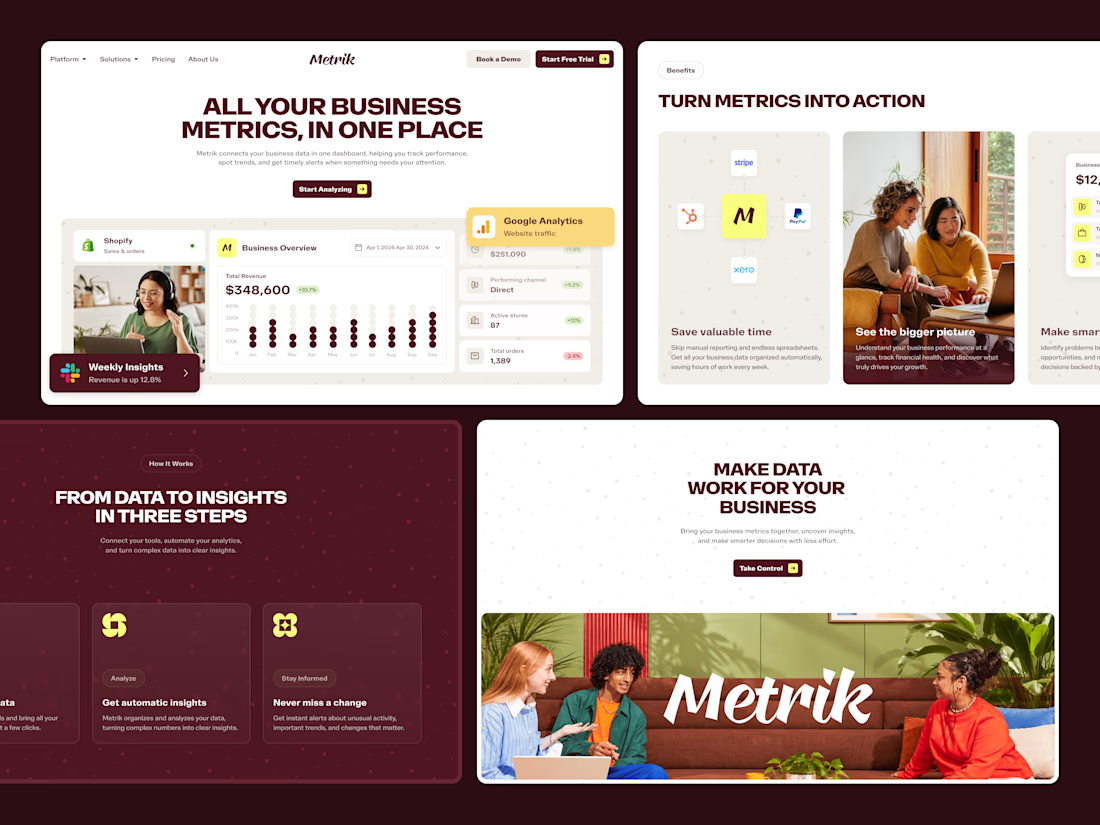
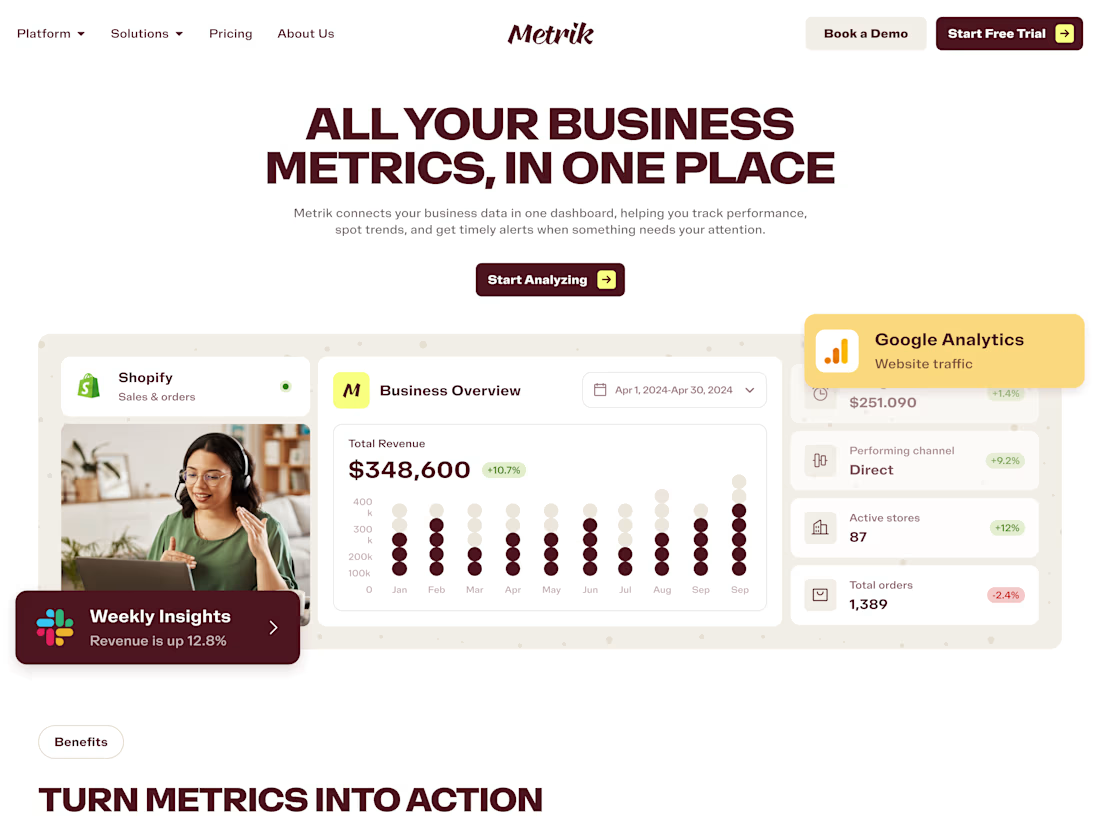
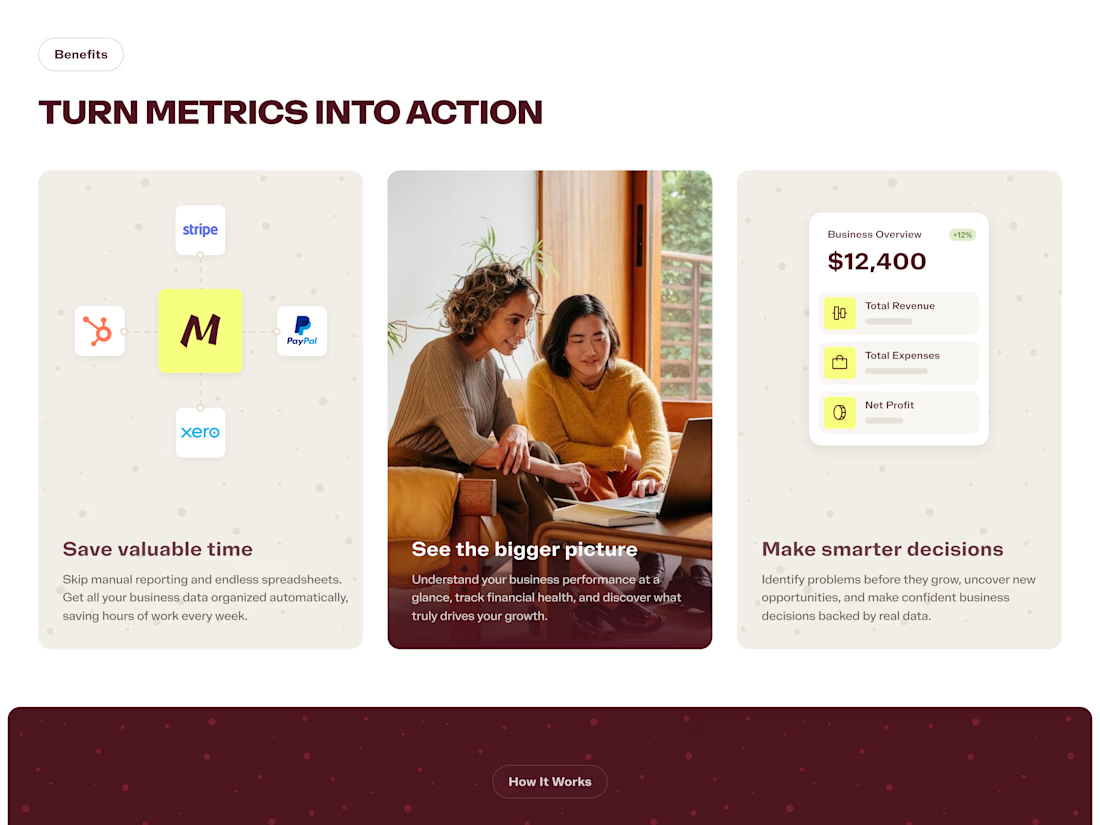
Metrik is a Business Intelligence SaaS platform that helps businesses bring essential metrics together, automate analytics, and uncover insights. We designed a landing page that presents the product as approachable and clear, with structured content, dashboard previews, and a distinctive burgundy and yellow visual identity.
Explore the project on Dribbble:
https://dribbble.com/shots/27798399-Landing-Page-Business-Intelligence-SaaS


I asked myself: if I were the design head at a sneaker brand launching a new shoe, how would I market it?
Most sneaker launches are loud, with hard cuts, heavy type and hype. I wanted to try the opposite. Cloud Flow is a quiet runner, and the site should feel the way the shoe is meant to feel.
The idea
The product is soft, light and calm, so the whole page is built around that. The name suggested clouds and air. The mood is late-night editorial: a dark page, the shoe lit like a gallery piece, and plenty of space around it. Self-initiated concept. Designed and coded by hand in HTML, CSS and JS. Tags: #WebDesign #Sneakers #LandingPage #MotionDesign #UIDesign #Branding


