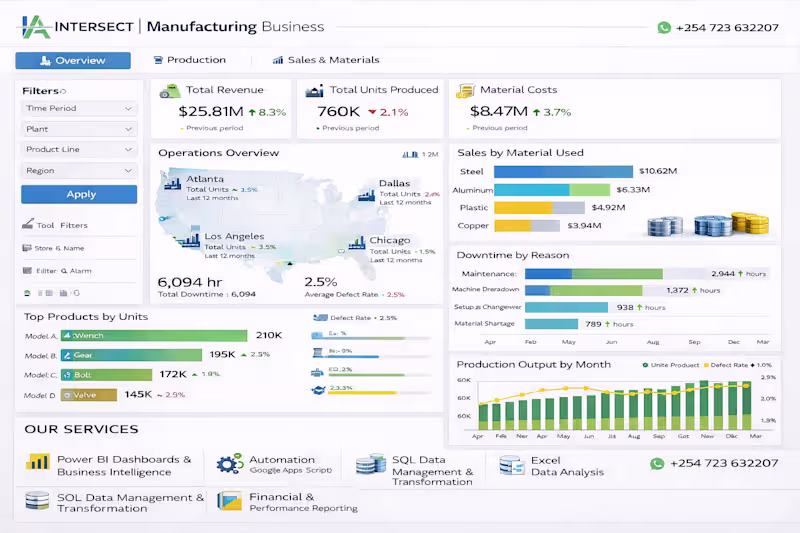
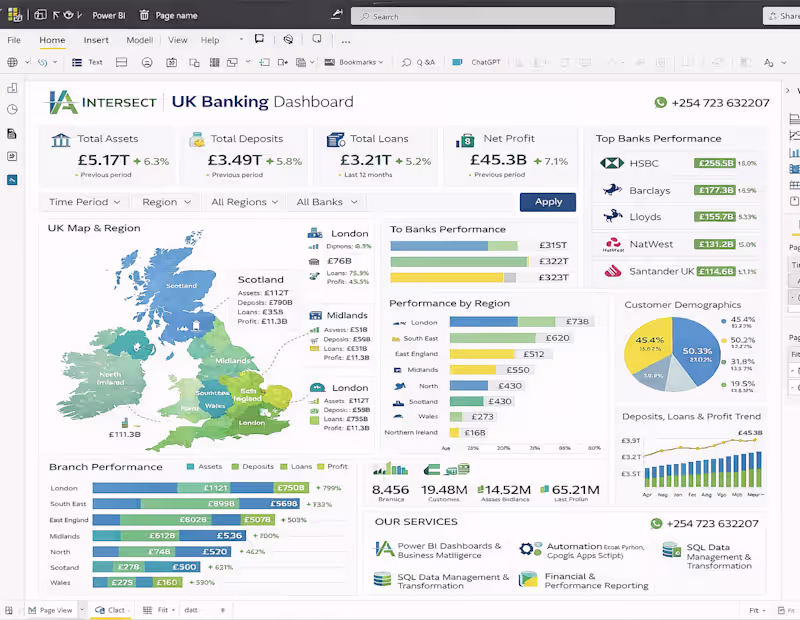
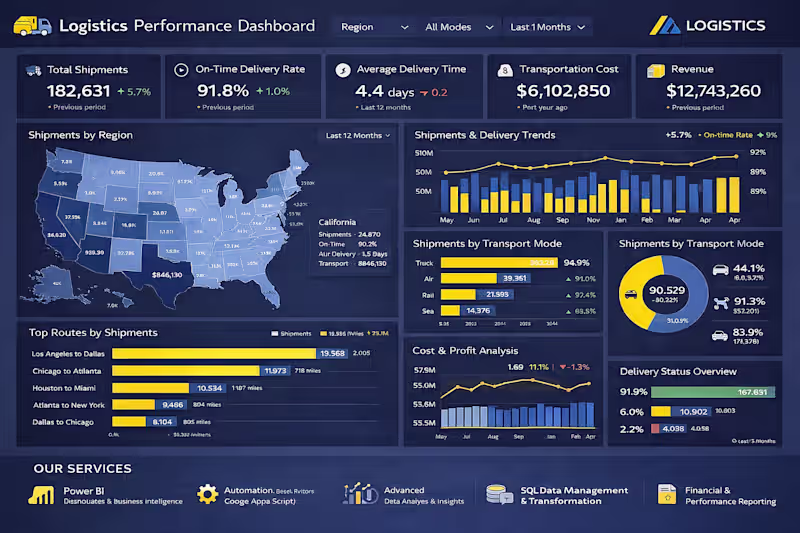
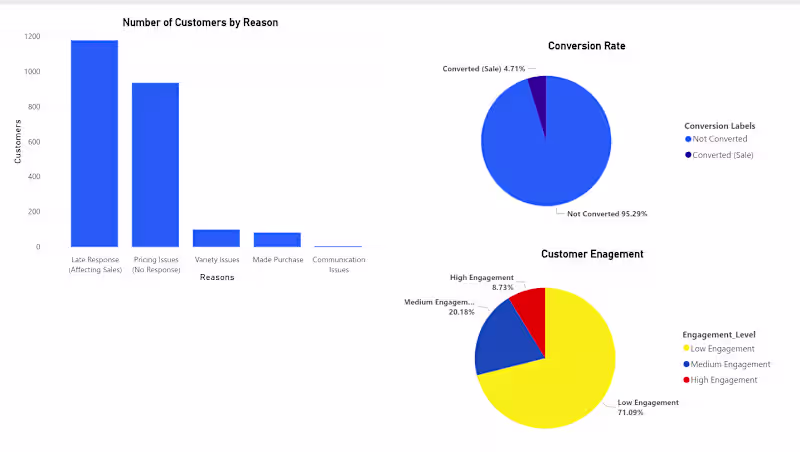
Data Engineering and Automation

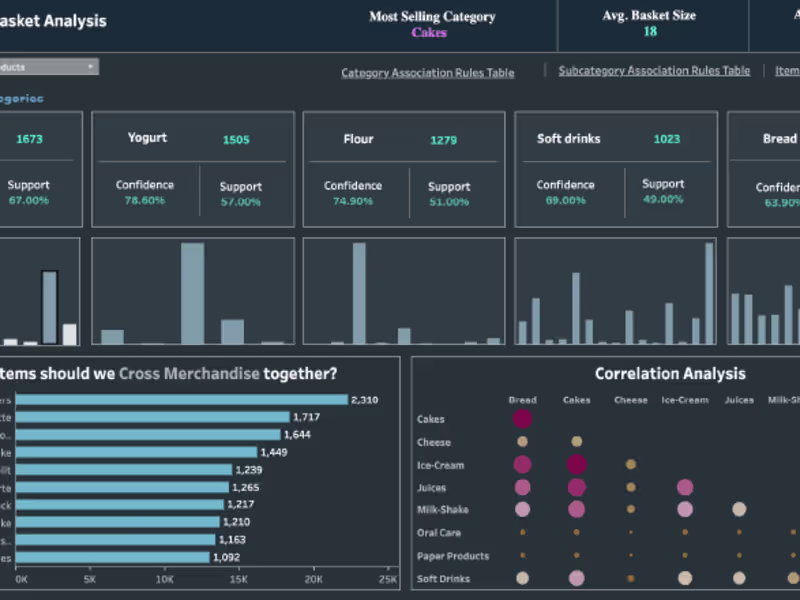
Analytics Specialist and Data Visualizer
- $1k+
- Earned
- 3x
- Hired
- 5.0
- Rating
- 34
- Followers
Analytics Specialist and Data Visualizer
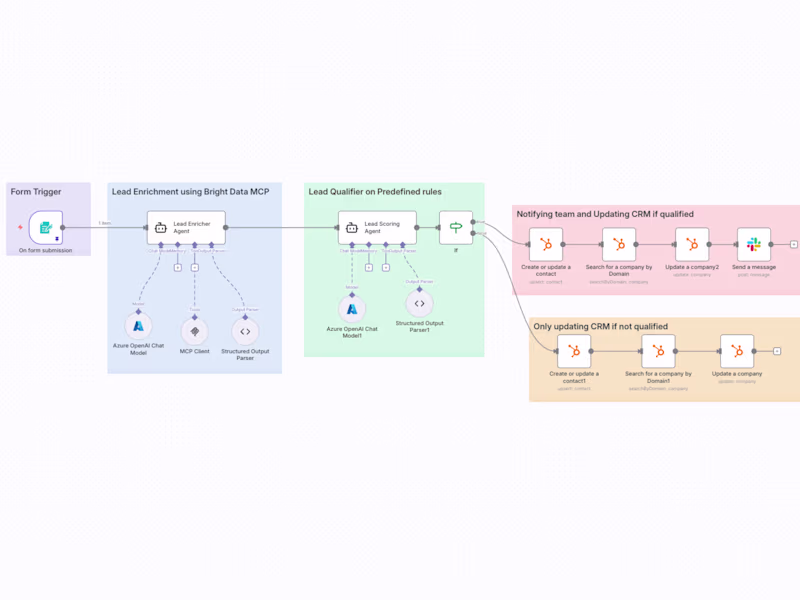
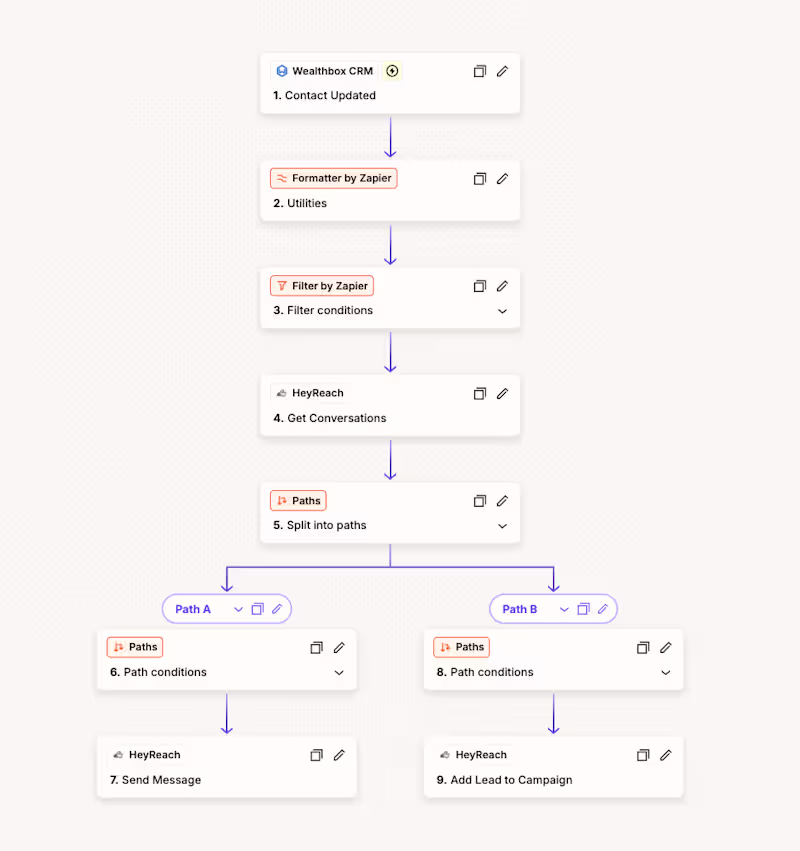
Helping B2B businesses unlock growth with AI & Automations
- $5k+
- Earned
- 5x
- Hired
- 5.0
- Rating
- 15
- Followers
Helping B2B businesses unlock growth with AI & Automations
Delivering Strategic Growth Through Data, Finance & Tech.
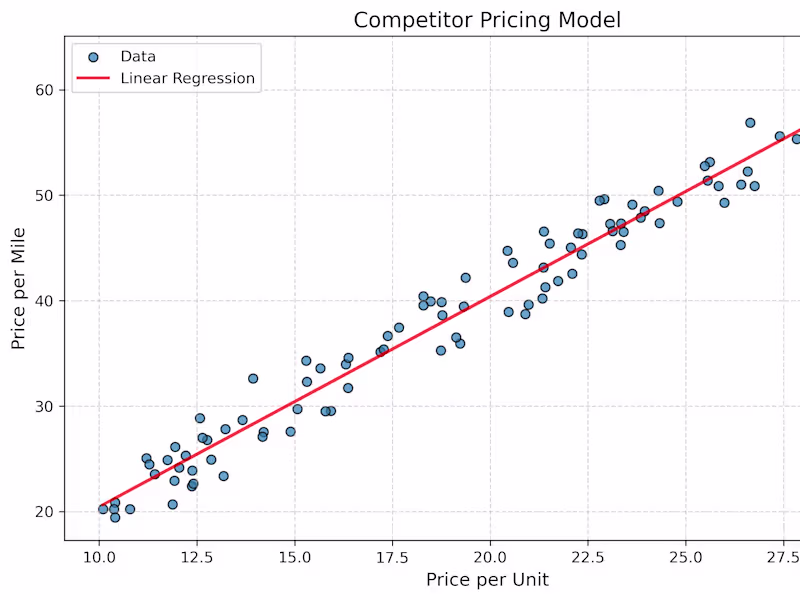
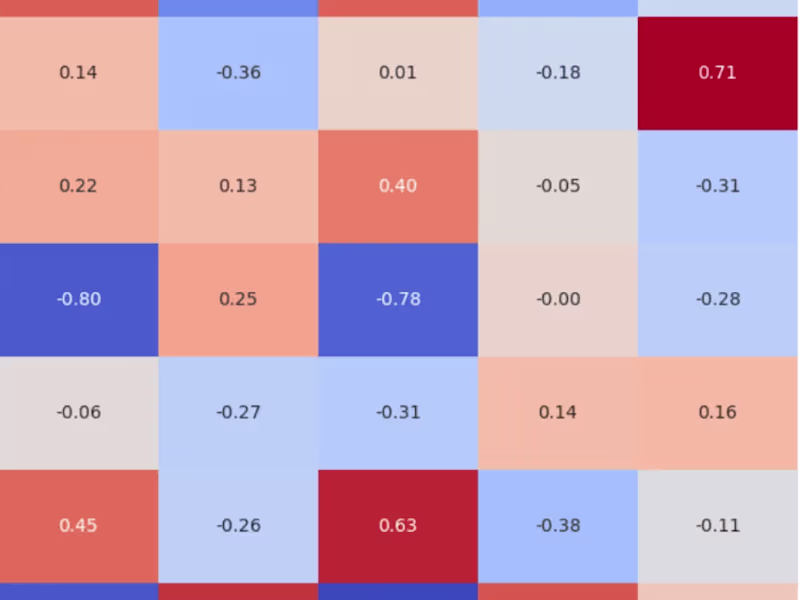
Data Scientist delivering insights through analytics and ML
Data Scientist delivering insights through analytics and ML

View more →
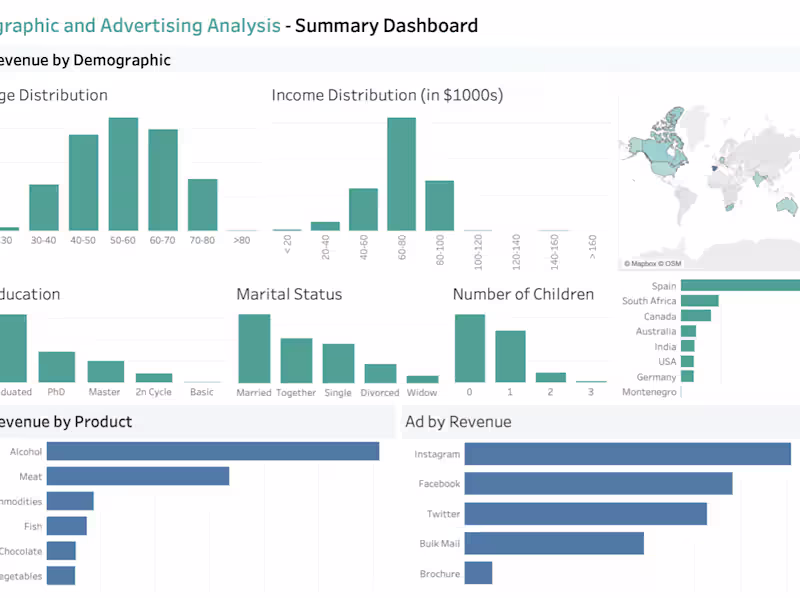
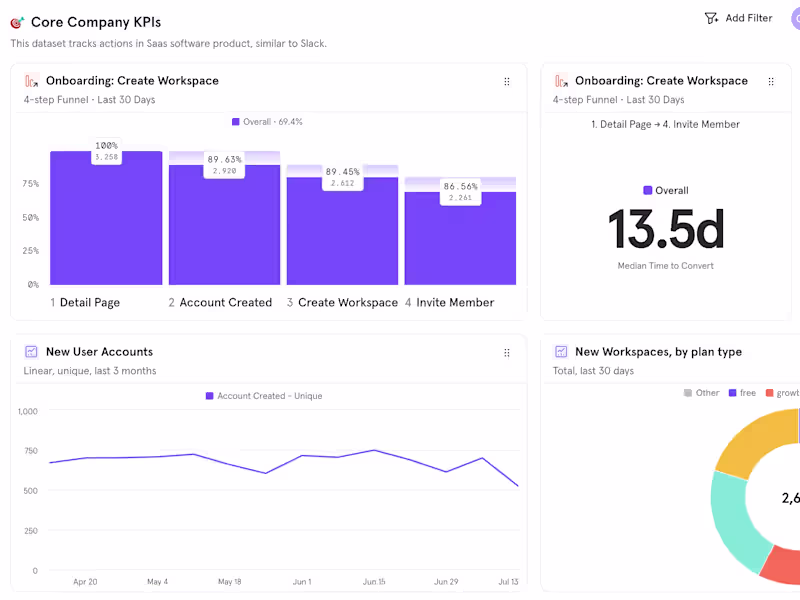
Storytelling with Data Beyond Dashboards
Storytelling with Data Beyond Dashboards
View more →
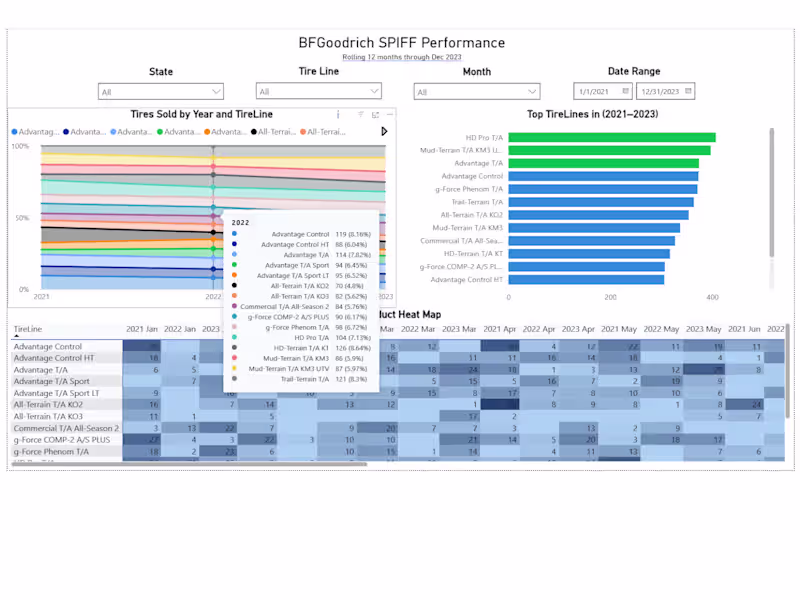
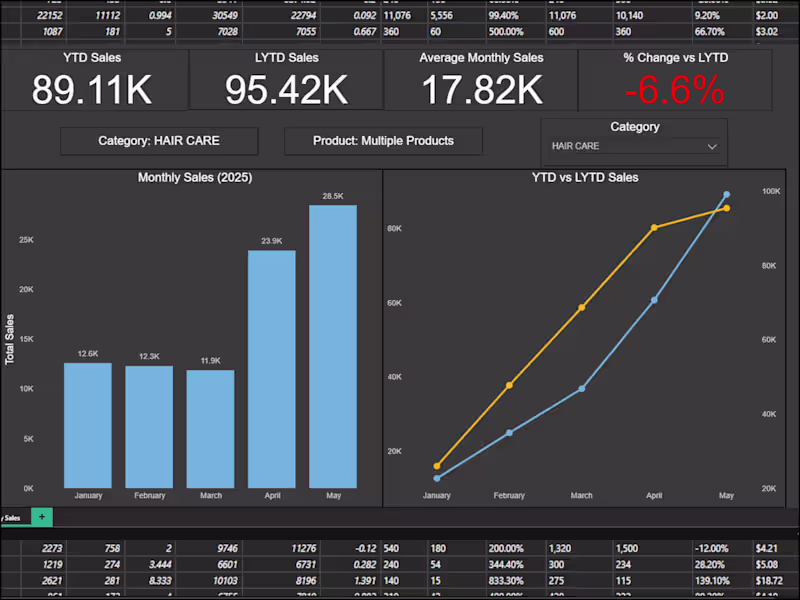
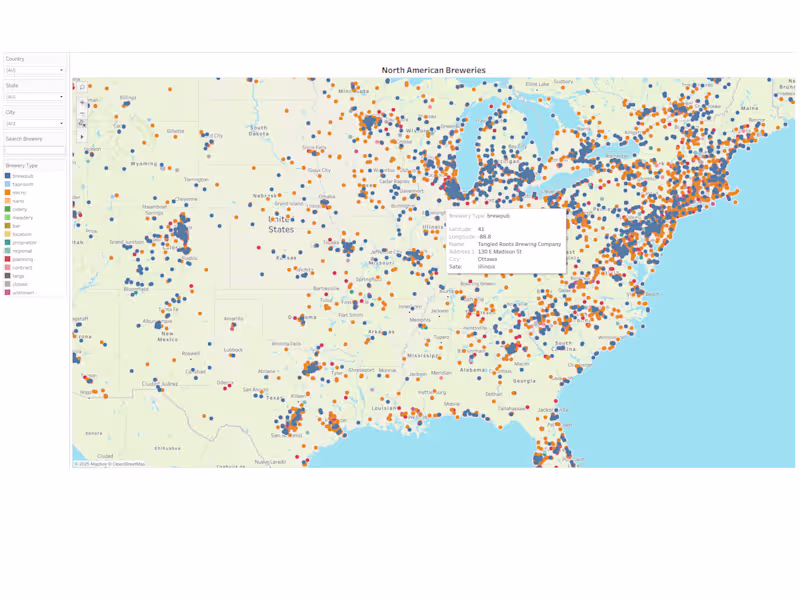
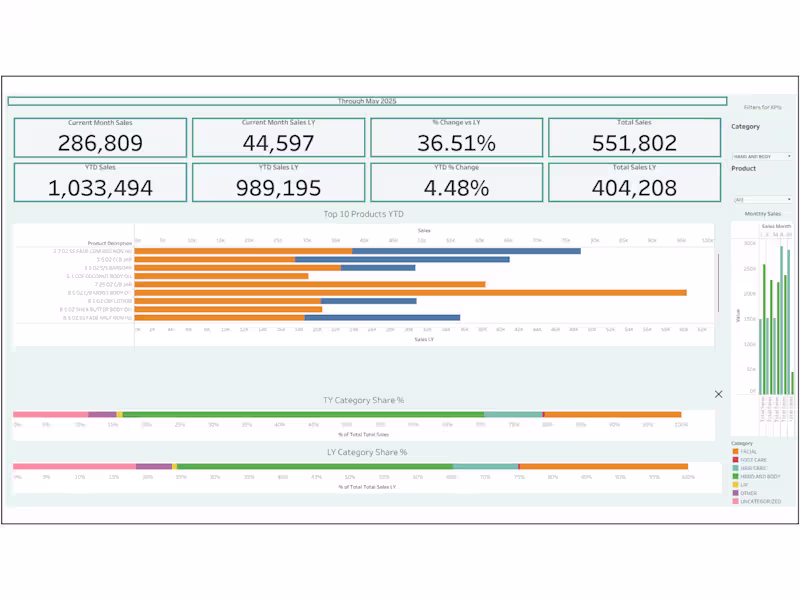
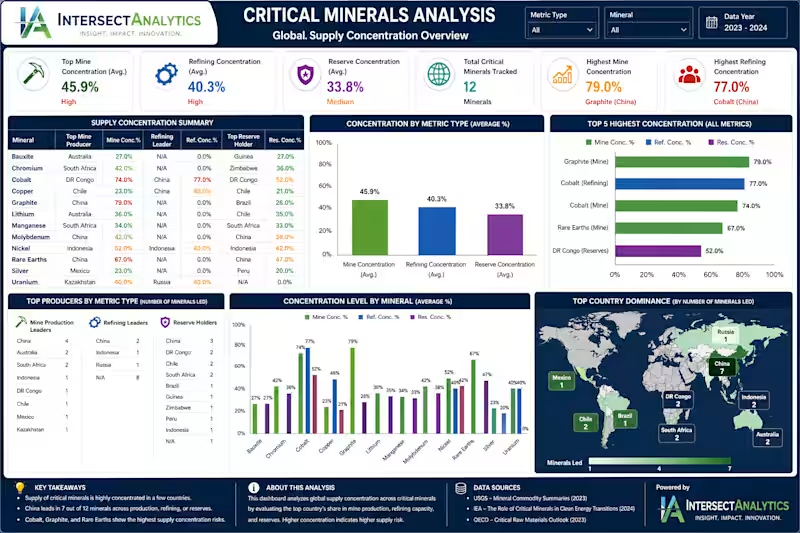
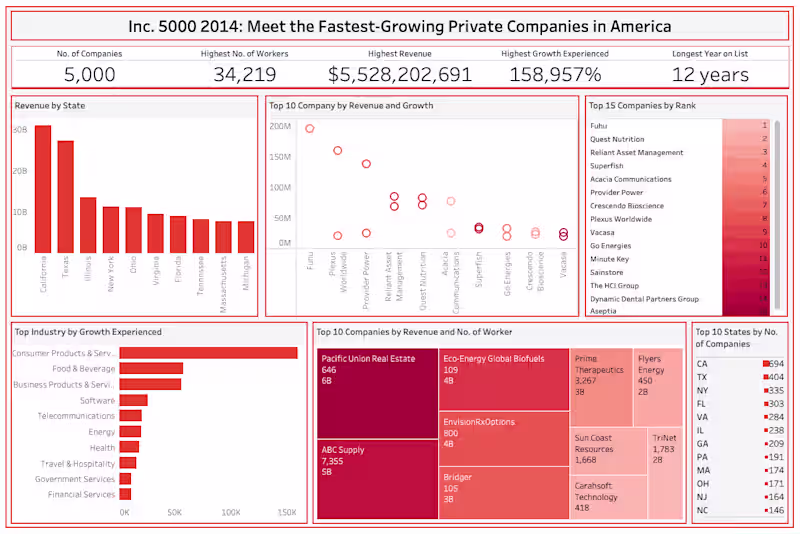
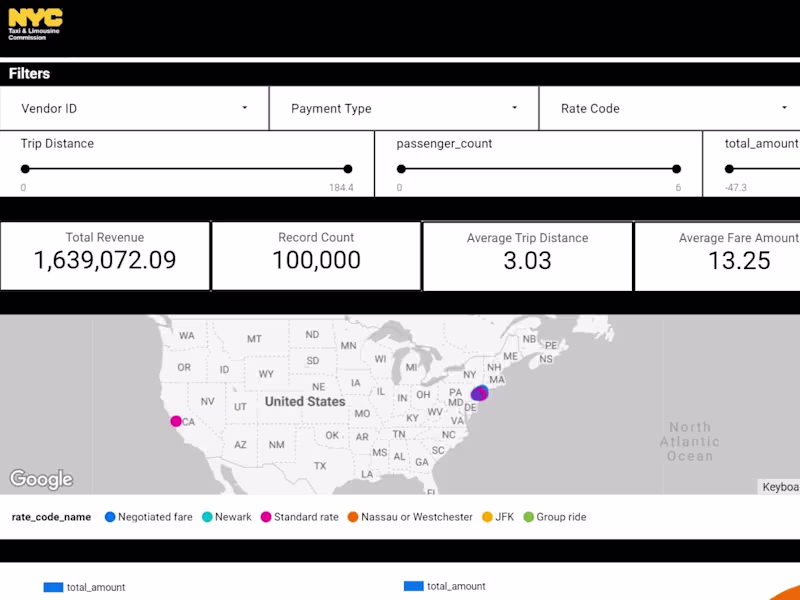
Data Analyst | SQL, PowerBI, Tableau, Python
Data Analyst | SQL, PowerBI, Tableau, Python

View more →
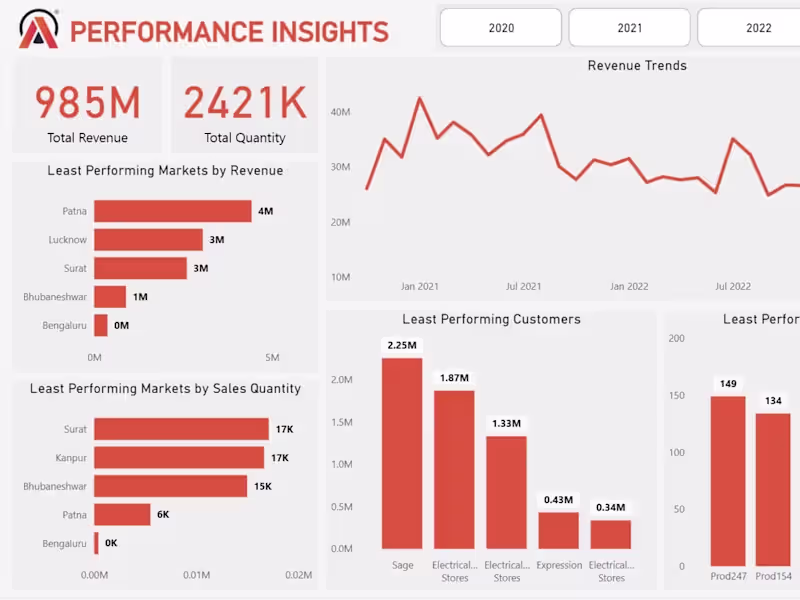
Excel & Power BI Freelancer | Clean Reporting, On Time